Unisys Operations Sentinel Data Center Automation Jim Malnati

- Slides: 29

Unisys Operations Sentinel: Data Center Automation Jim Malnati

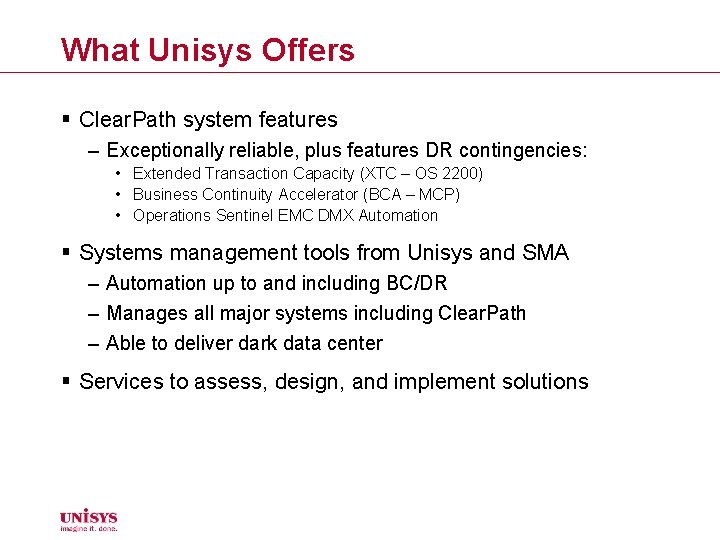
What Unisys Offers § Clear. Path system features – Exceptionally reliable, plus features DR contingencies: • Extended Transaction Capacity (XTC – OS 2200) • Business Continuity Accelerator (BCA – MCP) • Operations Sentinel EMC DMX Automation § Systems management tools from Unisys and SMA – Automation up to and including BC/DR – Manages all major systems including Clear. Path – Able to deliver dark data center § Services to assess, design, and implement solutions

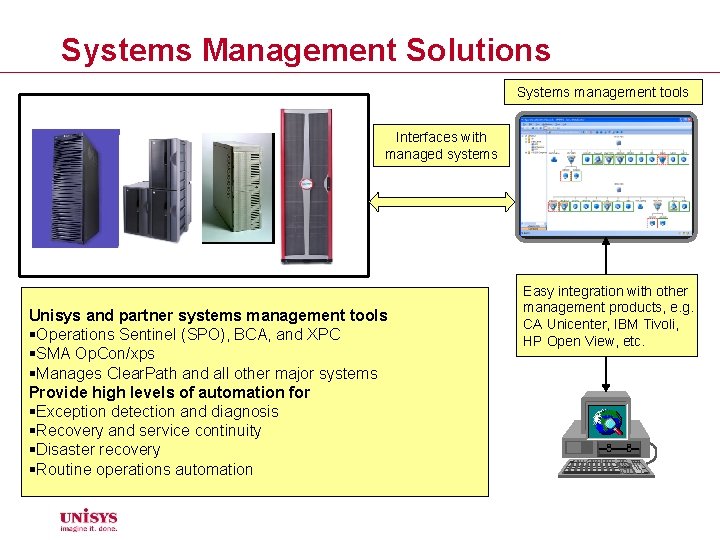
Systems Management Solutions Systems management tools Interfaces with managed systems Unisys and partner systems management tools §Operations Sentinel (SPO), BCA, and XPC §SMA Op. Con/xps §Manages Clear. Path and all other major systems Provide high levels of automation for §Exception detection and diagnosis §Recovery and service continuity §Disaster recovery §Routine operations automation Easy integration with other management products, e. g. CA Unicenter, IBM Tivoli, HP Open View, etc.

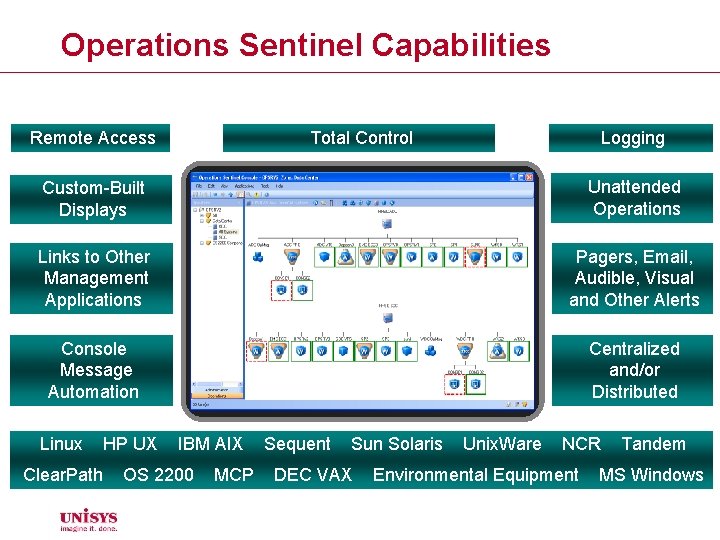
Operations Sentinel Capabilities Remote Access Total Control Logging Custom-Built Displays Unattended Operations Links to Other Management Applications Pagers, Email, Audible, Visual and Other Alerts Console Message Automation Centralized and/or Distributed Linux HP UX Clear. Path IBM AIX OS 2200 MCP Sequent Sun Solaris DEC VAX Unix. Ware NCR Environmental Equipment Tandem MS Windows

Operations Sentinel 11 • Complete user interface rewrite – – C#. NET to leverage Microsoft GUI R&D Conforms to Microsoft standards: enhanced look and feel 3 rd-party products removed and features added Global configuration means less maintenance • Topologies: system component monitoring – Object oriented toolkit to monitor virtually anything • New Windows and Linux/UNIX Resource Monitors – – WMI-based monitoring of many Windows objects Linux/UNIX agents with optional site-defined modules One-click distribution of multiple Resource Monitor policies Expand monitoring to additional system types at no cost

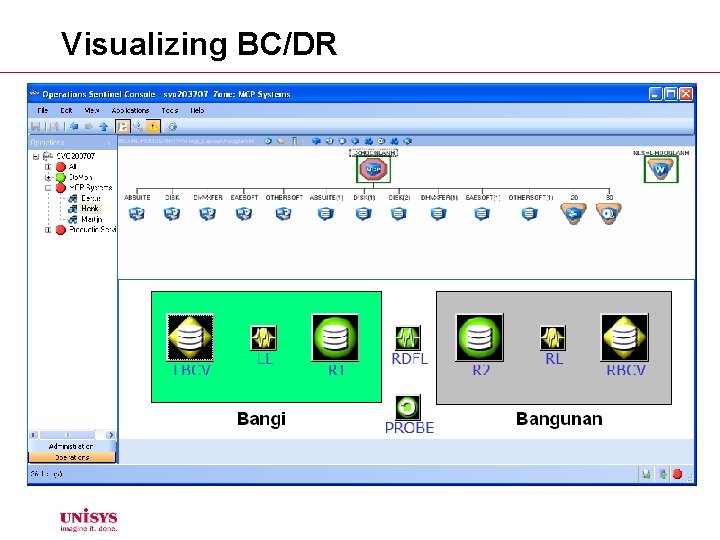
Visualizing BC/DR

Summary and Recommendations • Implement BCA or XPC for system-level resilience – Industry-leading business continuance • Use Op. Con/xps to ensure: – Applications are healthy, proper levels are installed, etc – Monitor J 2 EE environment – Provide event-driven automation • Customize Operations Sentinel to provide: – Visualization of all system and network components – Cross-platform automation at the console level – Automate EMC Symmetrix Manager BCV/SRDF operations

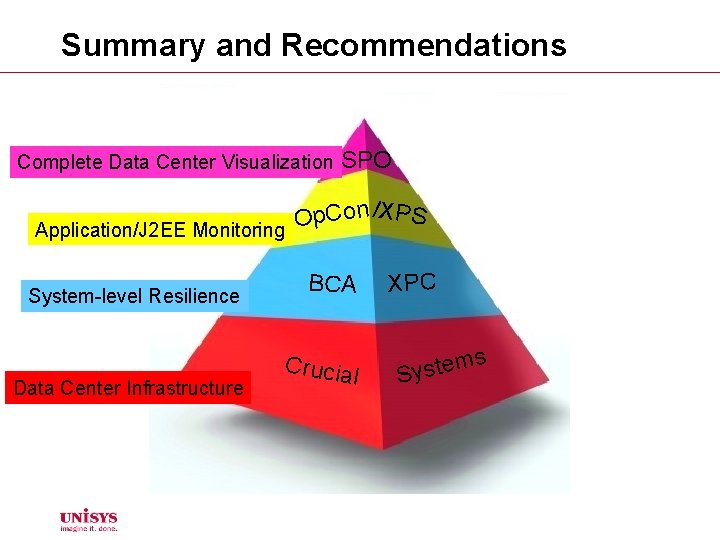
Summary and Recommendations Complete Data Center Visualization SPO p. Con /XPS O Application/J 2 EE Monitoring System-level Resilience Data Center Infrastructure BCA Crucia l XPC s m e t s Sy

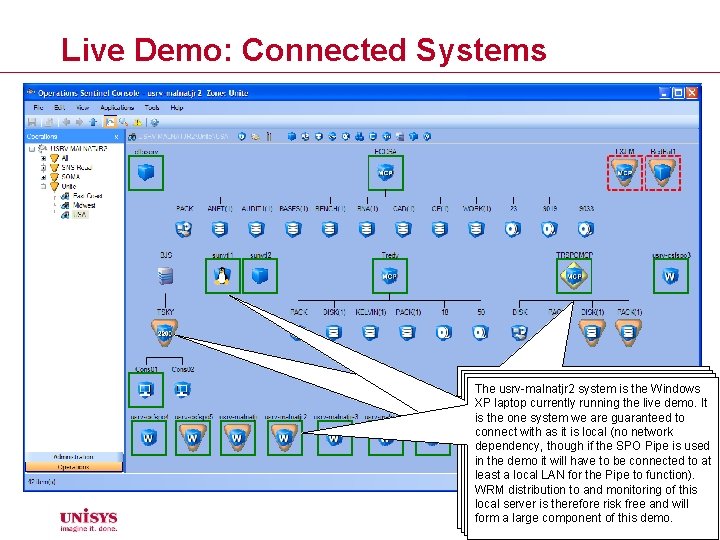
Live Demo: Connected Systems ECCSA, Tredy, and TRSPOMCP are The BJS system, TSKY partition, andthree This icon could represent a UNIX/Linux The usrv-malnatjr 2 system is the Windows MCP systems located in the by East Cons 01 console are driven thefor OS 2200 system running under VMWare, instance, XP laptop currently running the live demo. It Data Center (ECDC). The components Console Simulator (an unsupported utility) or connected to a remote system. In this is the one system we are guaranteed beneath each auto-discovered disk to pack but could be aare live, remotely connected case it is a Sun Solaris server providing VLT connectindividual with as itdisks, is local (notape network families, and drives. system. OS 2200 systems can have capabilities forthough an OS 2200 system. The dependency, thethe SPO Pipe These will be used laterif in demo to is used thresholds set/exceeded as with MCP UNIX/Linux Resource Monitor (ULRM) could in the demo it will have to be connected illustrate how may generated in to at systems. Thealerts anybe system generates trigger alerts from these system types, but least a local LAN for the Pipe to function). response to exceeded thresholds. Here may trigger external actions (such as for a live demo it istorecommended that WRM distribution and of the this TRSPOMCP has hostandmonitoring component-level text/email message, audible alerts, etc) Windows Resource Monitor (WRM) be used local server isare therefore risk free and will thresholds that causing alerts. through the Alert Policy. instead (less component risky). form a large of this demo.

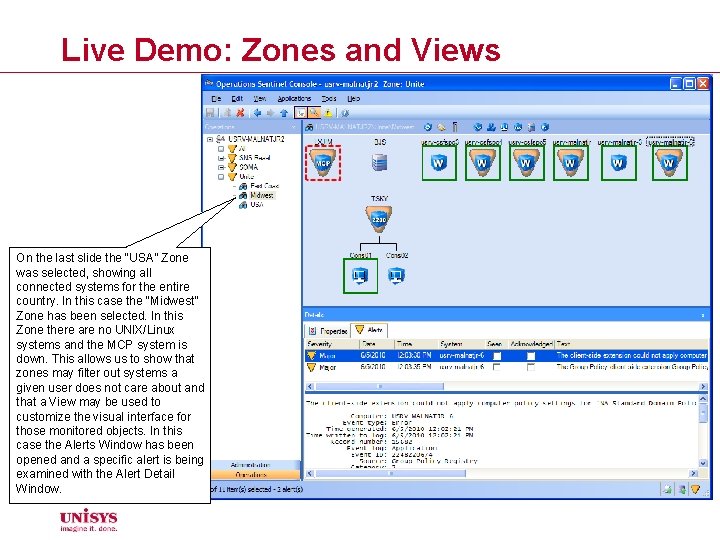
Live Demo: Zones and Views On the last slide the “USA” Zone was selected, showing all connected systems for the entire country. In this case the “Midwest” Zone has been selected. In this Zone there are no UNIX/Linux systems and the MCP system is down. This allows us to show that zones may filter out systems a given user does not care about and that a View may be used to customize the visual interface for those monitored objects. In this case the Alerts Window has been opened and a specific alert is being examined with the Alert Detail Window.

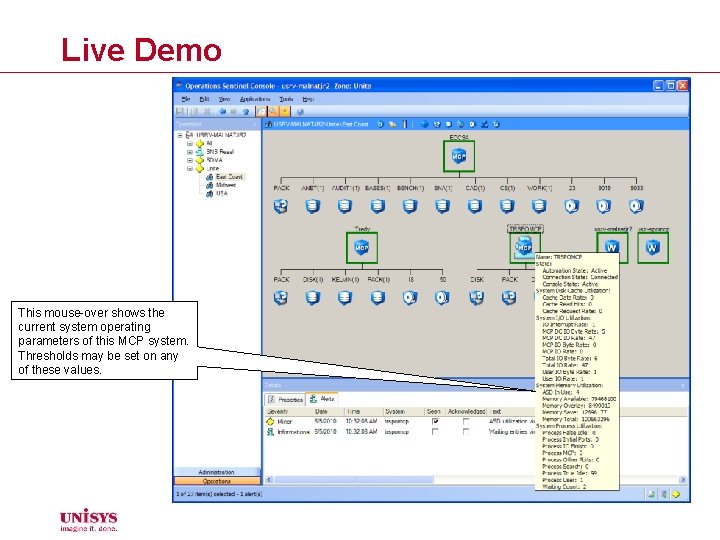
Live Demo This mouse-over shows the current system operating parameters of this MCP system. Thresholds may be set on any of these values.

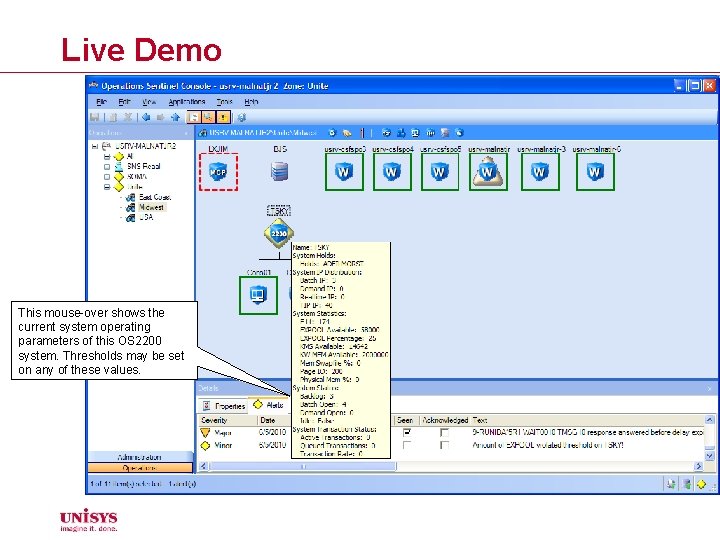
Live Demo This mouse-over shows the current system operating parameters of this OS 2200 system. Thresholds may be set on any of these values.

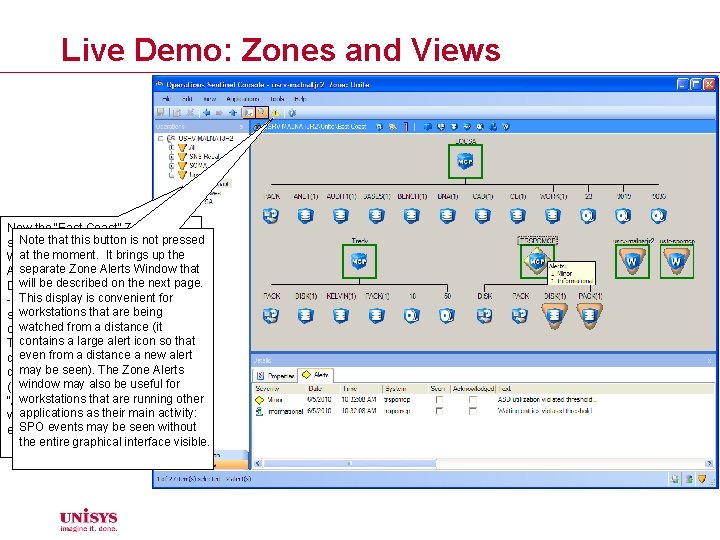
Live Demo: Zones and Views Now the “East Coast” Zone is Note that. It this button is not pressed selected. contains MCP and at the moment. It brings up the Windows systems, with only the separate Zone Alerts Window open (the. Window Alert that will be described on the page. Detail Window is closed). Anext mouse Thison display is convenient for -over the TRSPOMCP system workstations thatofare shows a summary thebeing watched from a distance (it outstanding alerts on that host. contains large alerthigh iconlevel so that This windowa provides even from a distance a new alert detail on the alerts, which in this mayhave be seen). Themarked Zone Alerts case not been “Seen” window may be useful or for (affects only thisalso workstation) workstations that are running other “Acknowledged” (affects all applications Both as their main activity: workstations). alerts describe SPO events may be seen exceeded MCP thresholds. without the entire graphical interface visible.

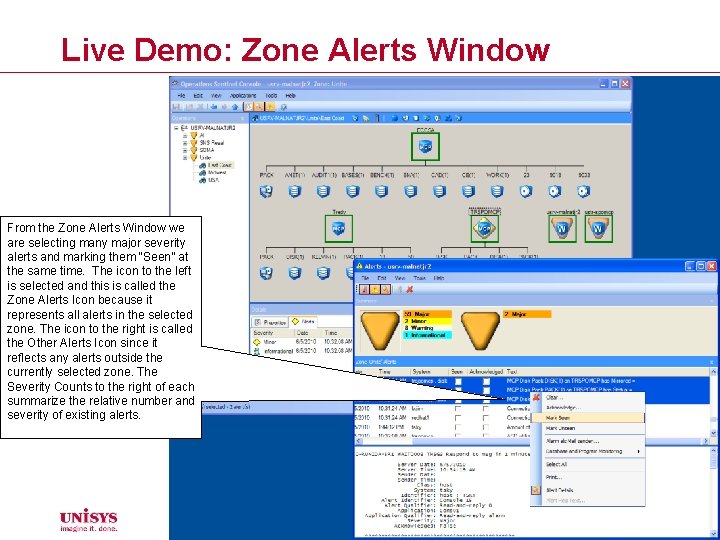
Live Demo: Zone Alerts Window From the Zone Alerts Window we are selecting many major severity alerts and marking them “Seen” at the same time. The icon to the left is selected and this is called the Zone Alerts Icon because it represents all alerts in the selected zone. The icon to the right is called the Other Alerts Icon since it reflects any alerts outside the currently selected zone. The Severity Counts to the right of each summarize the relative number and severity of existing alerts.

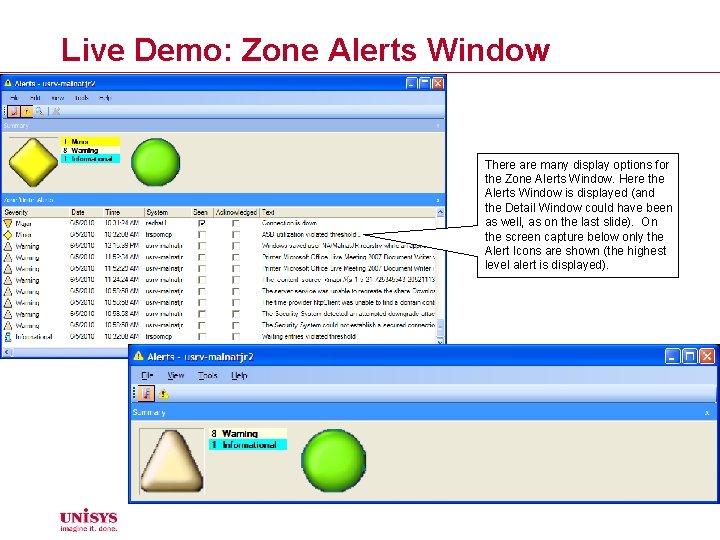
Live Demo: Zone Alerts Window There are many display options for the Zone Alerts Window. Here the Alerts Window is displayed (and the Detail Window could have been as well, as on the last slide). On the screen capture below only the Alert Icons are shown (the highest level alert is displayed).

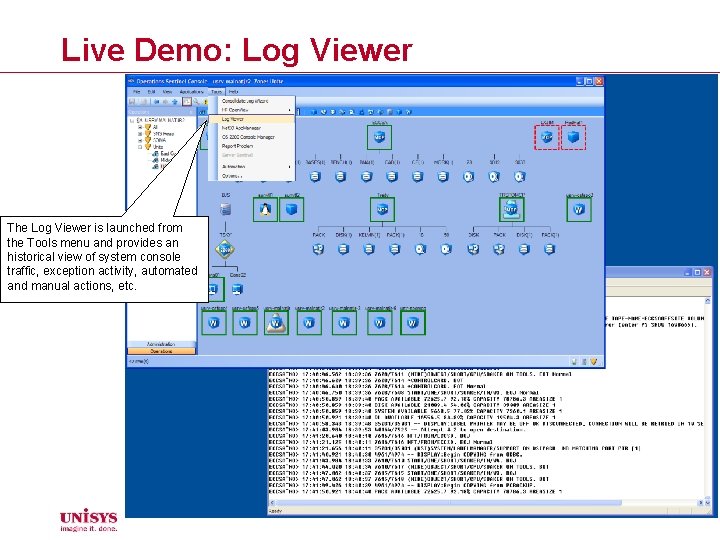
Live Demo: Log Viewer The Log Viewer is launched from the Tools menu and provides an historical view of system console traffic, exception activity, automated and manual actions, etc.

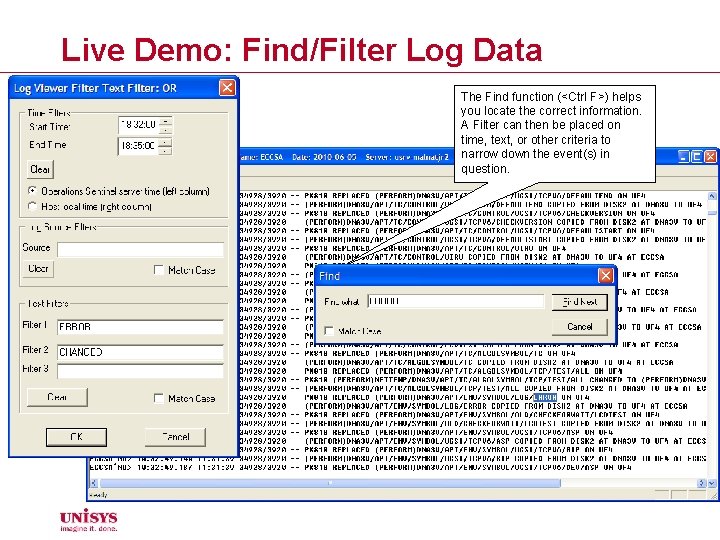
Live Demo: Find/Filter Log Data The Find function (<Ctrl F>) helps you locate the correct information. A Filter can then be placed on time, text, or other criteria to narrow down the event(s) in question.

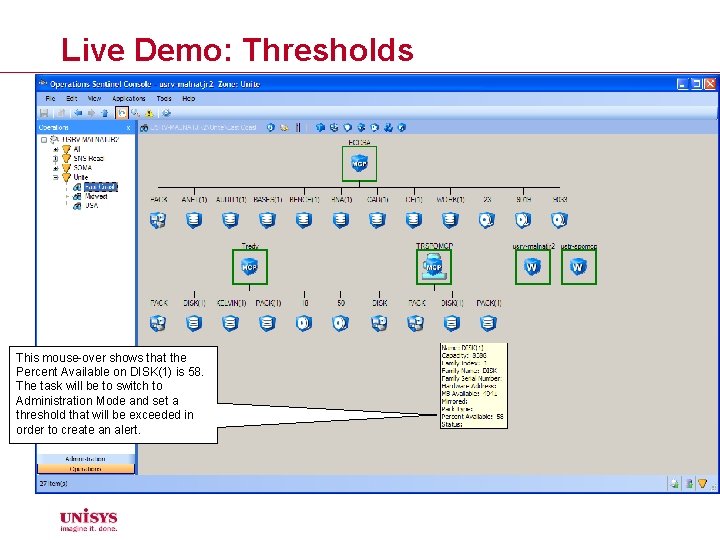
Live Demo: Thresholds This mouse-over shows that the Percent Available on DISK(1) is 58. The task will be to switch to Administration Mode and set a threshold that will be exceeded in order to create an alert.

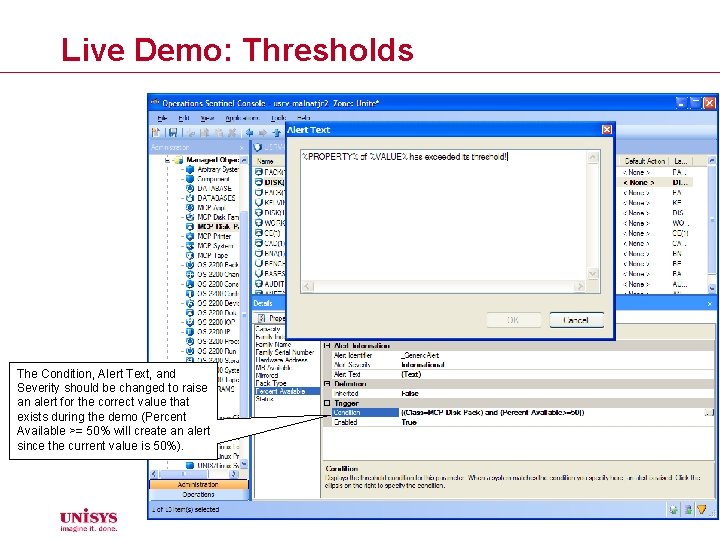
Live Demo: Thresholds The Condition, Alert Text, and Severity should be changed to raise an alert for the correct value that exists during the demo (Percent Available >= 50% will create an alert since the current value is 50%).

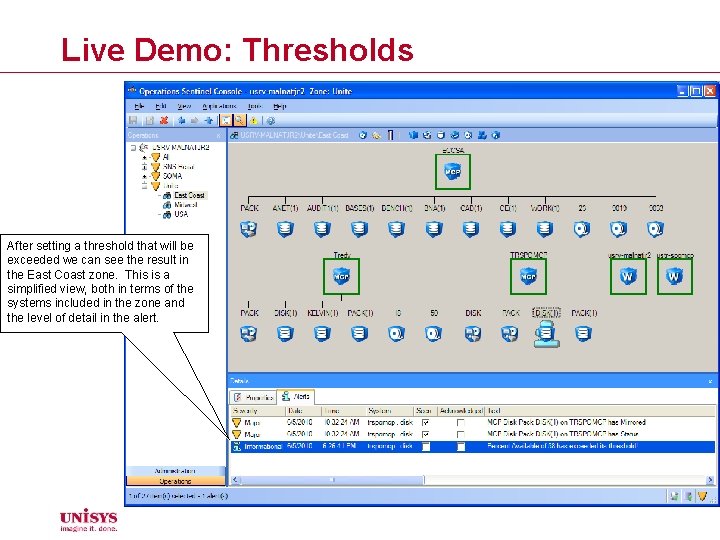
Live Demo: Thresholds After setting a threshold that will be exceeded we can see the result in the East Coast zone. This is a simplified view, both in terms of the systems included in the zone and the level of detail in the alert.

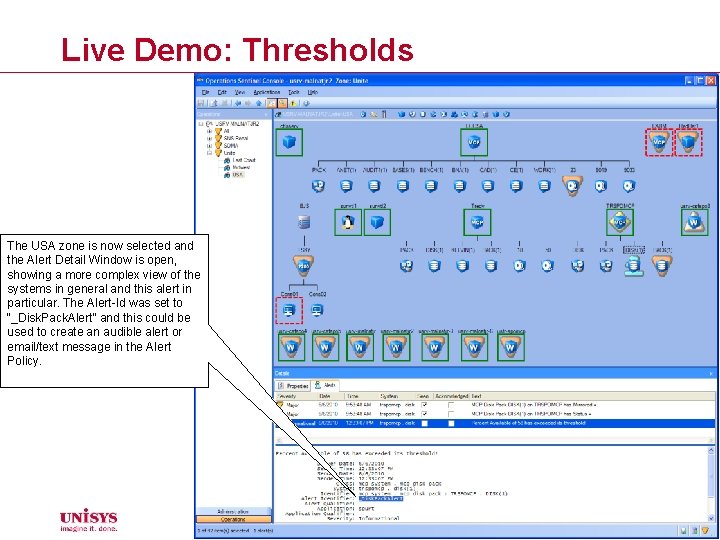
Live Demo: Thresholds The USA zone is now selected and the Alert Detail Window is open, showing a more complex view of the systems in general and this alert in particular. The Alert-Id was set to “_Disk. Pack. Alert” and this could be used to create an audible alert or email/text message in the Alert Policy.

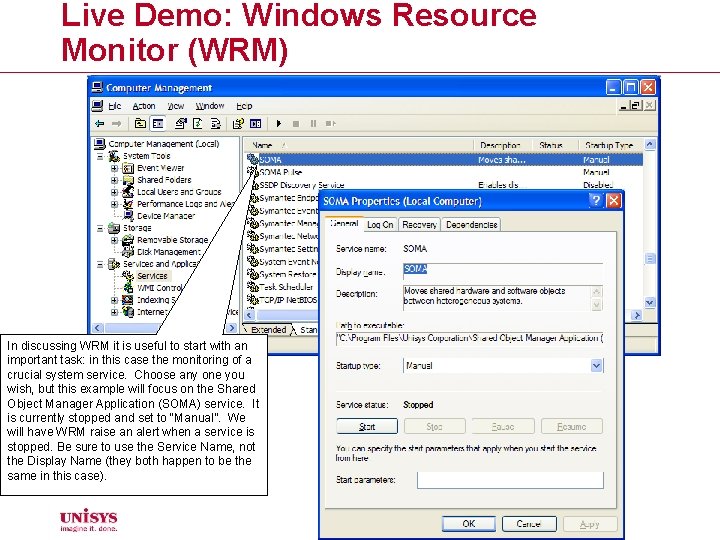
Live Demo: Windows Resource Monitor (WRM) In discussing WRM it is useful to start with an important task: in this case the monitoring of a crucial system service. Choose any one you wish, but this example will focus on the Shared Object Manager Application (SOMA) service. It is currently stopped and set to “Manual”. We will have WRM raise an alert when a service is stopped. Be sure to use the Service Name, not the Display Name (they both happen to be the same in this case).

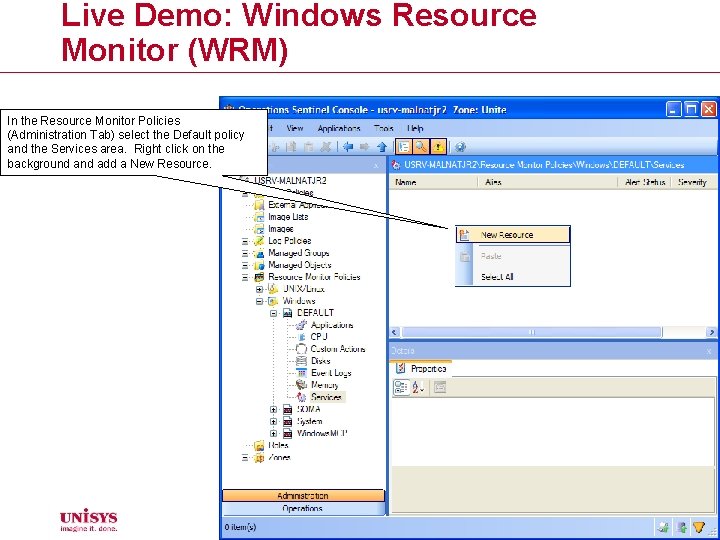
Live Demo: Windows Resource Monitor (WRM) In the Resource Monitor Policies (Administration Tab) select the Default policy and the Services area. Right click on the background add a New Resource.

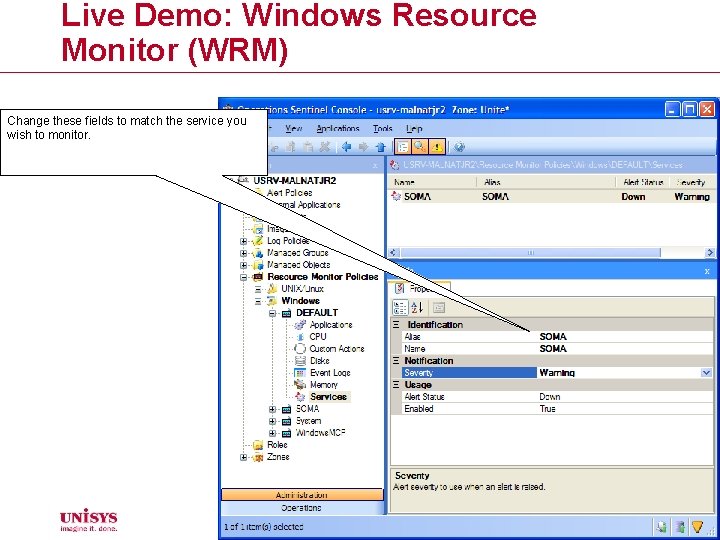
Live Demo: Windows Resource Monitor (WRM) Change these fields to match the service you wish to monitor.

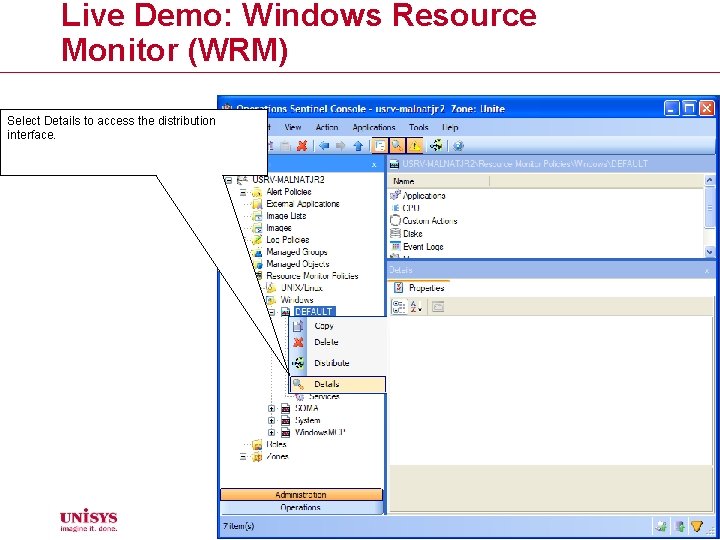
Live Demo: Windows Resource Monitor (WRM) Select Details to access the distribution interface.

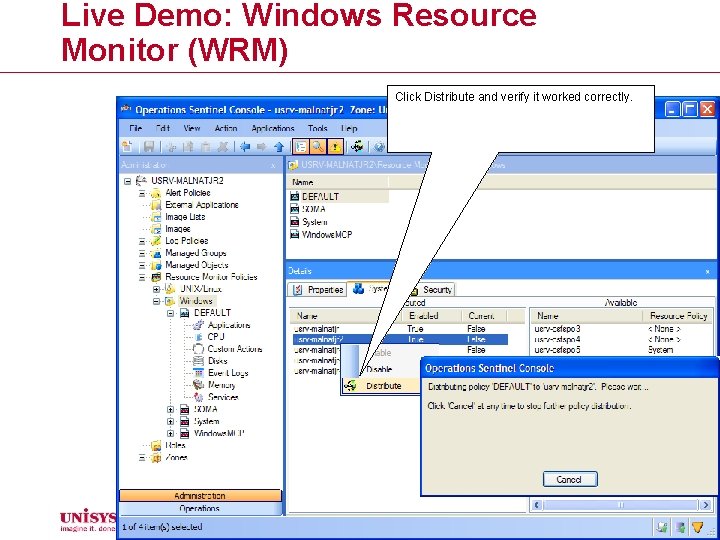
Live Demo: Windows Resource Monitor (WRM) Click Distribute and verify it worked correctly.

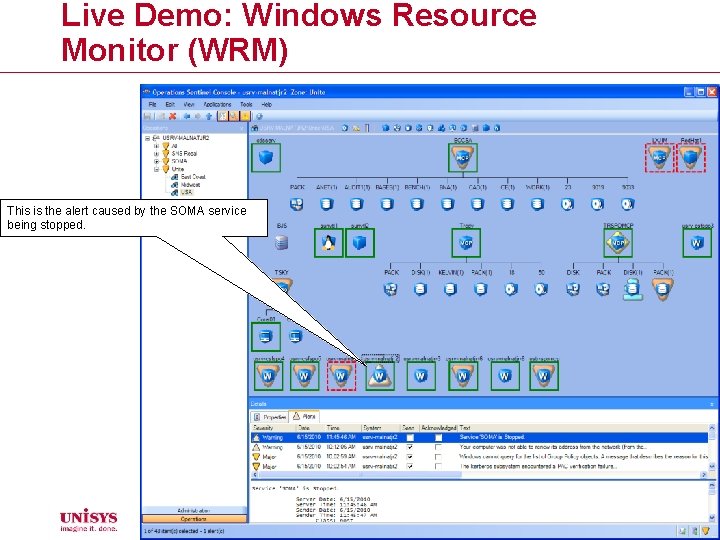
Live Demo: Windows Resource Monitor (WRM) This is the alert caused by the SOMA service being stopped.

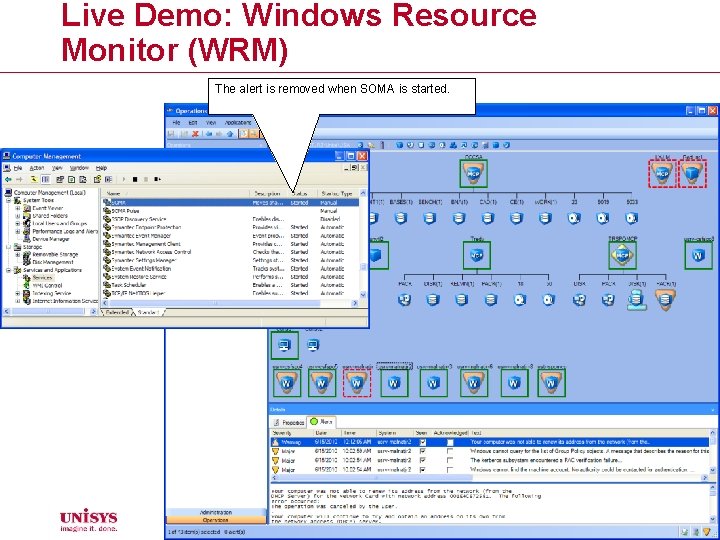
Live Demo: Windows Resource Monitor (WRM) The alert is removed when SOMA is started.
