Topic 2 Financial Statements and Cash Flow Prof


- Slides: 45
Topic 2. Financial Statements and Cash Flow Prof. dr. A Paškevičius
Financial Statements and Cash Flow 2. 1 The Balance sheet 2. 2 The Income Statement 2. 3 Cash flow 2. 4 Cash Flow and Financial Statements
The Balance Sheet The balance sheet is a financial statement showing the firm’s accounting value on a particular date § The balance sheet is a snapshot of the firm’s assets and liabilities at a given point in time § Assets are listed in order of liquidity § Ease of conversion to cash § Without significant loss of value § Balance Sheet Identity § Assets = Liabilities + Stockholders’ Equity
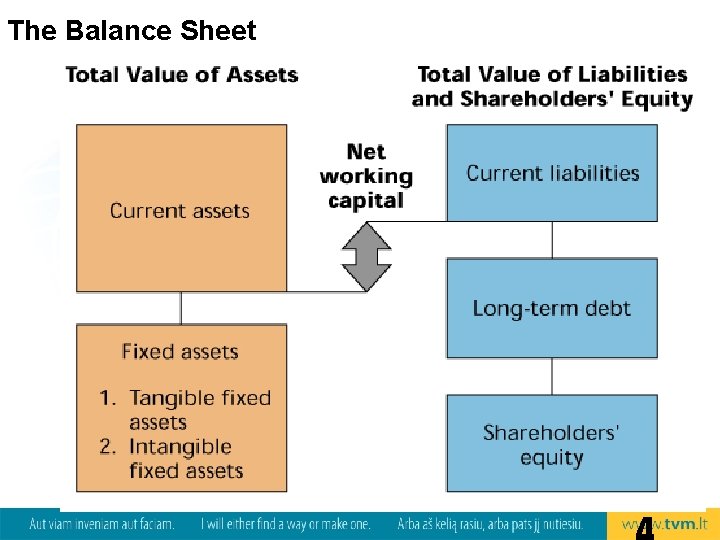
The Balance Sheet
The Balance Sheet A fixed asset is one that has a relatively long life. A current asset will convert to cash within 12 months. Shareholders' equity, or common equity reflects the fact that, if the firm were to sell all of its assets and use the money to payoff its debts, then whatever residual value remained would belong to the shareholders.
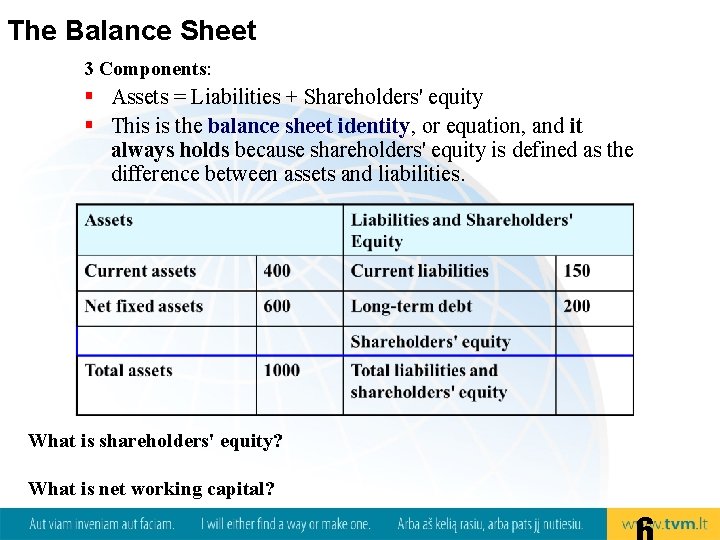
The Balance Sheet 3 Components: § Assets = Liabilities + Shareholders' equity § This is the balance sheet identity, or equation, and it always holds because shareholders' equity is defined as the difference between assets and liabilities. What is shareholders' equity? What is net working capital?
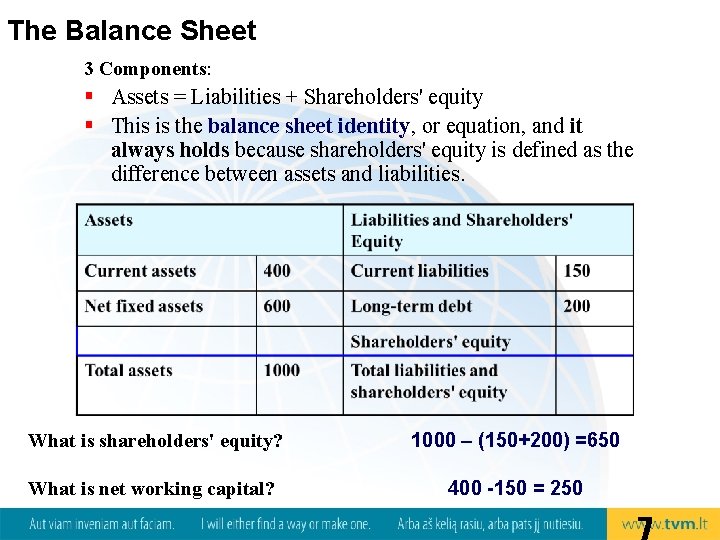
The Balance Sheet 3 Components: § Assets = Liabilities + Shareholders' equity § This is the balance sheet identity, or equation, and it always holds because shareholders' equity is defined as the difference between assets and liabilities. What is shareholders' equity? 1000 – (150+200) =650 What is net working capital? 400 -150 = 250
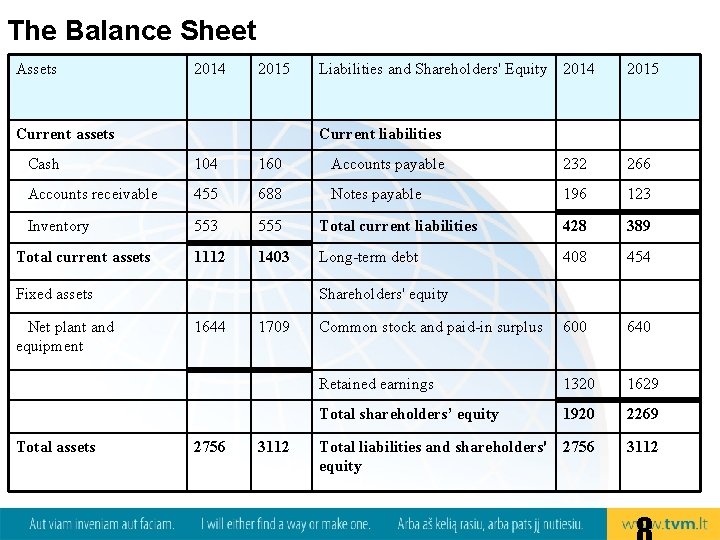
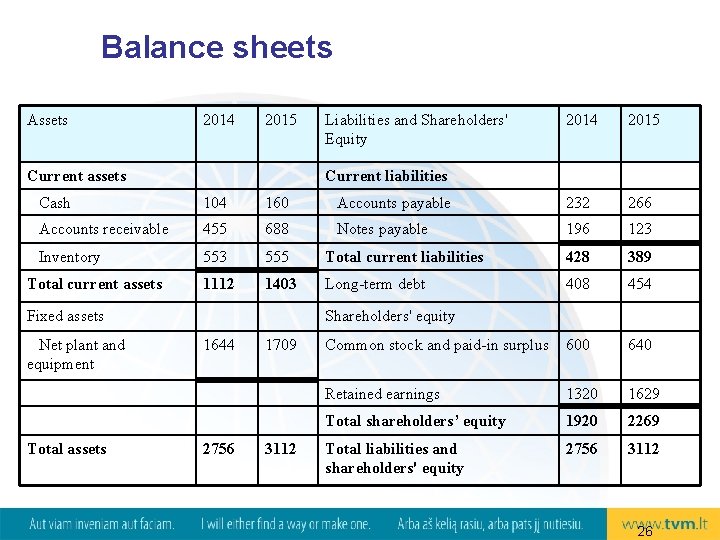
The Balance Sheet Assets 2014 2015 Current assets Liabilities and Shareholders' Equity 2014 2015 Current liabilities Cash 104 160 Accounts payable 232 266 Accounts receivable 455 688 Notes payable 196 123 Inventory 553 555 Total current liabilities 428 389 1112 1403 Long-term debt 408 454 Common stock and paid-in surplus 600 640 Retained earnings 1320 1629 Total shareholders’ equity 1920 2269 Total liabilities and shareholders' 2756 equity 3112 Total current assets Fixed assets Net plant and equipment Total assets Shareholders' equity 1644 2756 1709 3112
The Balance Sheet Key concepts – Liquidity – Net Working Capital – Debt versus Equity, financial leverage – Market Value versus Book Value
Liquidity refers to (is an indicator of) the speed and cost (loss of value and conversion cost) with which an asset can be converted to cash. Ability to convert to cash quickly without a significant cost Assets appear on the balance sheet in descending order of liquidity. Interest and principal payments on debt have to be paid before cash may be paid to stockholders. Liquid firms are less likely to experience financial distress The more liquid assets provide lower returns. Trade-off to find balance between liquid and illiquid assets
Net Working Capital • Net Working Capital =Current Assets – Current Liabilities • Positive when the cash that will be received over the next 12 months exceeds the cash that will be paid out • Usually positive in a healthy firm
Debt versus Equity, financial leverage The use of debt in a firm's capital structure is called financial leverage. • The more debt a firm has (as a percentage of assets), the greater is its degree of financial leverage. • Debt acts like a lever in the sense that using it can greatly magnify both gains and losses. • Advantage: financial leverage increases the potential reward to shareholders • Disadvantage: it also increases the potential for financial distress and business failure. 12
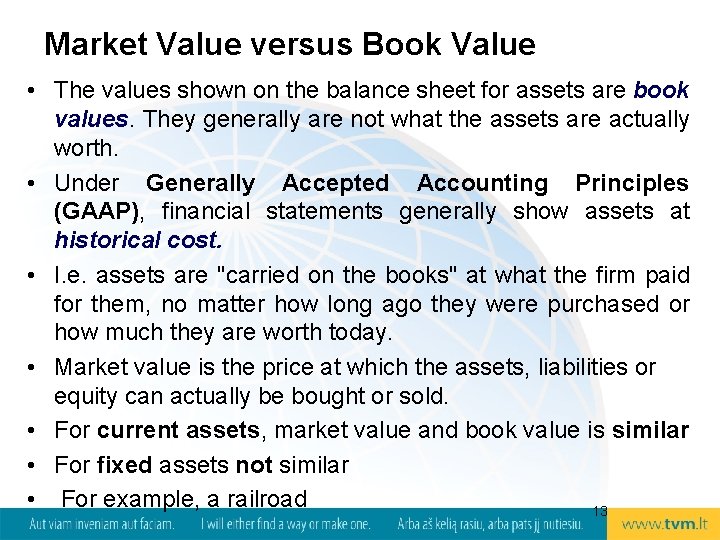
Market Value versus Book Value • The values shown on the balance sheet for assets are book values. They generally are not what the assets are actually worth. • Under Generally Accepted Accounting Principles (GAAP), financial statements generally show assets at historical cost. • I. e. assets are "carried on the books" at what the firm paid for them, no matter how long ago they were purchased or how much they are worth today. • Market value is the price at which the assets, liabilities or equity can actually be bought or sold. • For current assets, market value and book value is similar • For fixed assets not similar • For example, a railroad 13
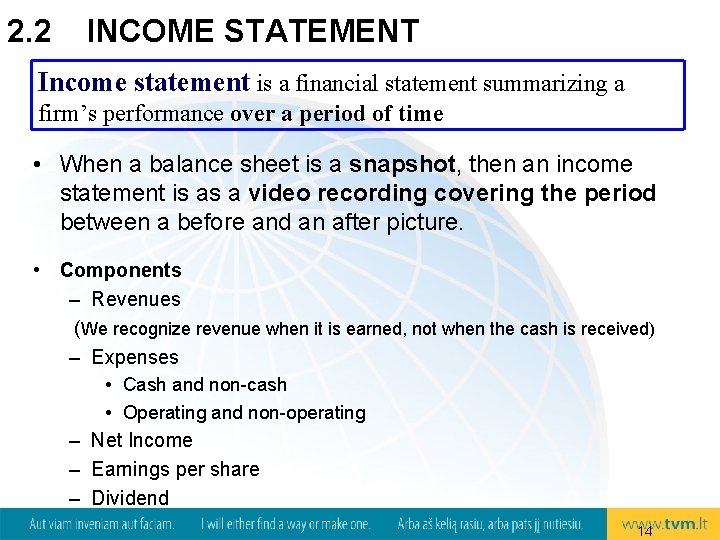
2. 2 INCOME STATEMENT Income statement is a financial statement summarizing a firm’s performance over a period of time • When a balance sheet is a snapshot, then an income statement is as a video recording covering the period between a before and an after picture. • Components – Revenues (We recognize revenue when it is earned, not when the cash is received) – Expenses • Cash and non-cash • Operating and non-operating – Net Income – Earnings per share – Dividend 14
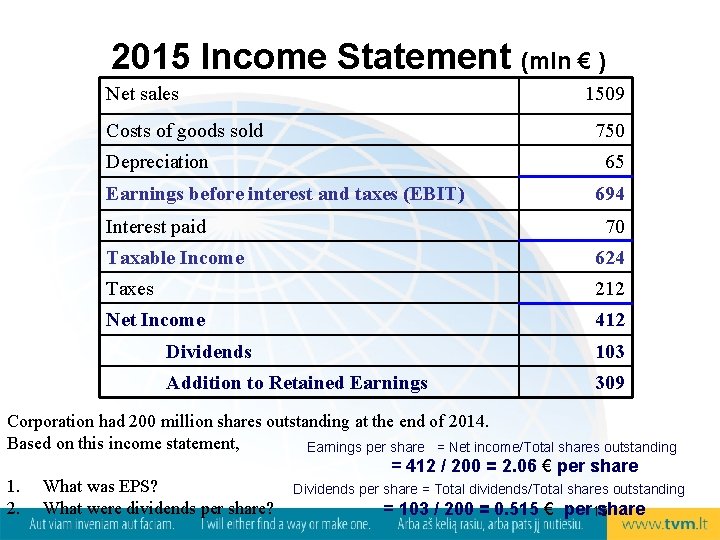
2015 Income Statement (mln € ) Net sales Costs of goods sold Depreciation Earnings before interest and taxes (EBIT) Interest paid 1509 750 65 694 70 Taxable Income 624 Taxes 212 Net Income 412 Dividends 103 Addition to Retained Earnings 309 Corporation had 200 million shares outstanding at the end of 2014. Based on this income statement, Earnings per share = Net income/Total shares outstanding = 412 / 200 = 2. 06 € per share 1. What was EPS? Dividends per share = Total dividends/Total shares outstanding 2. What were dividends per share? = 103 / 200 = 0. 515 € per 15 share
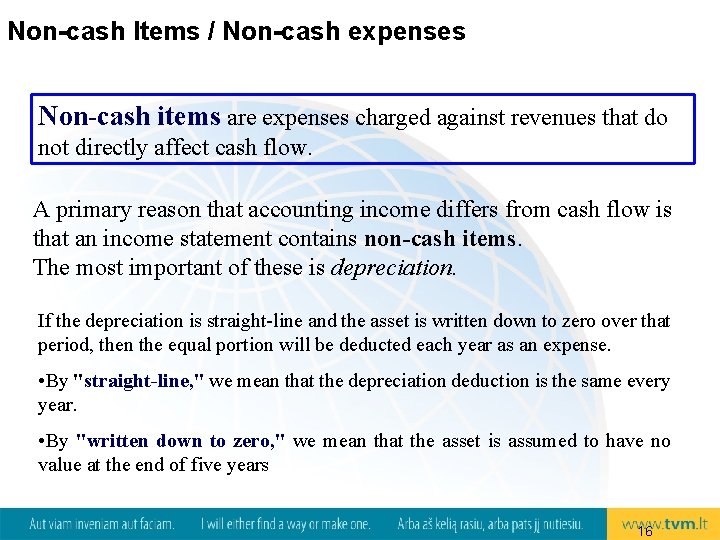
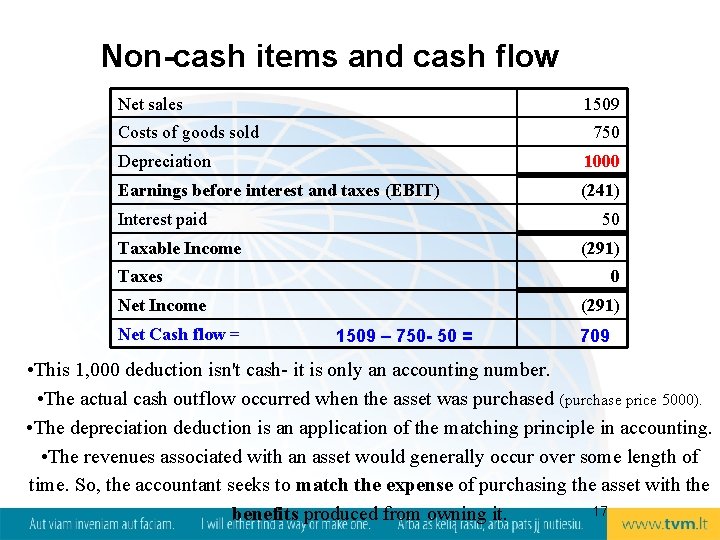
Non-cash Items / Non-cash expenses Non-cash items are expenses charged against revenues that do not directly affect cash flow. A primary reason that accounting income differs from cash flow is that an income statement contains non-cash items. The most important of these is depreciation. If the depreciation is straight-line and the asset is written down to zero over that period, then the equal portion will be deducted each year as an expense. • By "straight-line, " we mean that the depreciation deduction is the same every year. • By "written down to zero, " we mean that the asset is assumed to have no value at the end of five years 16
Non-cash items and cash flow Net sales 1509 Costs of goods sold 750 Depreciation 1000 Earnings before interest and taxes (EBIT) (241) Interest paid 50 Taxable Income (291) Taxes 0 Net Income Net Cash flow = (291) 1509 – 750 - 50 = 709 • This 1, 000 deduction isn't cash- it is only an accounting number. • The actual cash outflow occurred when the asset was purchased (purchase price 5000). • The depreciation deduction is an application of the matching principle in accounting. • The revenues associated with an asset would generally occur over some length of time. So, the accountant seeks to match the expense of purchasing the asset with the 17 benefits produced from owning it.
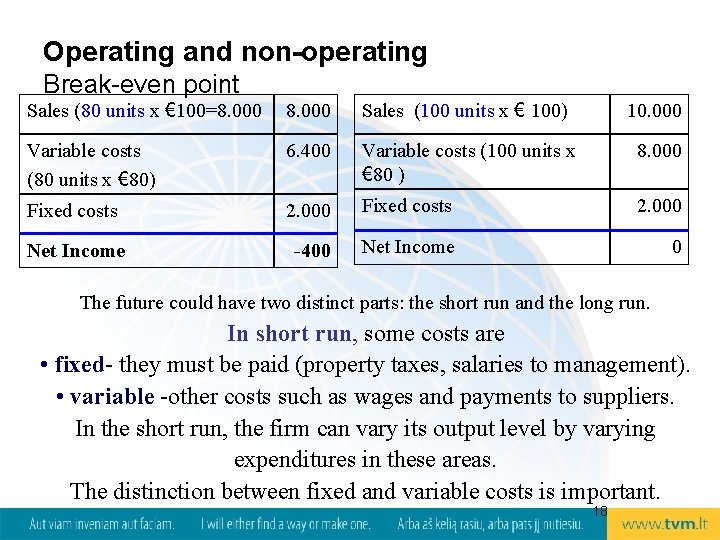
Operating and non-operating Break-even point Sales (80 units x € 100=8. 000 Sales (100 units x € 100) 10. 000 Variable costs (80 units x € 80) 6. 400 Variable costs (100 units x € 80 ) 8. 000 Fixed costs 2. 000 Net Income -400 Net Income 0 The future could have two distinct parts: the short run and the long run. In short run, some costs are • fixed- they must be paid (property taxes, salaries to management). • variable -other costs such as wages and payments to suppliers. In the short run, the firm can vary its output level by varying expenditures in these areas. The distinction between fixed and variable costs is important. 18
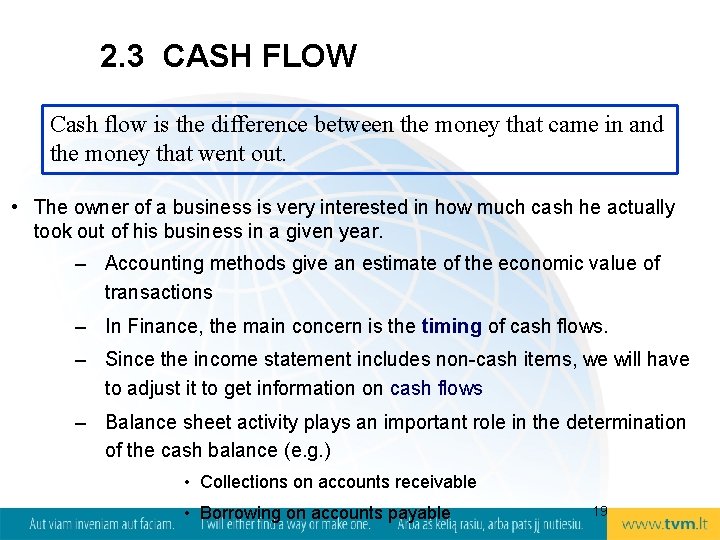
2. 3 CASH FLOW Cash flow is the difference between the money that came in and the money that went out. • The owner of a business is very interested in how much cash he actually took out of his business in a given year. – Accounting methods give an estimate of the economic value of transactions – In Finance, the main concern is the timing of cash flows. – Since the income statement includes non-cash items, we will have to adjust it to get information on cash flows – Balance sheet activity plays an important role in the determination of the cash balance (e. g. ) • Collections on accounts receivable • Borrowing on accounts payable 19
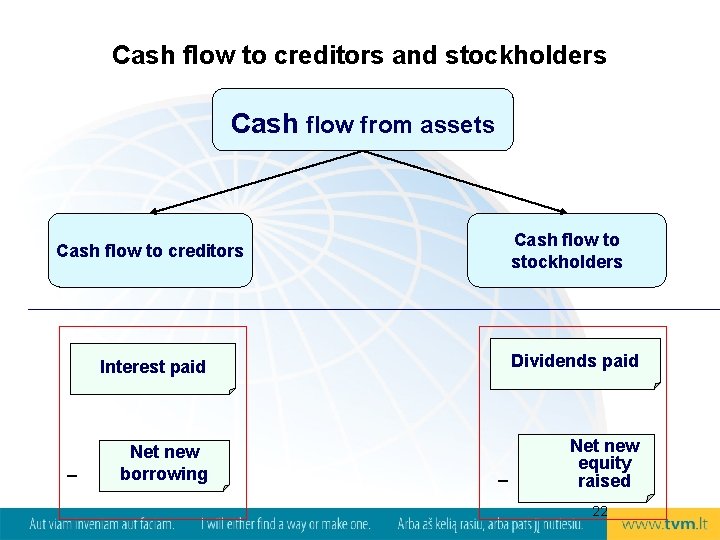
The cash flow identity Cash flow from assets = Cash flow to creditors + (bondholders) Cash flow to stockholders (owners) This is based upon the balance sheet identity: Assets = Liabilities + Equity The cash flow from the firm's assets is equal to the cash flow paid to suppliers of capital to the firm, i. e. either to pay creditors or pay out to the owners of the firm 20
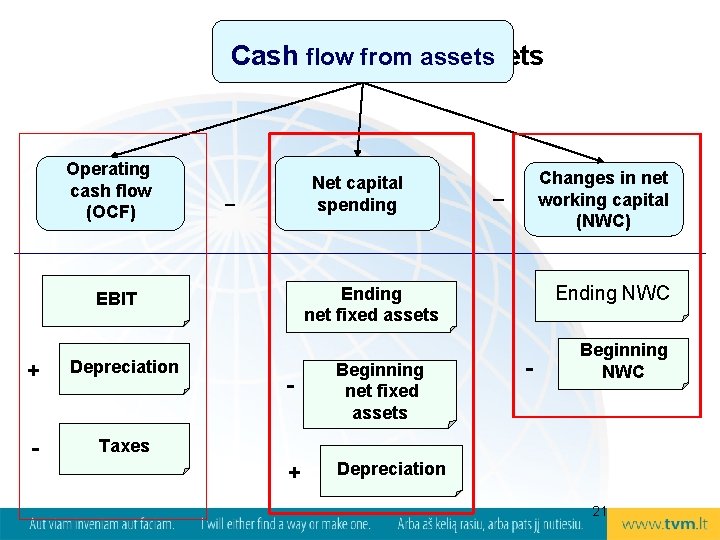
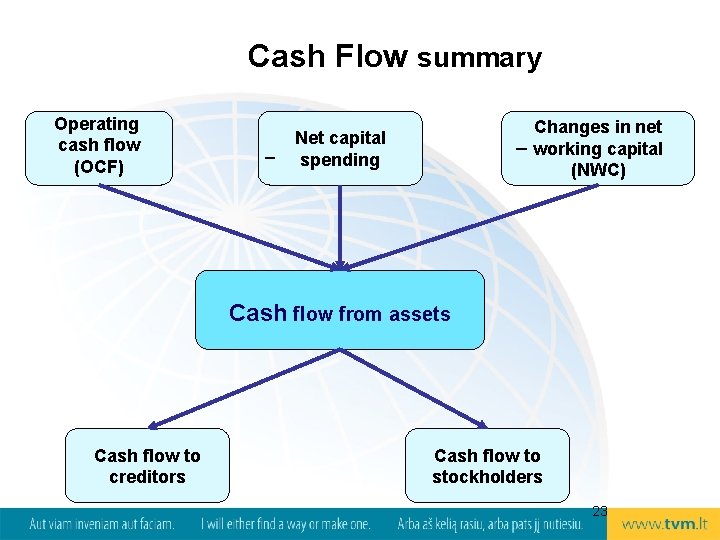
Cashflow from assets Cash from assets Operating cash flow (OCF) Net capital spending _ Depreciation - Taxes Ending NWC Ending net fixed assets EBIT + Changes in net working capital (NWC) _ - Beginning net fixed assets + Depreciation - Beginning NWC 21
Cash flow to creditors and stockholders Cash flow from assets Cash flow to stockholders Cash flow to creditors _ Interest paid Dividends paid Net new borrowing Net new equity raised _ 22
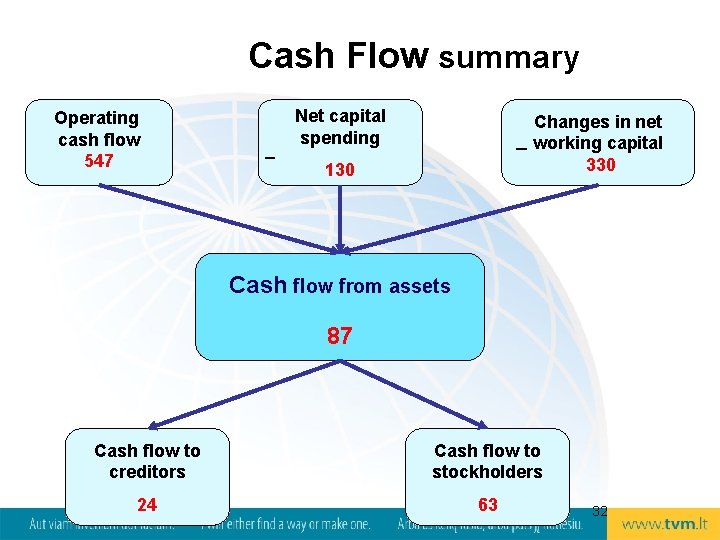
Cash Flow summary Operating cash flow (OCF) _ Changes in net _ working capital Net capital spending (NWC) Cash flow from assets Cash flow to creditors Cash flow to stockholders 23
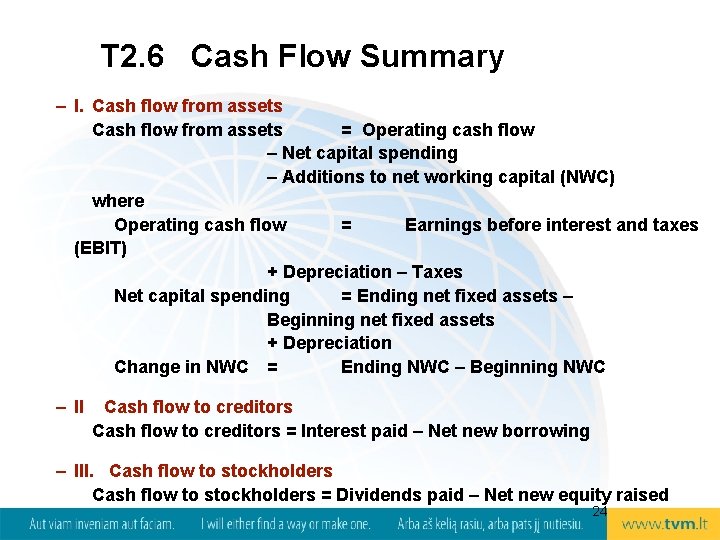
T 2. 6 Cash Flow Summary – I. Cash flow from assets = Operating cash flow – Net capital spending – Additions to net working capital (NWC) where Operating cash flow = Earnings before interest and taxes (EBIT) + Depreciation – Taxes Net capital spending = Ending net fixed assets – Beginning net fixed assets + Depreciation Change in NWC = Ending NWC – Beginning NWC – II Cash flow to creditors = Interest paid – Net new borrowing – III. Cash flow to stockholders = Dividends paid – Net new equity raised 24
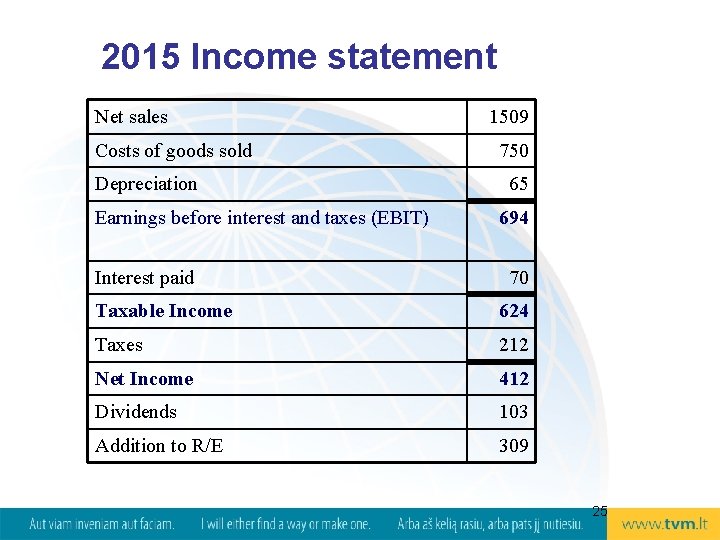
2015 Income statement Net sales Costs of goods sold Depreciation Earnings before interest and taxes (EBIT) Interest paid 1509 750 65 694 70 Taxable Income 624 Taxes 212 Net Income 412 Dividends 103 Addition to R/E 309 25
Balance sheets Assets 2014 2015 Current assets Liabilities and Shareholders' Equity 2014 2015 Current liabilities Cash 104 160 Accounts payable 232 266 Accounts receivable 455 688 Notes payable 196 123 Inventory 553 555 Total current liabilities 428 389 1112 1403 Long-term debt 408 454 Common stock and paid-in surplus 600 640 Retained earnings 1320 1629 Total shareholders’ equity 1920 2269 Total liabilities and shareholders' equity 2756 3112 Total current assets Fixed assets Net plant and equipment Total assets Shareholders' equity 1644 2756 1709 3112 26
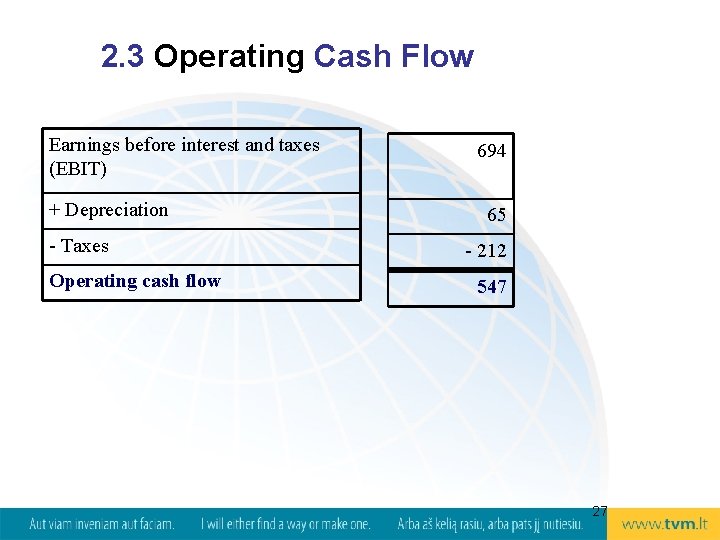
2. 3 Operating Cash Flow Earnings before interest and taxes (EBIT) + Depreciation - Taxes Operating cash flow 694 65 - 212 547 27
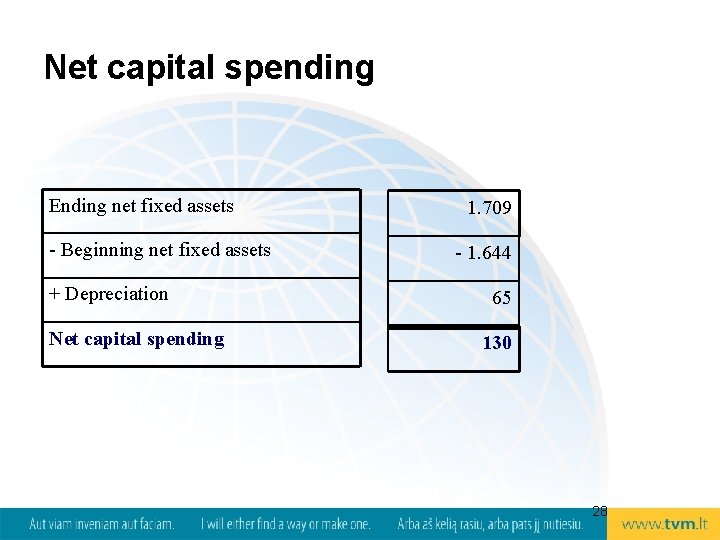
Net capital spending Ending net fixed assets - Beginning net fixed assets + Depreciation Net capital spending 1. 709 - 1. 644 65 130 28
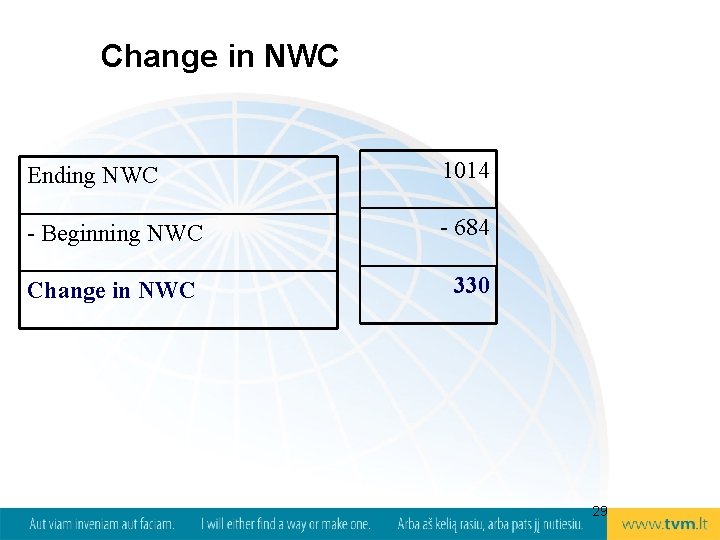
Change in NWC Ending NWC 1014 - Beginning NWC - 684 Change in NWC 330 29
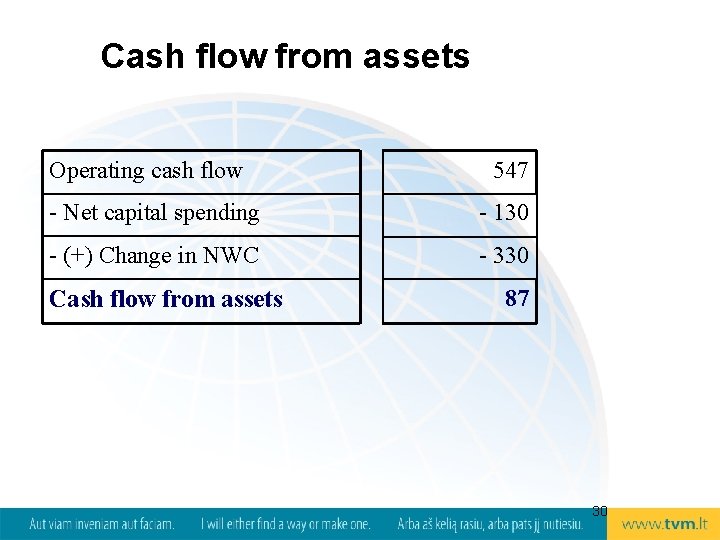
Cash flow from assets Operating cash flow 547 - Net capital spending - 130 - (+) Change in NWC - 330 Cash flow from assets 87 30
Cash Flow to creditors Interest paid – Net new borrowing Cash flow to creditors 70 - 46 24 Cash flow to stockholders Dividends paid 103 – Net new equity raised - 40 Cash flow to stockholders 63 31
Cash Flow summary Operating cash flow 547 _ Net capital spending Changes in net _ working capital 330 130 Cash flow from assets 87 Cash flow to creditors Cash flow to stockholders 24 63 32
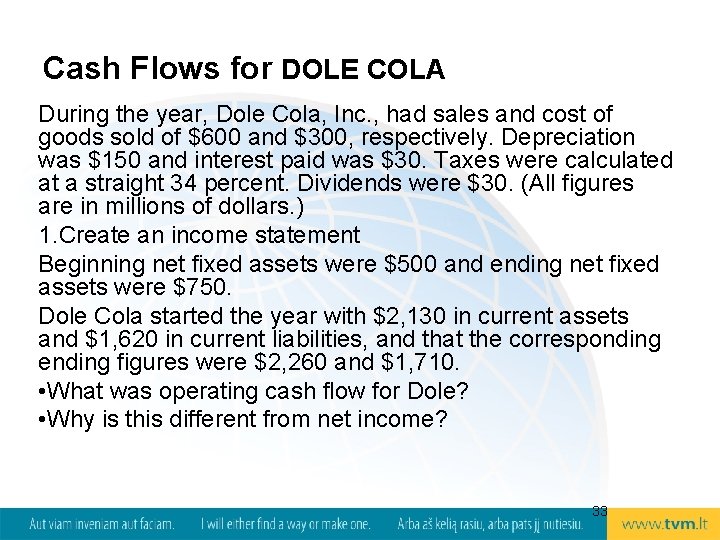
Cash Flows for DOLE COLA During the year, Dole Cola, Inc. , had sales and cost of goods sold of $600 and $300, respectively. Depreciation was $150 and interest paid was $30. Taxes were calculated at a straight 34 percent. Dividends were $30. (All figures are in millions of dollars. ) 1. Create an income statement Beginning net fixed assets were $500 and ending net fixed assets were $750. Dole Cola started the year with $2, 130 in current assets and $1, 620 in current liabilities, and that the corresponding ending figures were $2, 260 and $1, 710. • What was operating cash flow for Dole? • Why is this different from net income? 33
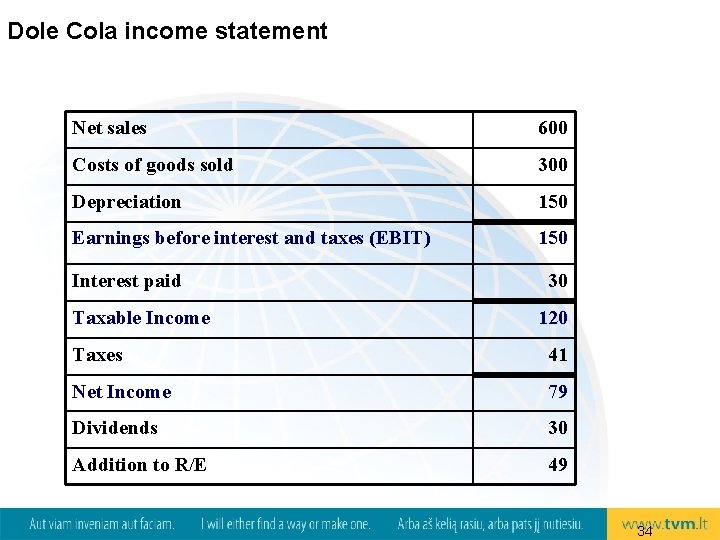
Dole Cola income statement Net sales 600 Costs of goods sold 300 Depreciation 150 Earnings before interest and taxes (EBIT) 150 Interest paid Taxable Income 30 120 Taxes 41 Net Income 79 Dividends 30 Addition to R/E 49 34
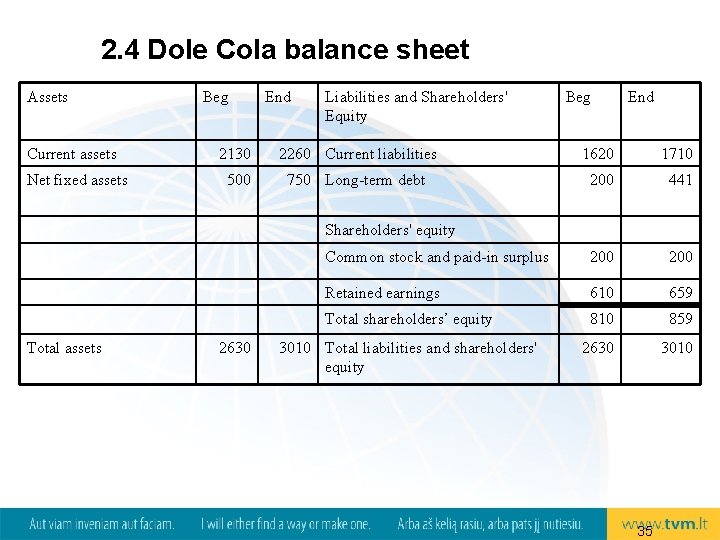
2. 4 Dole Cola balance sheet Assets Current assets Net fixed assets Beg End Liabilities and Shareholders' Equity Beg End 2130 2260 Current liabilities 1620 1710 500 750 Long-term debt 200 441 Common stock and paid-in surplus 200 Retained earnings 610 659 Total shareholders’ equity 810 859 3010 Total liabilities and shareholders' equity 2630 3010 Shareholders' equity Total assets 2630 35
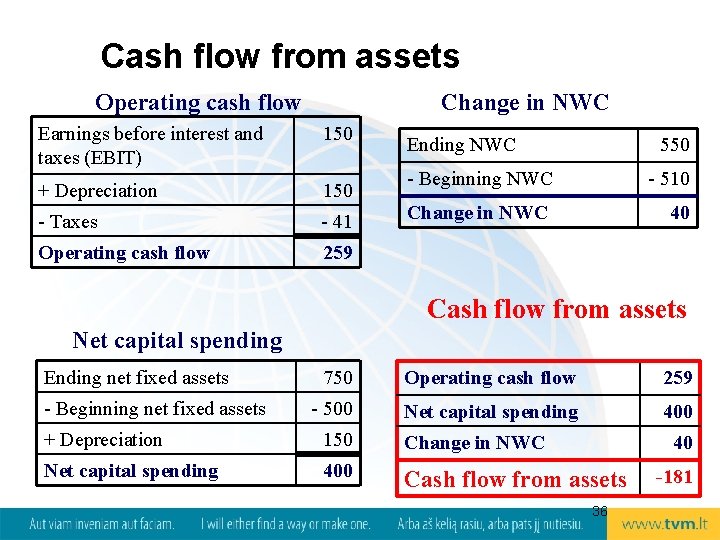
Cash flow from assets Operating cash flow Change in NWC Earnings before interest and taxes (EBIT) 150 + Depreciation 150 - Taxes - 41 Operating cash flow 259 Ending NWC 550 - Beginning NWC - 510 Change in NWC 40 Cash flow from assets Net capital spending Ending net fixed assets - Beginning net fixed assets 750 Operating cash flow 259 - 500 Net capital spending 400 + Depreciation 150 Change in NWC Net capital spending 400 Cash flow from assets 40 36 -181
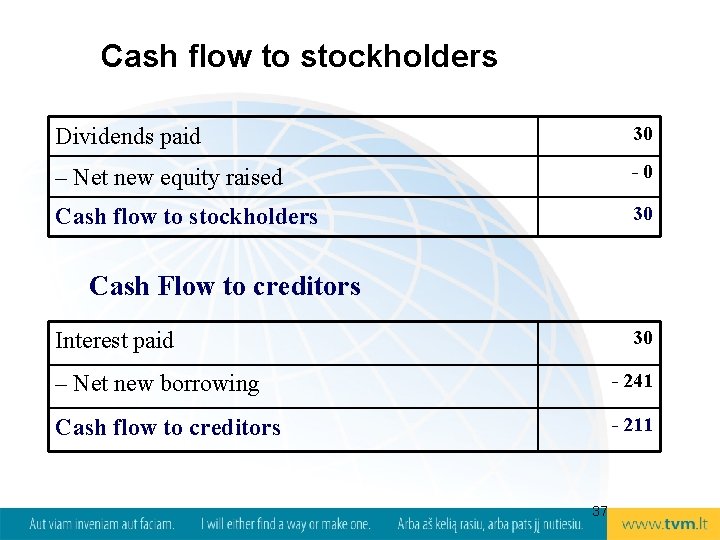
Cash flow to stockholders Dividends paid 30 – Net new equity raised -0 Cash flow to stockholders 30 Cash Flow to creditors 30 Interest paid – Net new borrowing - 241 Cash flow to creditors - 211 37
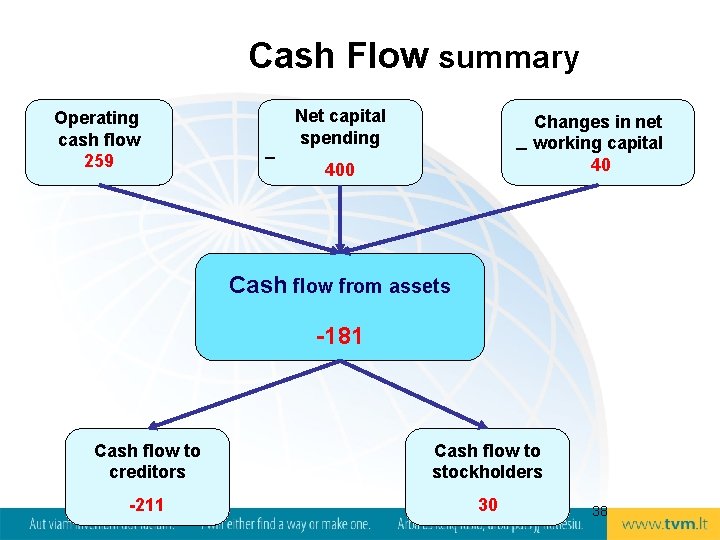
Cash Flow summary Operating cash flow 259 _ Net capital spending Changes in net _ working capital 40 400 Cash flow from assets -181 Cash flow to creditors Cash flow to stockholders -211 30 38
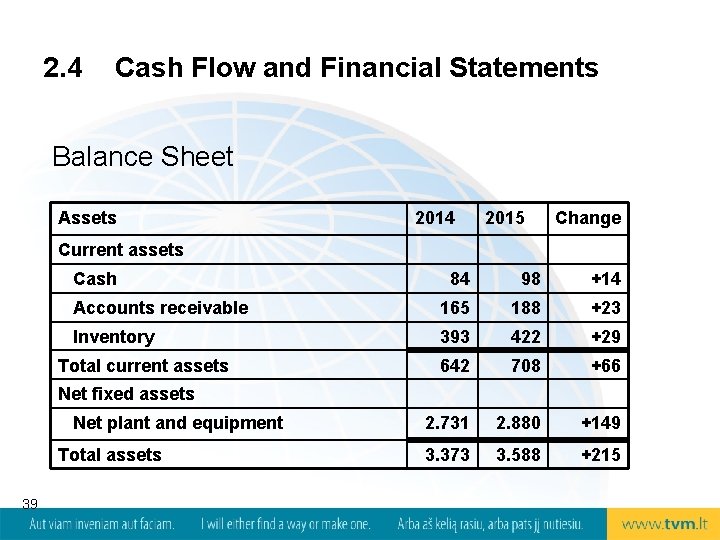
2. 4 Cash Flow and Financial Statements Balance Sheet Assets 2014 2015 Change Current assets Cash 84 98 +14 Accounts receivable 165 188 +23 Inventory 393 422 +29 642 708 +66 2. 731 2. 880 +149 3. 373 3. 588 +215 Total current assets Net fixed assets Net plant and equipment Total assets 39
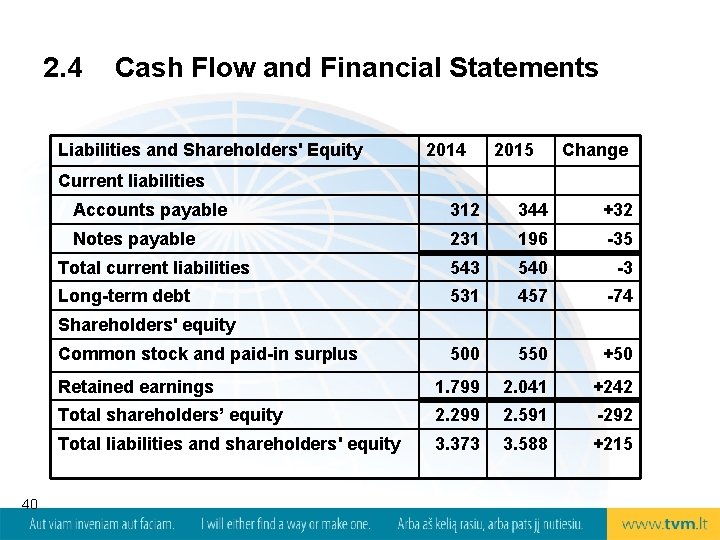
2. 4 Cash Flow and Financial Statements Liabilities and Shareholders' Equity 2014 2015 Change Current liabilities Accounts payable 312 344 +32 Notes payable 231 196 -35 Total current liabilities 543 540 -3 Long-term debt 531 457 -74 500 550 +50 Retained earnings 1. 799 2. 041 +242 Total shareholders’ equity 2. 299 2. 591 -292 Total liabilities and shareholders' equity 3. 373 3. 588 +215 Shareholders' equity Common stock and paid-in surplus 40
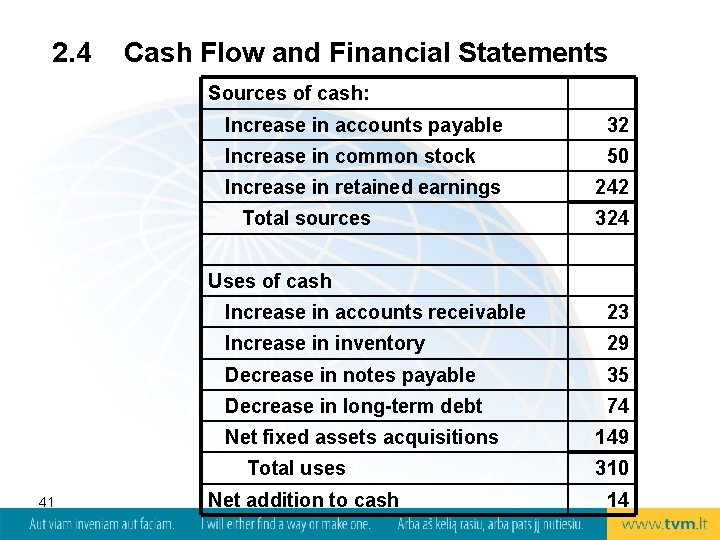
2. 4 Cash Flow and Financial Statements Sources of cash: Increase in accounts payable 32 Increase in common stock 50 Increase in retained earnings Total sources 242 324 Uses of cash Increase in accounts receivable 23 Increase in inventory 29 Decrease in notes payable 35 Decrease in long-term debt 74 Net fixed assets acquisitions Total uses 41 Net addition to cash 149 310 14
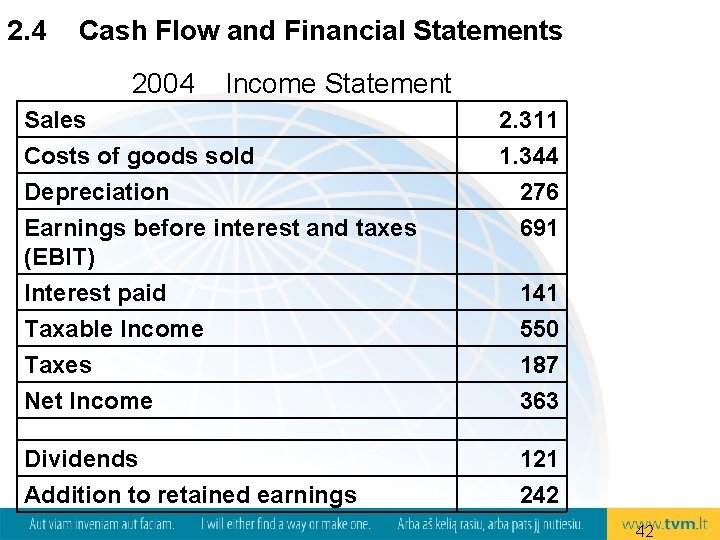
2. 4 Cash Flow and Financial Statements 2004 Income Statement Sales Costs of goods sold 2. 311 1. 344 Depreciation Earnings before interest and taxes (EBIT) Interest paid Taxable Income Taxes Net Income 276 691 Dividends Addition to retained earnings 121 242 141 550 187 363 42
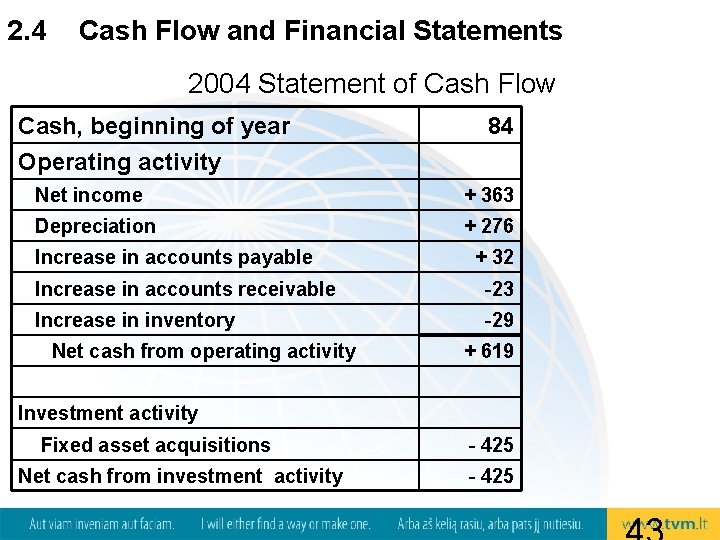
2. 4 Cash Flow and Financial Statements 2004 Statement of Cash Flow Cash, beginning of year Operating activity 84 Net income + 363 Depreciation + 276 Increase in accounts payable + 32 Increase in accounts receivable -23 Increase in inventory -29 Net cash from operating activity + 619 Investment activity Fixed asset acquisitions Net cash from investment activity - 425
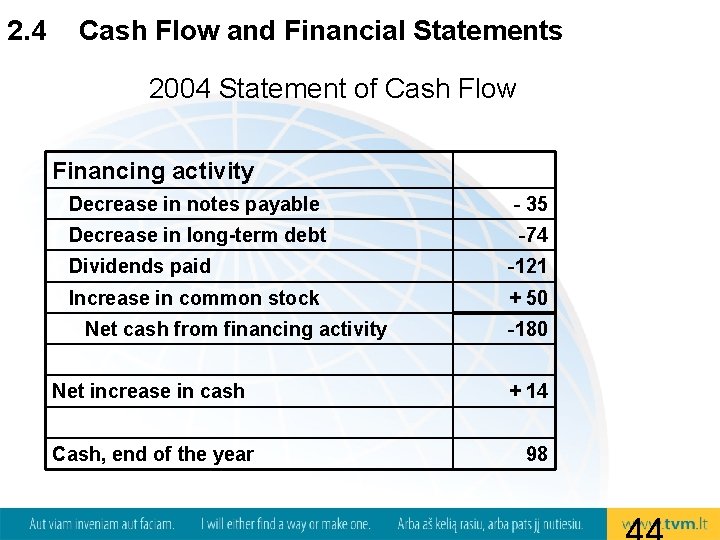
2. 4 Cash Flow and Financial Statements 2004 Statement of Cash Flow Financing activity Decrease in notes payable - 35 Decrease in long-term debt -74 Dividends paid -121 Increase in common stock + 50 Net cash from financing activity Net increase in cash Cash, end of the year -180 + 14 98
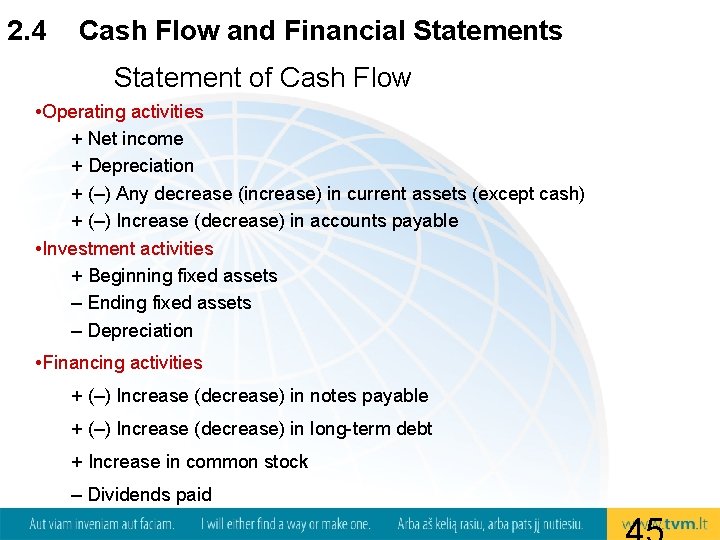
2. 4 Cash Flow and Financial Statements Statement of Cash Flow • Operating activities + Net income + Depreciation + (–) Any decrease (increase) in current assets (except cash) + (–) Increase (decrease) in accounts payable • Investment activities + Beginning fixed assets – Ending fixed assets – Depreciation • Financing activities + (–) Increase (decrease) in notes payable + (–) Increase (decrease) in long-term debt + Increase in common stock – Dividends paid