FINANCIAL STATEMENTS TAXES AND CASH FLOW Chapter 2


 NWC=CA-CL The difference between a firm’s current assets and its")


 Cash generated from a firm’s normal business activities. HOW TO")

")

 money received from the sale")
 a firm will also invest in current")


 net new")


- Slides: 56
FINANCIAL STATEMENTS, TAXES, AND CASH FLOW Chapter 2 Reem Alnuaim
The Balance Sheet Financial statement showing a firm’s accounting value on a particular date. Is a snapshot of the firm. It is a convenient means of organizing and summarizing what a firm owns (its assets), what a firm owes (its liabilities), and the difference between the two (the firm’s equity) at a given point in time.
The Balance Sheet As shown, the left side lists the assets of the firm, and the right side lists the liabilities and equity.
ASSETS: THE LEFT SIDE Assets are classified as either current or fixed. A fixed asset : is one that has a relatively long life. Fixed assets can be either tangible, such as a truck or a computer, or intangible, such as a trademark or patent. A current asset has a life of less than one year. This means that the asset will convert to cash within 12 months. Ex: inventory would normally be purchased and sold within a year and is thus classified as a current asset. Obviously, cash itself is a current asset. Accounts receivable (money owed to the firm by its customers) are also current assets.
LIABILITIES AND OWNERS’ EQUITY: THE RIGHT SIDE 1. The firm’s liabilities: are the first thing listed on the right side of the balance sheet. These are classified as either current or long-term. Current liabilities, like current assets, have a life of less than one year (meaning they must be paid within the year) and are listed before long-term liabilities. Accounts payable (money the firm owes to its suppliers) are one example of a current liability. A debt that is not due in the coming year is classified as a long-term liability. A loan that the firm will pay off in five years is one such long -term debt. Firms borrow in the long term from a variety of sources. We will tend to use the terms bond and bondholders generically to refer to long-term debt and long-term creditors, respectively.
LIABILITIES AND OWNERS’ EQUITY: THE RIGHT SIDE The firm’s liabilities are the first thing listed on the right side of the balance sheet. These are classified as either current or long-term. Current liabilities Current assets : have a life of less than one year (meaning they must be paid within the year) and are listed before longterm liabilities. Ex : Accounts payable (money the firm owes to its suppliers) are one example of a current liability. Long-term liability : A debt that is not due in the coming year A loan that the firm will pay off in five years is one such longterm debt. Firms borrow in the long term from a variety of sources. We will tend to use the terms bond and bondholders generically to refer to long-term debt and long-term creditors, respectively.
OWNERS’ EQUITY The shareholders’ equity, also called common equity or owners’ equity : is the difference between the total value of the assets (current and fixed) and the total value of the liabilities (current and long-term) If the firm were to sell all its assets and use the money to pay off its debts, then whatever residual value remained would belong to the shareholders. The balance sheet “balances” because the value of the left side always equals the value of the right side.
The Balance Sheet Identity Assets = Liabilities + Shareholders This is the balance sheet identity, or equation, and it always holds because shareholders’ equity is defined as the difference between assets and liabilities. That is, the value of the firm’s assets is equal to the sum of its liabilities and shareholders’ equity
NET WORKING CAPITAL (NWC) NWC=CA-CL The difference between a firm’s current assets and its current liabilities is called net working capital. NWC is positive when current assets exceed current liabilities. Based on the definitions of current assets and current liabilities, this means the cash that will become available over the next 12 months exceeds the cash that must be paid over the same period. For this reason, net working capital is usually positive in a healthy firm. CA>CL in a healthy
Building the Balance Sheet A firm has current assets OF $100 Net fixed assets of $500 Short-term debt of $70 Long-term debt of $200. What does the balance sheet look like? What is shareholders’ equity? What is net working capital? Total assets = $100 + 500 =$600 Total liabilities = $70 + 200 =$270 Shareholders’ equity = $600 – 270 =$330
Building the Balance Sheet The balance sheet would look like this: Net working capital is the difference between current assets and current liabilities NWC=CA-CL= $100 – 70 = $30.
Balance sheets The assets on the balance sheet are listed in order of the length of time it takes for them to convert to cash in the normal course of business. Similarly, the liabilities are listed in the order in which they would normally be paid. The structure of the assets for a particular firm reflects the line of business the firm is in and also managerial decisions about how much cash and inventory to have and about credit policy, fixed asset acquisition, and so on. The liabilities side of the balance sheet primarily reflects managerial decisions about capital structure and the use of short-term debt.
Balance sheets There are three particularly important things to keep in mind when examining a balance sheet: Liquidity Debt versus equity Market value versus book value.
Liquidity Liquidity refers to the speed and ease with which an asset can be converted to cash. Gold is a relatively liquid asset; a custom manufacturing facility is not. Liquidity actually has two dimensions: ease of conversion versus loss of value. A highly liquid asset is therefore one that can be quickly sold without significant loss of value. An illiquid asset is one that cannot be quickly converted to cash without a substantial price reduction.
Liquidity Assets are normally listed on the balance sheet in order of decreasing liquidity, meaning that the most liquid assets are listed first. Current assets: are relatively liquid and include cash and assets we expect to convert to cash over the next 12 months. Fixed assets: are, for the most part, relatively illiquid. These consist of tangible assets such as buildings and equipment that don’t convert to cash at all in normal business activity (they are, of course, used in the business to generate cash). Intangible assets, such as a trademark, have no physical existence but can be very valuable. Like tangible fixed assets, they won’t ordinarily convert to cash and are generally considered illiquid.
Liquidity is valuable. The more liquid a business is, the less likely it is to experience financial distress. Unfortunately, liquid assets are generally less profitable to hold. Ex : Cash holdings are the most liquid of all investments, but they sometimes earn no return at all they just sit there.
Debt versus equity To the extent that a firm borrows money, it usually gives first claim to the firm’s cash flow to creditors. (Pay to the creditors/bondholders first) Equity holders are entitled to only the residual value, the portion left after creditors are paid. (Pay the rest to the equity holders /shareholders ) The value of this residual portion is the shareholders’ equity in the firm, which is just the value of the firm’s assets less the value of the firm’s liabilities: Shareholders’ equity = Assets – Liabilities Shareholders’ equity is defined as this residual portion. If the firm sells its assets and pays its debts, whatever cash is left
Debt versus equity The use of debt in a firm’s capital structure is called financial leverage. The more debt a firm has (as a percentage of assets), the greater is its degree of financial leverage. Financial leverage increases the potential reward to shareholders, but it also increases the potential for financial distress and business failure.
Market value versus book value. The values shown on the balance sheet for the firm’s assets are book value and generally are not what the assets are actually worth. Under (GAAP), audited financial statements in the United States generally show assets at historical cost. In other words, assets are “carried on the books” at what the firm paid for them, no matter how long ago they were purchased or how much they are worth today.
Market value versus book value. Current assets: market value and book value might be somewhat similar because current assets are bought and converted into cash over a relatively short span of time. Fixed assets: market value of an asset (what the asset could be sold for) not similar to its book value. Ex : a railroad might own enormous tracts of land purchased a century or more ago. What the railroad paid for that land could be hundreds or thousands of times less than what the land is worth today. The balance sheet would nonetheless show the historical cost.
Market value versus book value. The difference between market value and book value is important for understanding the impact of reported gains and losses. The balance sheet is useful to many different parties: A supplier might look at the size of accounts payable to see how promptly the firm pays its bills. A potential creditor would examine the liquidity and degree of financial leverage. Managers within the firm can track things like the amount of cash and the amount of inventory the firm keeps on hand Managers and investors will frequently be interested in knowing the value of the firm. This information is not on the balance sheet. The fact that balance sheet assets are listed at cost means that there is no necessary connection between the total assets shown and the value of the firm. Indeed, many of the most valuable assets a firm might have a good management, a good reputation, talented employees—don’t appear on the balance sheet at all.
Income Statement The income statement A financial statement summarizing a firm’s performance over a period of time, usually a quarter or a year. The income statement equation is: Revenues - Expenses = Income
Income Statement The first thing reported on an income statement would usually be revenue and expenses from the firm’s principal operations. Subsequent parts include, among other things, financing expenses such as interest paid. Taxes paid are reported separately. The last item is net income (the so-called bottom line).
Retained earnings Net income is often expressed on a per-share basis and called earnings per share (EPS). As indicated, U. S. paid cash dividends of $103. Retained earnings = Net income - Cash dividends The difference between net income and cash dividends, $309, is the addition to retained earnings for the year. This amount is added to the cumulative retained earnings account on the balance sheet
Calculating Earnings and Dividends per Share U. S. had 200 million shares outstanding at the end of 2009. Based on the income statement in Table 2. 2, what was EPS? What were dividends per share? Total shares =200 Net income = $412 Total dividends= $103 Earnings per share (EPS) = Net income / Total shares EPS= $412/200 = $2. 06 per share Dividends per share = Total dividends/Total shares Dividends per share = $103/200 = $. 515 per share
Taxes can be one of the largest cash outflows a firm experiences. Ex : for the fiscal year 2007, Exxon. Mobil’s Taxable income $71. 88 billion. Its tax bill, including all taxes paid worldwide, was a whopping $29. 86 billion, or about 41 percent of its pretax earnings. Wal-Mart had a taxable income of $6. 88 bil- lion, and the company paid $2. 14 billion in taxes, an average tax rate of 31 percent. The size of a company’s tax bill is determined by the tax code, an often amended set of rules.
CORPORATE TAX RATES Corporate tax rates rise from 15 percent to 39 percent, but they drop back to 34 percent on income over $335, 000. They then rise to 38 percent and subsequently fall to 35 percent.
AVERAGE VERSUS MARGINAL TAX RATES In making financial decisions, it is important to distinguish between average and marginal tax rates. Your average tax rate : Total taxes paid divided by total taxable income. T/Taxable income. The percentage of your income that goes to pay taxes. Your marginal tax rate : is the rate of the extra tax you would pay if you earned one more dollar.
Example 1 Suppose our corporation has a taxable income of $200, 000. What is the tax bill? Using Table 2. 3, we can figure our tax bill:
Example 1 Our total tax = $61, 250. What is the average tax rate? Taxable income =$200, 000 Tax bill = $61, 250 The average tax rate= $61, 250/200, 000 = 30. 625%. What is the marginal tax rate? If we made one more dollar, the tax on that dollar would be 39 cents, so our marginal rate is 39 percent.
Example 2 Algernon, Inc. , has a taxable income of $85, 000. What is its tax bill? What is its average tax rate? Its marginal tax rate? Tax bill=. 15 X $50, 000 +. 25 X 25, 000 +. 34 X (85, 000 - 75, 000) = $17, 150. Average tax rate =Tax bill/taxable income = $17, 150/85, 000 = 20. 18%. The marginal rate = 34 % because Algernon’s taxes would rise by 34 cents if it had another dollar in taxable income.
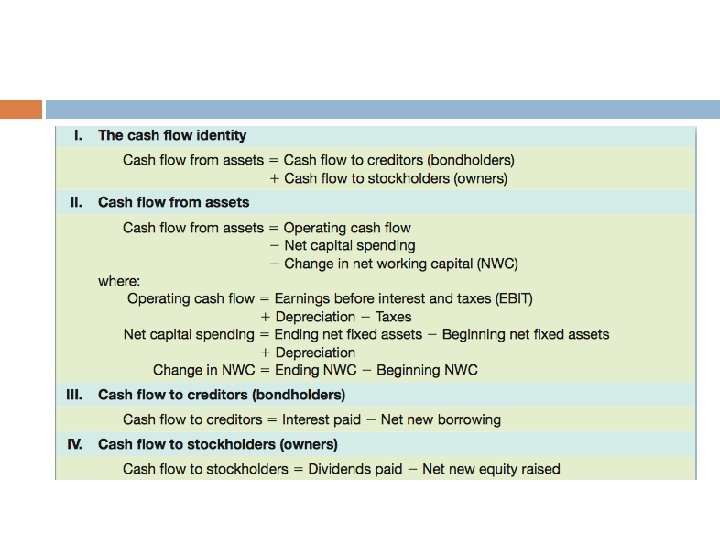
Cash Flow Identity Cash flow from assets = Cash flow to creditors + Cash flow to stockholders A firm generates cash through its various activities , and that cash is either used to pay creditors / Bondholders or paid out to the owners/stockholders of the firm.
Cash Flow Is one of the most important pieces of financial information that can be gleaned from financial statements. Ex : if you have a business, you want to know how much cash you actually took out of your business in a given year.
Cash flow from assets involves three components: 1. 2. 3. Operating cash flow Capital spending Change in net working capital.
1. Operating cash flow(OCF) Cash generated from a firm’s normal business activities. HOW TO CALCULATE (OCF): ( revenues - costs ) including tax , but we don't want to include depreciation and interest. OCF =EBIT +depreciation –Taxes Expenses associated with the firm’s financing of its assets are not included because they are not operating expenses. OCF : tells us whether a firm’s cash inflows from its business operations are sufficient to cover its everyday cash outflows. A negative operating cash flow is often a sign of trouble.
The income Statements
Operating cash flow(OCF)
The Balance Sheet
2. Capital Spending: Money spent on fixed assets less(-) money received from the sale of fixed assets.
3. Change in Net Working Capital (NWC) a firm will also invest in current assets. take the difference between the beginning and ending (NWC) figures.
Cash Flow from Assets
CASH FLOW TO CREDITORS AND STOCKHOLDERS Cash flow to creditors : A firm’s interest payments to creditors less (-) net new borrowings. Cash flow to creditors is sometimes called cash flow to bondholders.
Cash Flow to Creditors
Cash flow to stockholders Dividends paid out by a firm less (-) net new equity raised.
Example of CF From Dole Cola Page 39 -41
Accounting Vs. Finance A different point of view The investments decisions focus on : 1 -Expected return on the project 2 -Cost of capital of the investor Profitable project = Return > Cost of capital Sets minimum expected return. Only investments above that rate will create value and lead to an increase in the company's share price.
Cost OF Capital 1. 2. 3. Is simply the weighted average of its capital components Cost of equity Cost of debt The respective weight
Cost of debt Cost of debt : Indicated in the income statement in form of the interest expense, which reduces a company’s taxable income. Interest payment lower the corporate after tax cost of debt. Tax saving are equal to the difference between EBIT and taxable income times the tax rate. Tax saving = (EBIT - Taxable income )X Tax rate (694 -624)X 0. 34=23. 8
Cost of Equity Can not be found in financial statements. Dividend payments does not constitute cost of equity , because shareholders can not claim a fixed dividend. Accountant’s view the equity is costless. Financial manger sees equity not to be costless but more costly than debt for a variety of reasons : Equity is junior to debt in the event of bankruptcy. The level of cash flow uncertainty during the investment period is higher for equity (dividend size nor timing is known)
Cost of Equity more costly than debt for a variety of reasons : 1. Equity is junior to debt in the event of bankruptcy. 2. The level of cash flow uncertainty during the investment period is higher for equity (dividend size nor timing is known) 3. The price fluctuation of stock prices is more pronounced than that of bonds prices. Cost of Equity > Cost of debt
Timing of Cash Flows Bridging the time difference by making the funds available when needed is costly.
Cash Flow Vs. Net Profit Accountant point of view , company's success measure is the net income. Financial manger more interested in cash flow the size and timing of the cash flow Net income Non cash items Time value of money
Taxes Rates The tax rate applied to the cash flow of any new project will be determined by the level of taxable income.
Characterization of cost Financial manger : classify cost as being either fixed or variable in nature. Fixed cost : level of production (cost of equipment, rent facilities or employers salary). Variable costs : are the additional cost per unite of production process.
Assets Value Financial mangers are focused on cash flow they make investments decisions based on market value.