
Chapter 2 Financial Statements Taxes and Cash Flow

- Slides: 46
Chapter 2 • Financial Statements, Taxes, and Cash Flow Mc. Graw-Hill/Irwin Copyright © 2006 by The Mc. Graw-Hill Companies, Inc. All rights reserved.
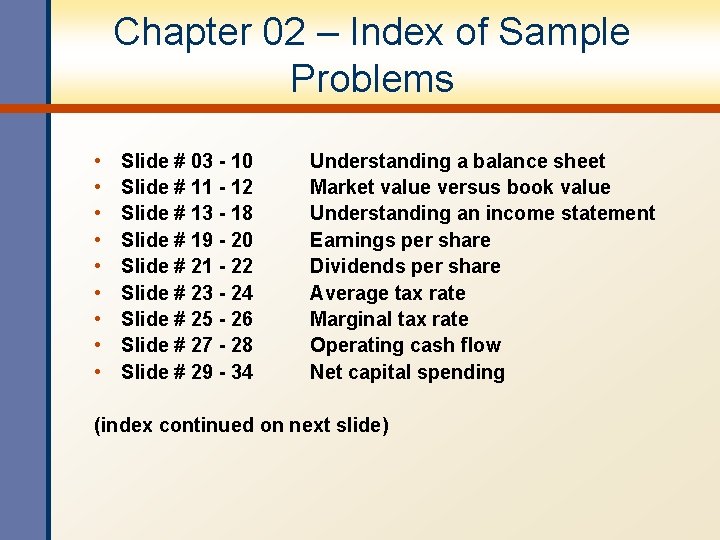
Chapter 02 – Index of Sample Problems • • • Slide # 03 - 10 Slide # 11 - 12 Slide # 13 - 18 Slide # 19 - 20 Slide # 21 - 22 Slide # 23 - 24 Slide # 25 - 26 Slide # 27 - 28 Slide # 29 - 34 Understanding a balance sheet Market value versus book value Understanding an income statement Earnings per share Dividends per share Average tax rate Marginal tax rate Operating cash flow Net capital spending (index continued on next slide)
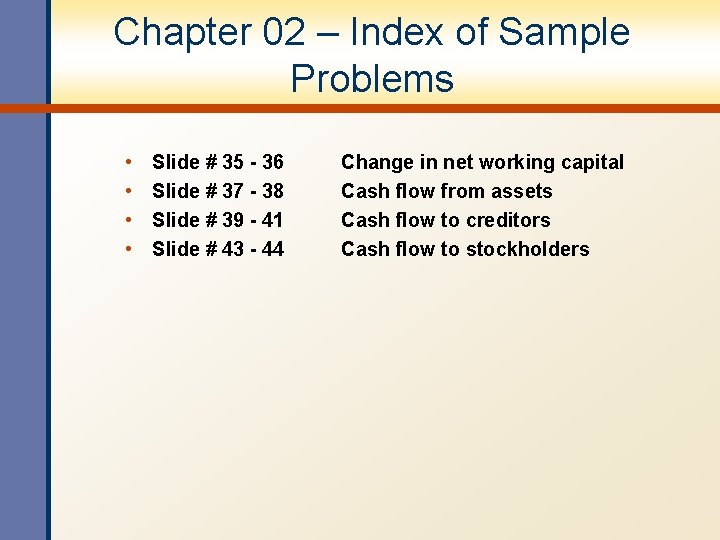
Chapter 02 – Index of Sample Problems • • Slide # 35 - 36 Slide # 37 - 38 Slide # 39 - 41 Slide # 43 - 44 Change in net working capital Cash flow from assets Cash flow to creditors Cash flow to stockholders
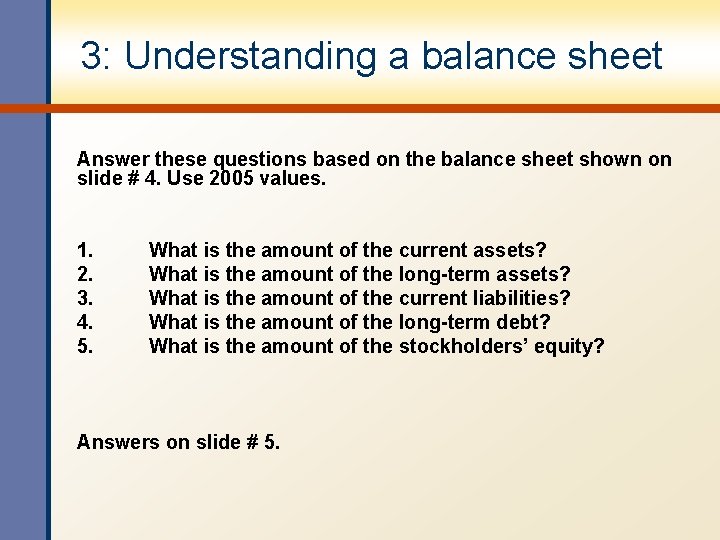
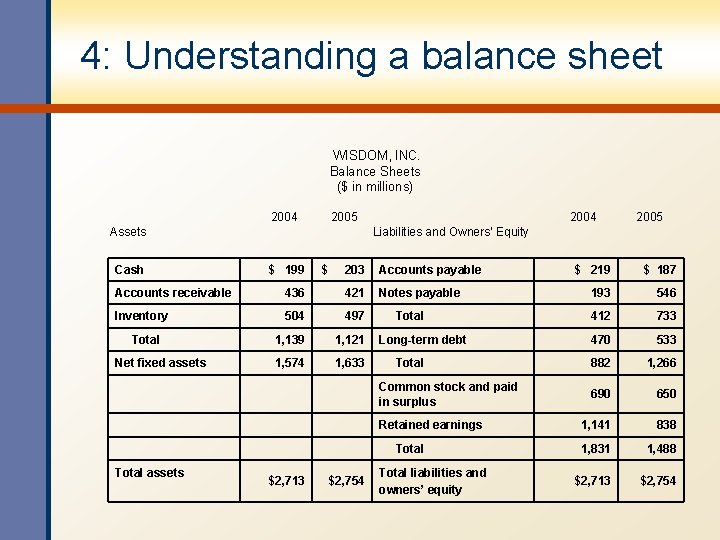
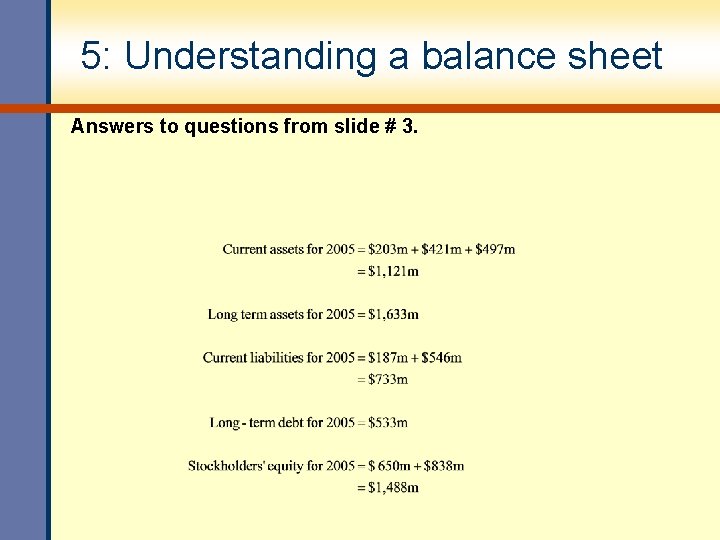
3: Understanding a balance sheet Answer these questions based on the balance sheet shown on slide # 4. Use 2005 values. 1. 2. 3. 4. 5. What is the amount of the current assets? What is the amount of the long-term assets? What is the amount of the current liabilities? What is the amount of the long-term debt? What is the amount of the stockholders’ equity? Answers on slide # 5.
4: Understanding a balance sheet WISDOM, INC. Balance Sheets ($ in millions) 2004 2005 Assets Cash $ 199 $ 203 Accounts payable Notes payable Accounts receivable 436 421 Inventory 504 497 1, 139 1, 121 1, 574 1, 633 Total Net fixed assets 2004 Total Long-term debt Total Common stock and paid in surplus Retained earnings Total assets 2005 Liabilities and Owners’ Equity $2, 713 $2, 754 Total liabilities and owners’ equity $ 219 $ 187 193 546 412 733 470 533 882 1, 266 690 650 1, 141 838 1, 831 1, 488 $2, 713 $2, 754
5: Understanding a balance sheet Answers to questions from slide # 3.
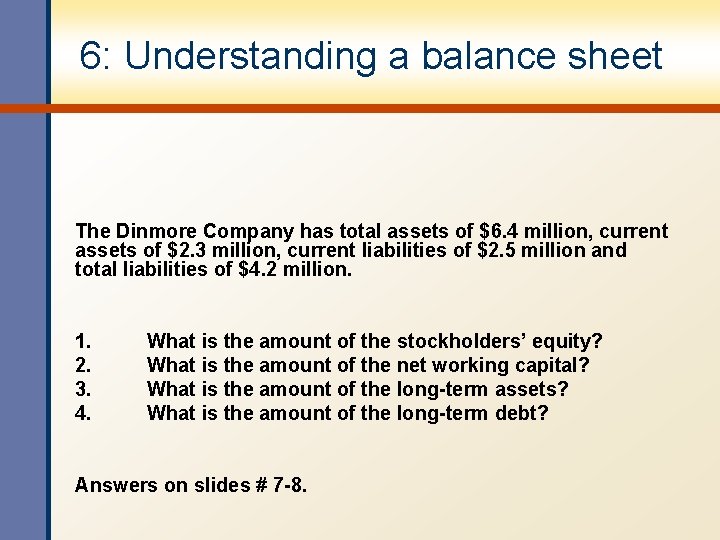
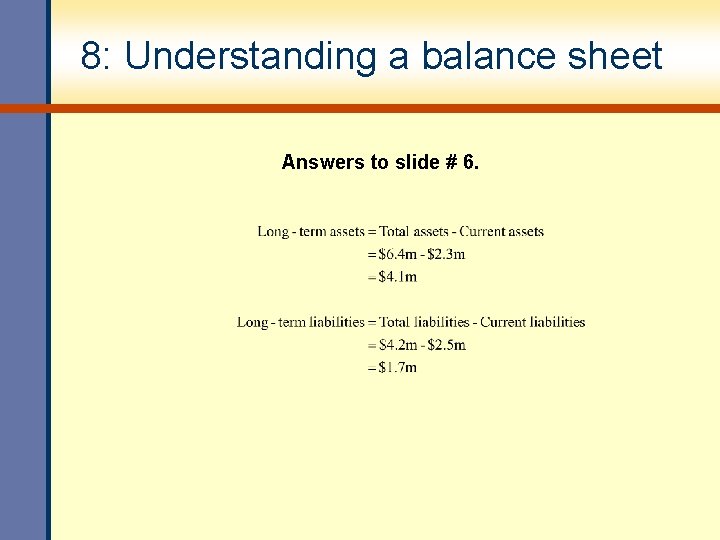
6: Understanding a balance sheet The Dinmore Company has total assets of $6. 4 million, current assets of $2. 3 million, current liabilities of $2. 5 million and total liabilities of $4. 2 million. 1. 2. 3. 4. What is the amount of the stockholders’ equity? What is the amount of the net working capital? What is the amount of the long-term assets? What is the amount of the long-term debt? Answers on slides # 7 -8.
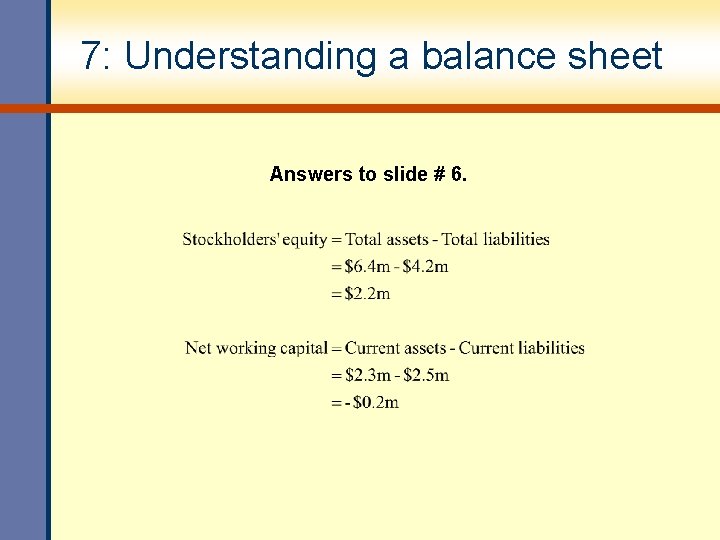
7: Understanding a balance sheet Answers to slide # 6.
8: Understanding a balance sheet Answers to slide # 6.
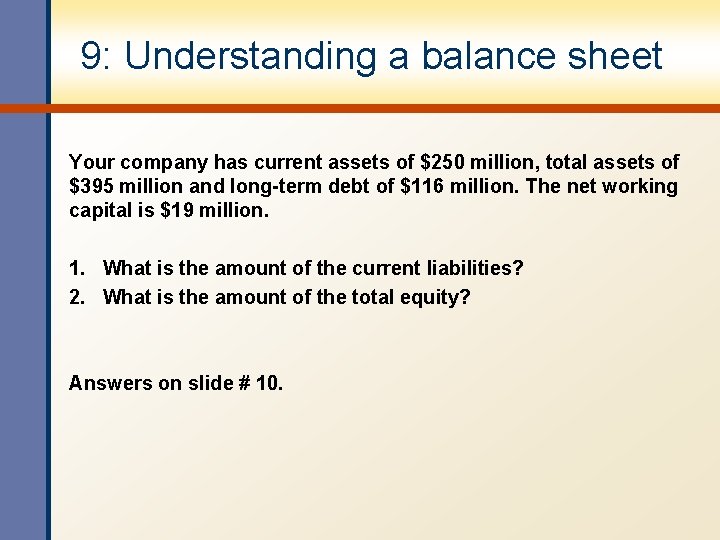
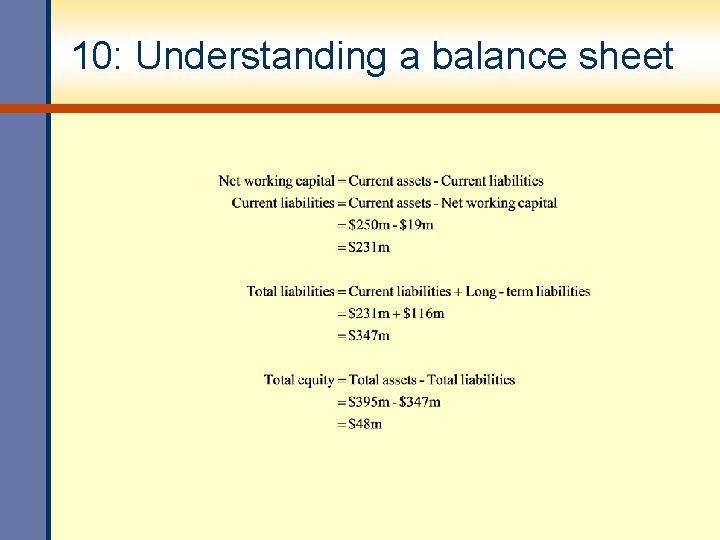
9: Understanding a balance sheet Your company has current assets of $250 million, total assets of $395 million and long-term debt of $116 million. The net working capital is $19 million. 1. What is the amount of the current liabilities? 2. What is the amount of the total equity? Answers on slide # 10.
10: Understanding a balance sheet
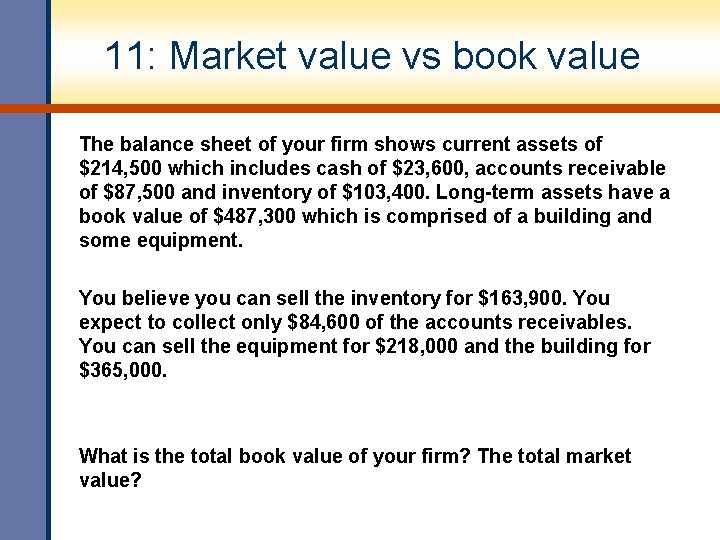
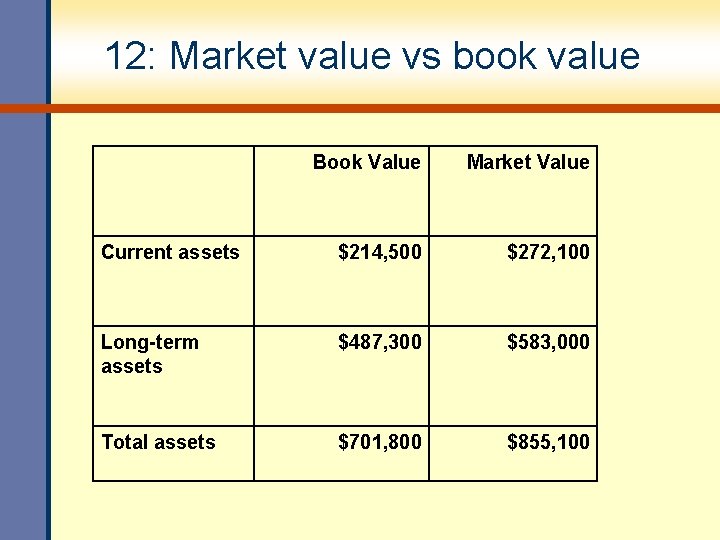
11: Market value vs book value The balance sheet of your firm shows current assets of $214, 500 which includes cash of $23, 600, accounts receivable of $87, 500 and inventory of $103, 400. Long-term assets have a book value of $487, 300 which is comprised of a building and some equipment. You believe you can sell the inventory for $163, 900. You expect to collect only $84, 600 of the accounts receivables. You can sell the equipment for $218, 000 and the building for $365, 000. What is the total book value of your firm? The total market value?
12: Market value vs book value Book Value Market Value Current assets $214, 500 $272, 100 Long-term assets $487, 300 $583, 000 Total assets $701, 800 $855, 100
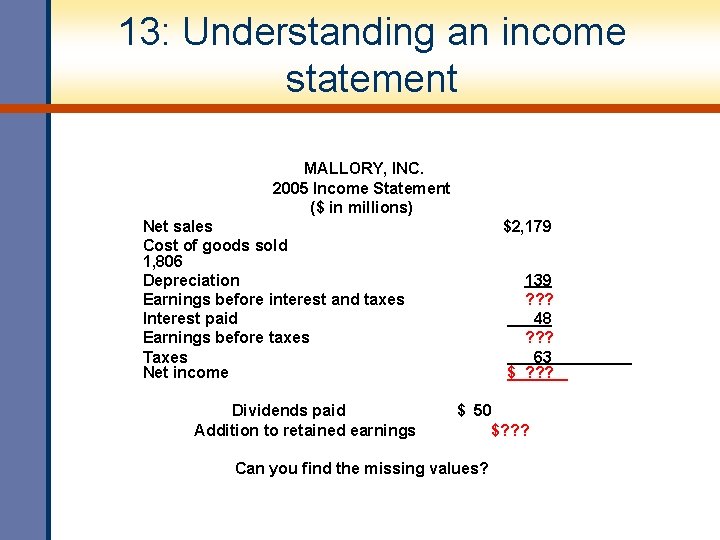
13: Understanding an income statement MALLORY, INC. 2005 Income Statement ($ in millions) Net sales Cost of goods sold 1, 806 Depreciation Earnings before interest and taxes Interest paid Earnings before taxes Taxes Net income Dividends paid Addition to retained earnings $2, 179 139 ? ? ? 48 ? ? ? 63 $ ? ? ? $ 50 $? ? ? Can you find the missing values?
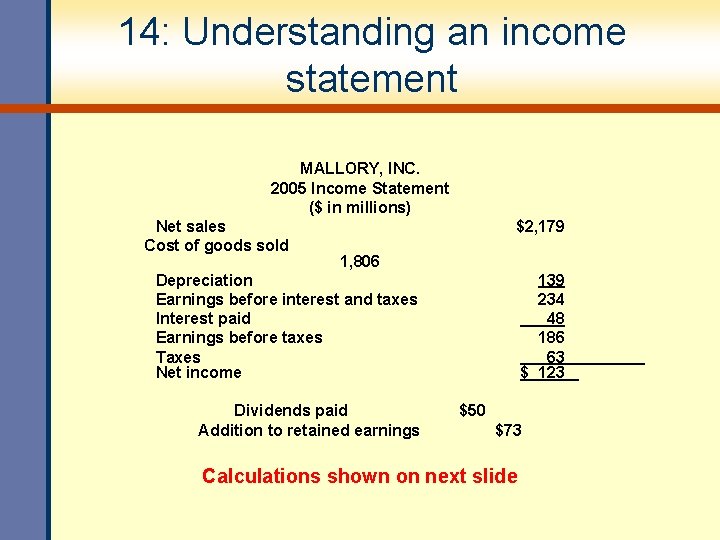
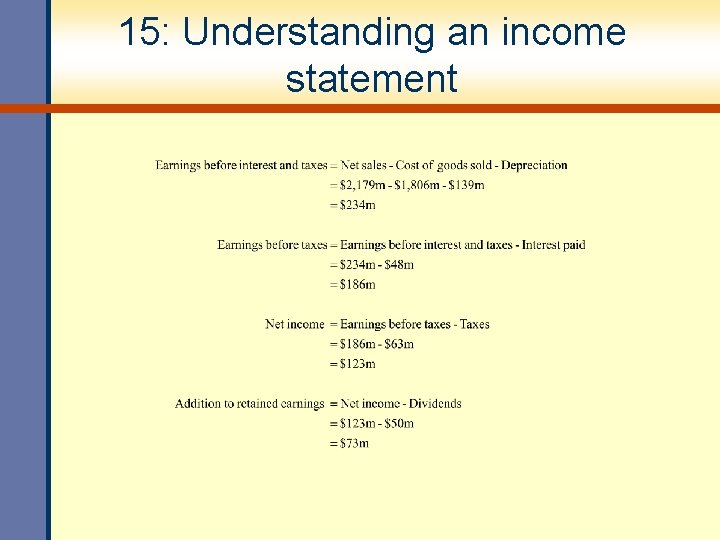
14: Understanding an income statement MALLORY, INC. 2005 Income Statement ($ in millions) Net sales Cost of goods sold $2, 179 1, 806 Depreciation Earnings before interest and taxes Interest paid Earnings before taxes Taxes Net income Dividends paid Addition to retained earnings 139 234 48 186 63 $ 123 $50 $73 Calculations shown on next slide
15: Understanding an income statement
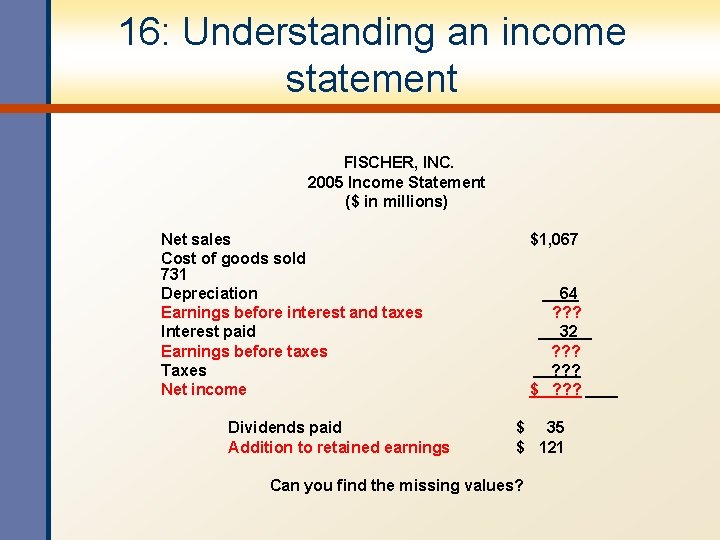
16: Understanding an income statement FISCHER, INC. 2005 Income Statement ($ in millions) Net sales Cost of goods sold 731 Depreciation Earnings before interest and taxes Interest paid Earnings before taxes Taxes Net income Dividends paid Addition to retained earnings $1, 067 64 ? ? ? 32 ? ? ? $ 35 $ 121 Can you find the missing values?
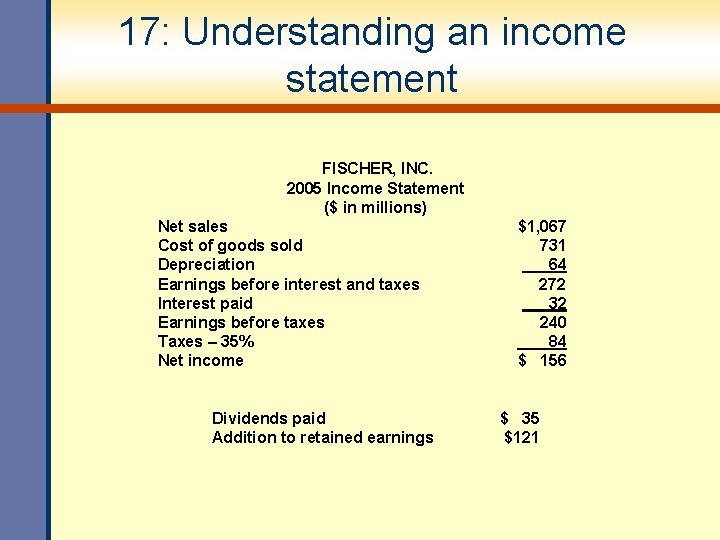
17: Understanding an income statement FISCHER, INC. 2005 Income Statement ($ in millions) Net sales Cost of goods sold Depreciation Earnings before interest and taxes Interest paid Earnings before taxes Taxes – 35% Net income Dividends paid Addition to retained earnings $1, 067 731 64 272 32 240 84 $ 156 $ 35 $121
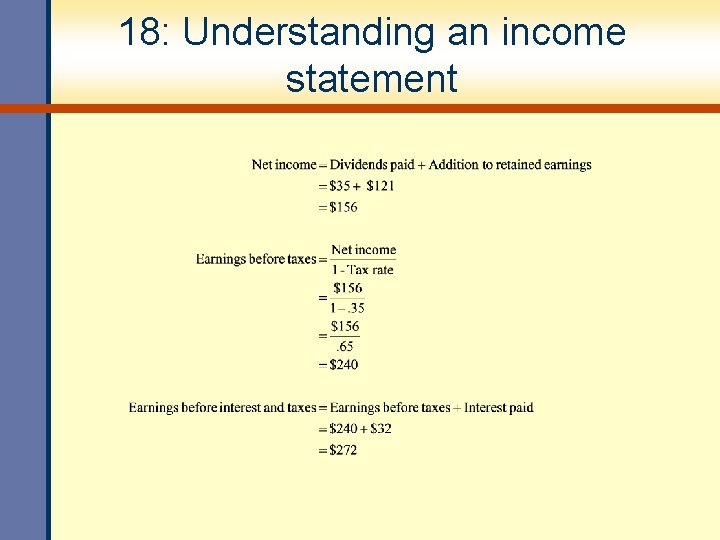
18: Understanding an income statement
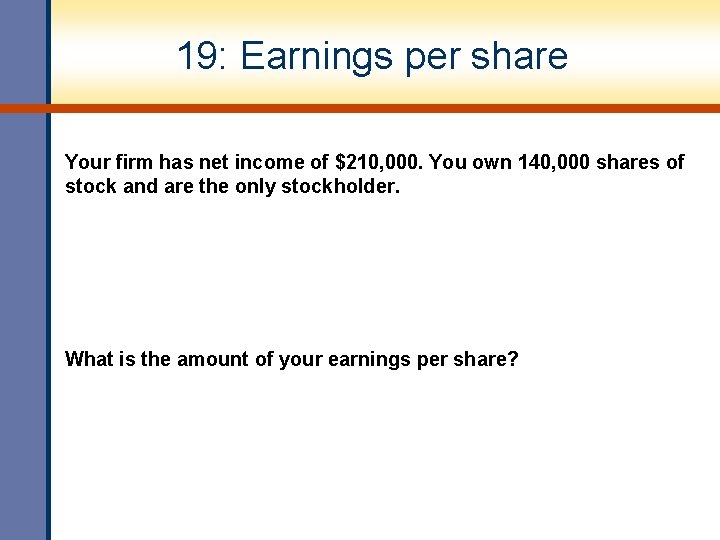
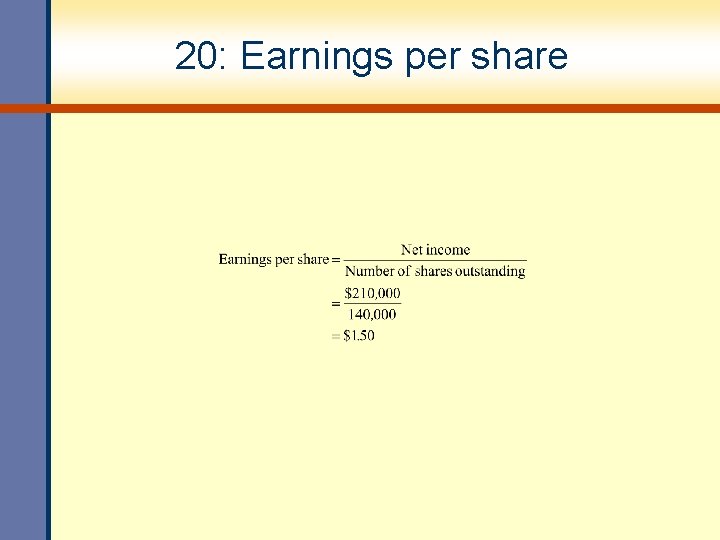
19: Earnings per share Your firm has net income of $210, 000. You own 140, 000 shares of stock and are the only stockholder. What is the amount of your earnings per share?
20: Earnings per share
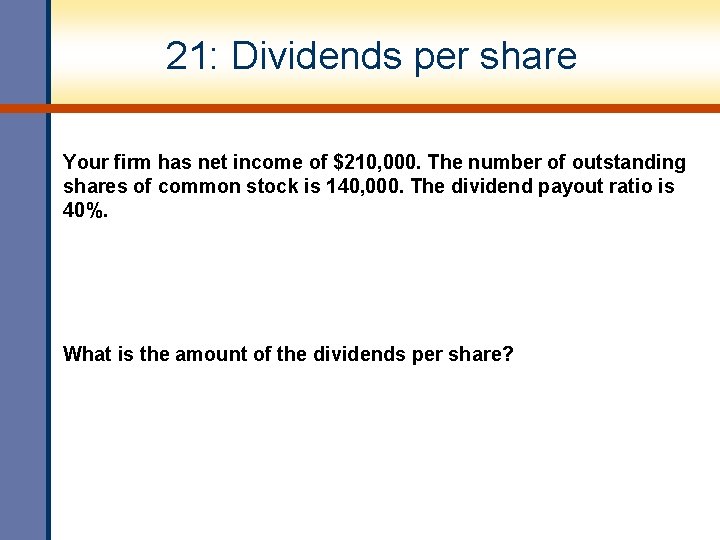
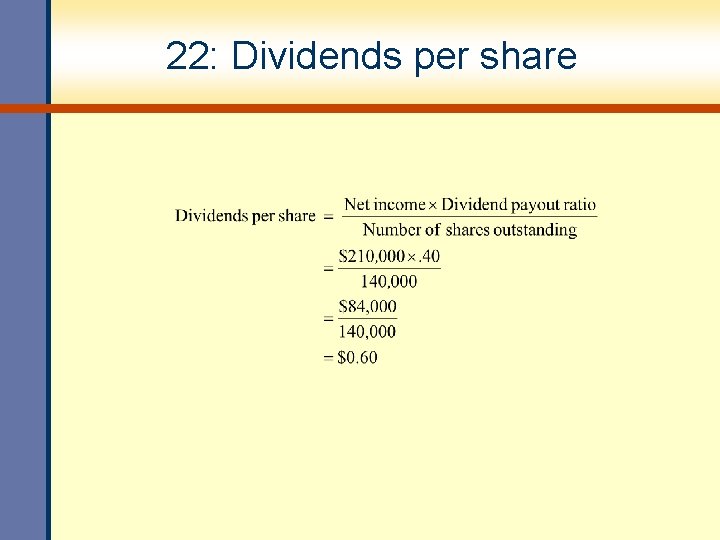
21: Dividends per share Your firm has net income of $210, 000. The number of outstanding shares of common stock is 140, 000. The dividend payout ratio is 40%. What is the amount of the dividends per share?
22: Dividends per share
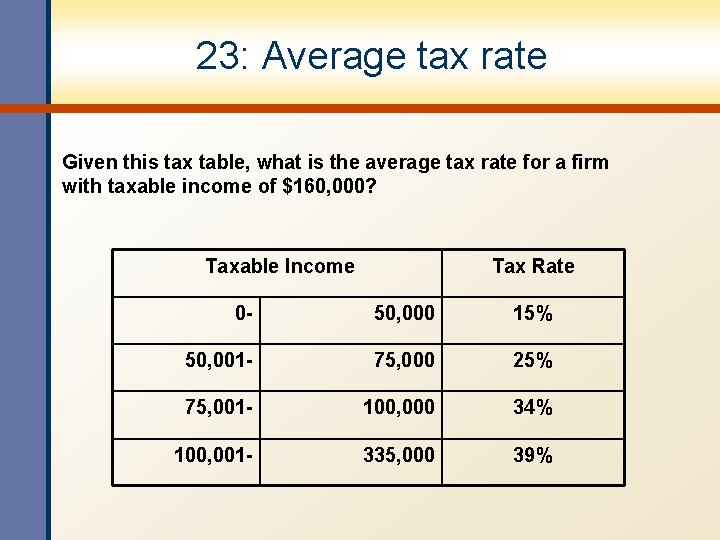
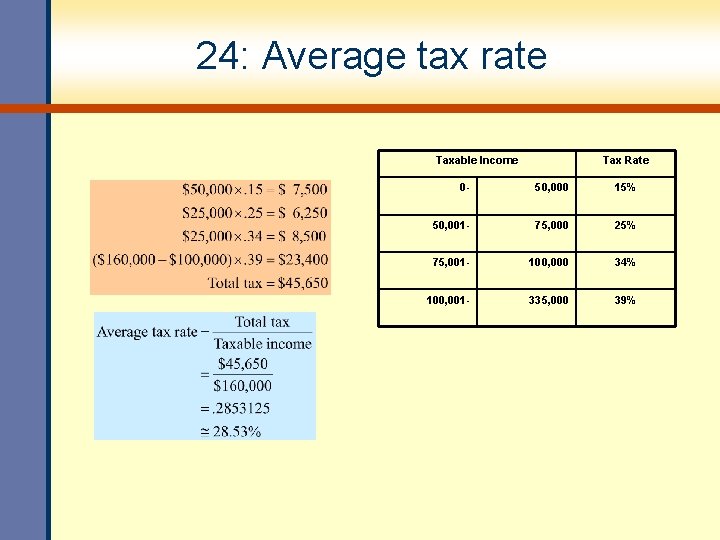
23: Average tax rate Given this tax table, what is the average tax rate for a firm with taxable income of $160, 000? Taxable Income Tax Rate 0 - 50, 000 15% 50, 001 - 75, 000 25% 75, 001 - 100, 000 34% 100, 001 - 335, 000 39%
24: Average tax rate Taxable Income Tax Rate 0 - 50, 000 15% 50, 001 - 75, 000 25% 75, 001 - 100, 000 34% 100, 001 - 335, 000 39%
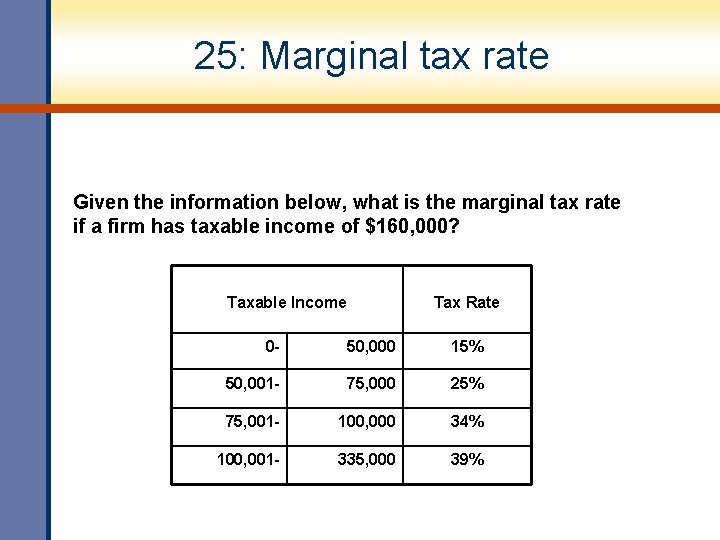
25: Marginal tax rate Given the information below, what is the marginal tax rate if a firm has taxable income of $160, 000? Taxable Income Tax Rate 0 - 50, 000 15% 50, 001 - 75, 000 25% 75, 001 - 100, 000 34% 100, 001 - 335, 000 39%
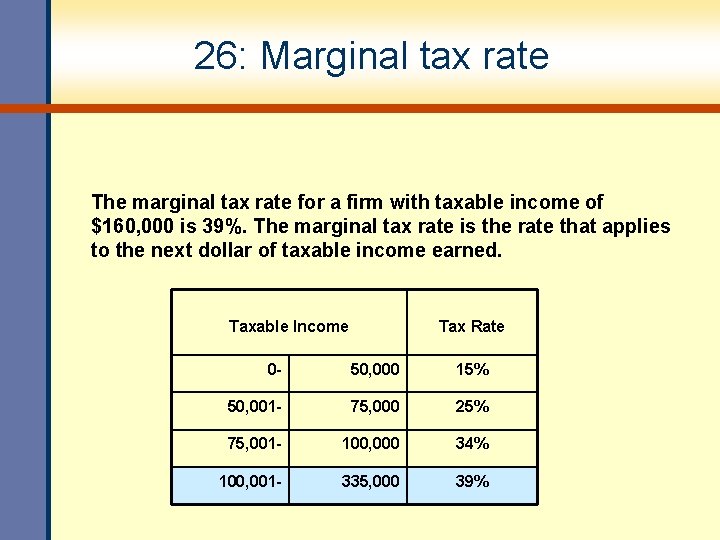
26: Marginal tax rate The marginal tax rate for a firm with taxable income of $160, 000 is 39%. The marginal tax rate is the rate that applies to the next dollar of taxable income earned. Taxable Income Tax Rate 0 - 50, 000 15% 50, 001 - 75, 000 25% 75, 001 - 100, 000 34% 100, 001 - 335, 000 39%
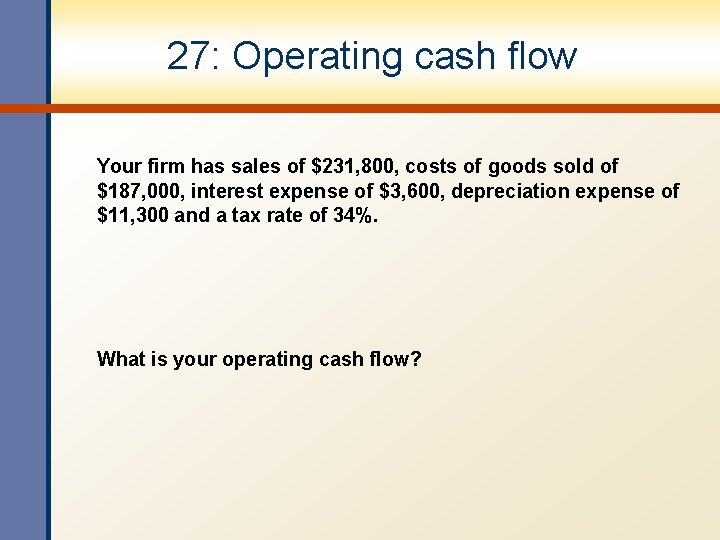
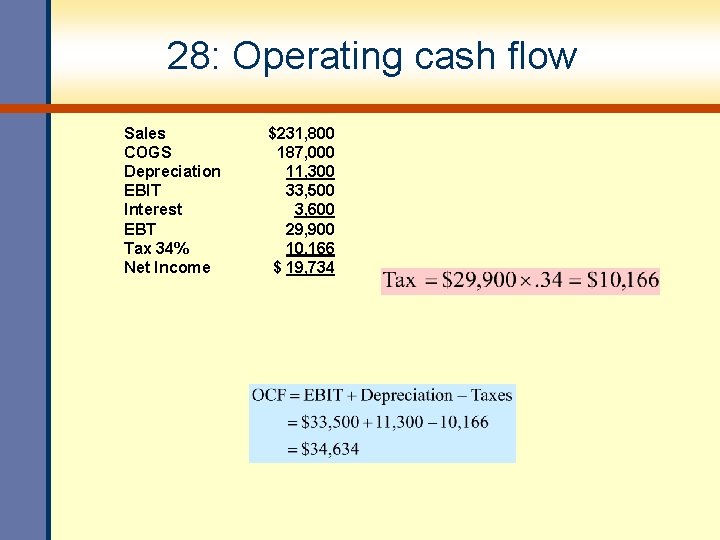
27: Operating cash flow Your firm has sales of $231, 800, costs of goods sold of $187, 000, interest expense of $3, 600, depreciation expense of $11, 300 and a tax rate of 34%. What is your operating cash flow?
28: Operating cash flow Sales COGS Depreciation EBIT Interest EBT Tax 34% Net Income $231, 800 187, 000 11, 300 33, 500 3, 600 29, 900 10, 166 $ 19, 734
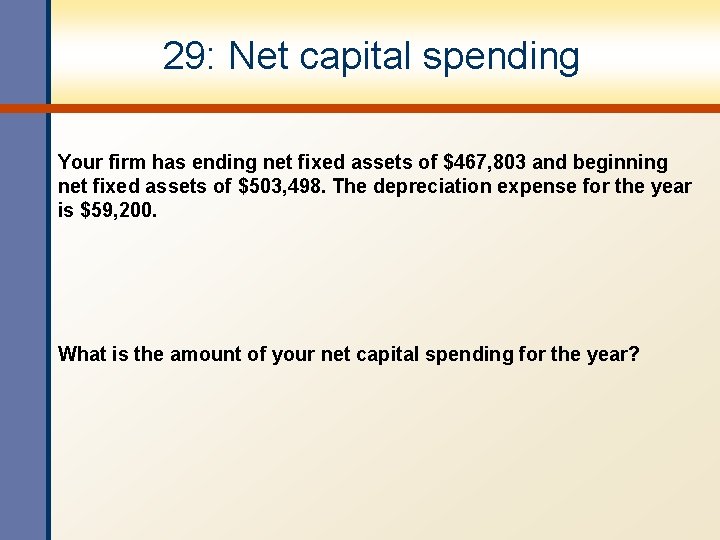
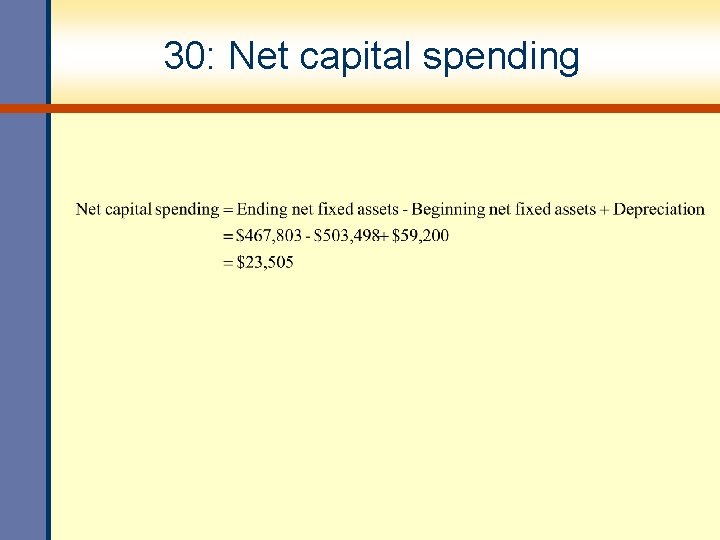
29: Net capital spending Your firm has ending net fixed assets of $467, 803 and beginning net fixed assets of $503, 498. The depreciation expense for the year is $59, 200. What is the amount of your net capital spending for the year?
30: Net capital spending
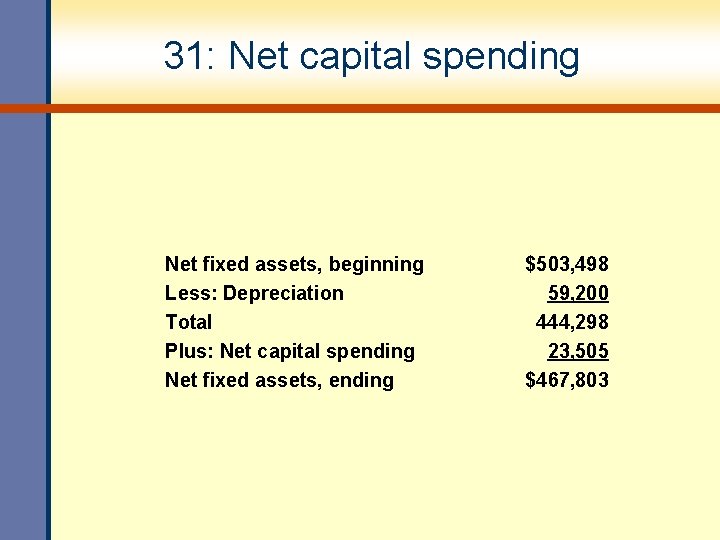
31: Net capital spending Net fixed assets, beginning Less: Depreciation Total Plus: Net capital spending Net fixed assets, ending $503, 498 59, 200 444, 298 23, 505 $467, 803
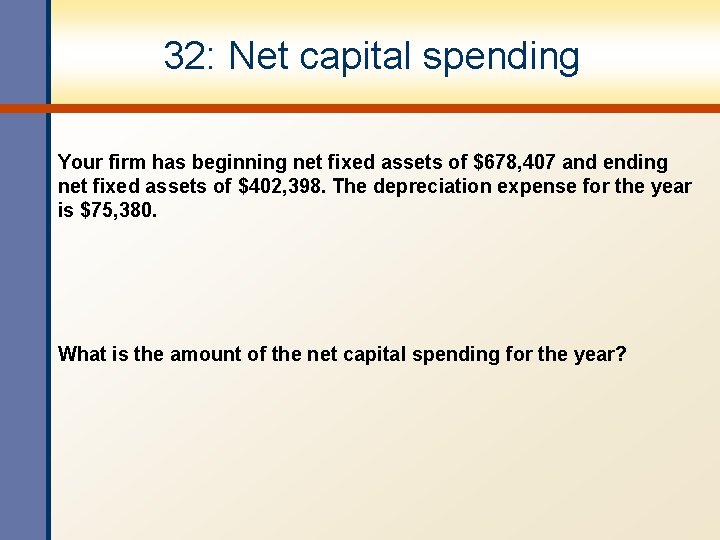
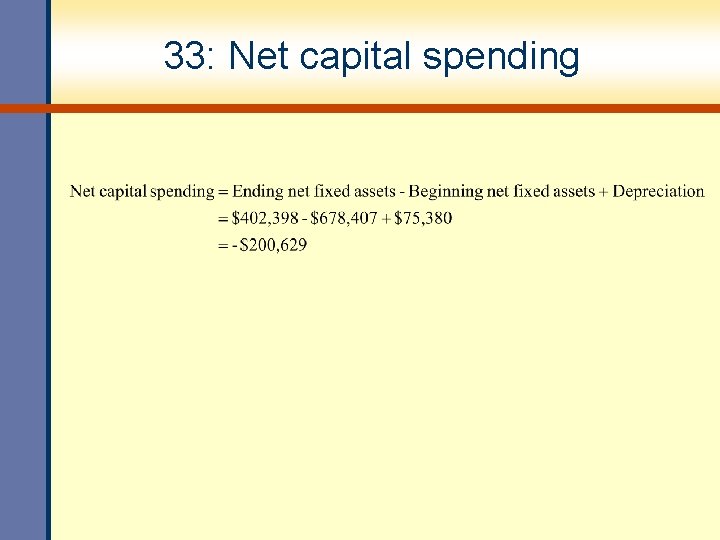
32: Net capital spending Your firm has beginning net fixed assets of $678, 407 and ending net fixed assets of $402, 398. The depreciation expense for the year is $75, 380. What is the amount of the net capital spending for the year?
33: Net capital spending
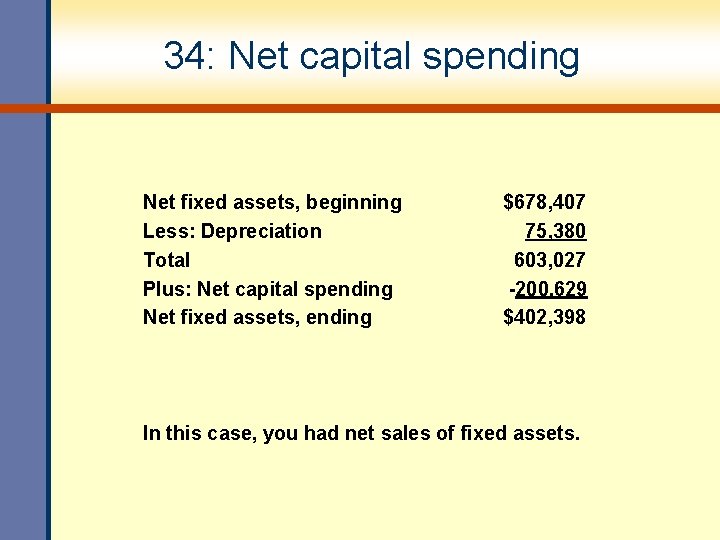
34: Net capital spending Net fixed assets, beginning Less: Depreciation Total Plus: Net capital spending Net fixed assets, ending $678, 407 75, 380 603, 027 -200, 629 $402, 398 In this case, you had net sales of fixed assets.
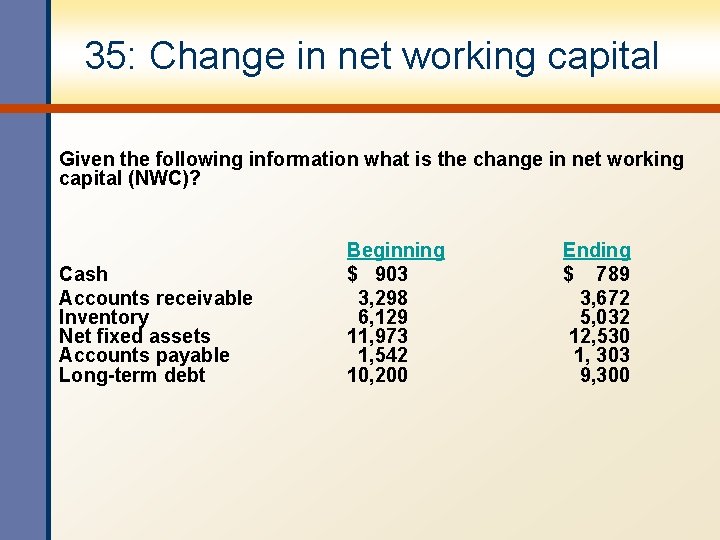
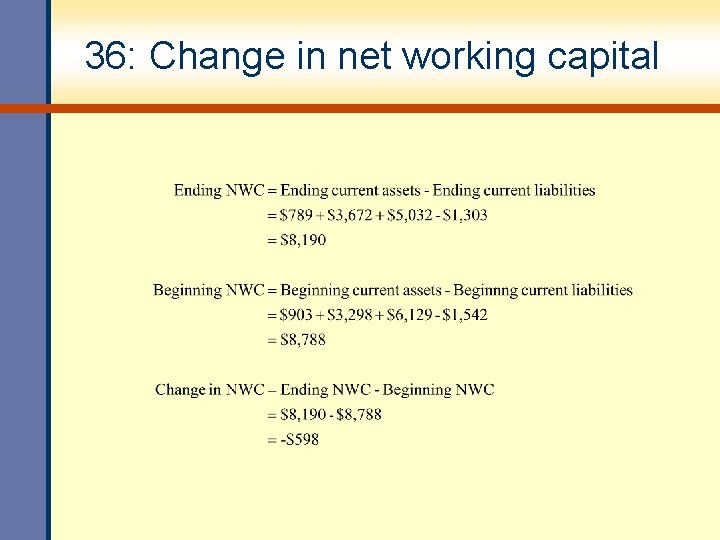
35: Change in net working capital Given the following information what is the change in net working capital (NWC)? Cash Accounts receivable Inventory Net fixed assets Accounts payable Long-term debt Beginning $ 903 3, 298 6, 129 11, 973 1, 542 10, 200 Ending $ 789 3, 672 5, 032 12, 530 1, 303 9, 300
36: Change in net working capital
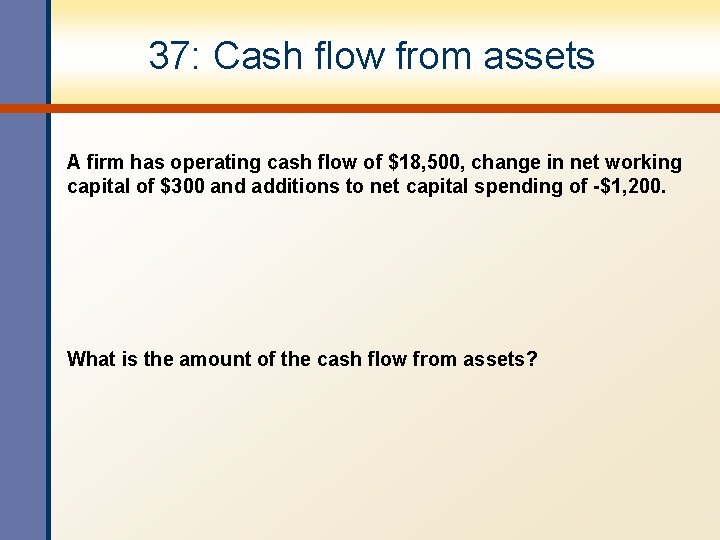
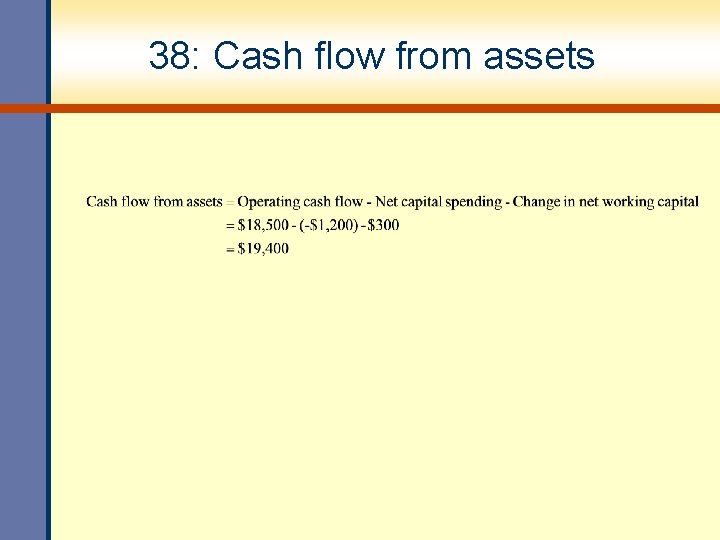
37: Cash flow from assets A firm has operating cash flow of $18, 500, change in net working capital of $300 and additions to net capital spending of -$1, 200. What is the amount of the cash flow from assets?
38: Cash flow from assets
39: Cash flow to creditors
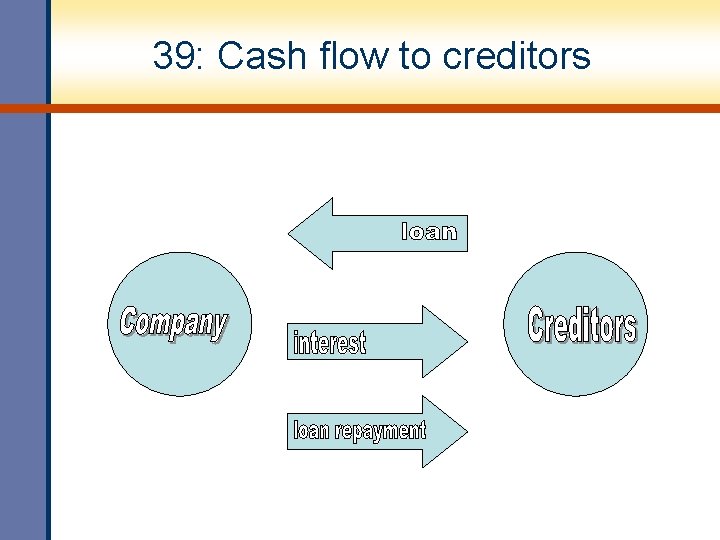
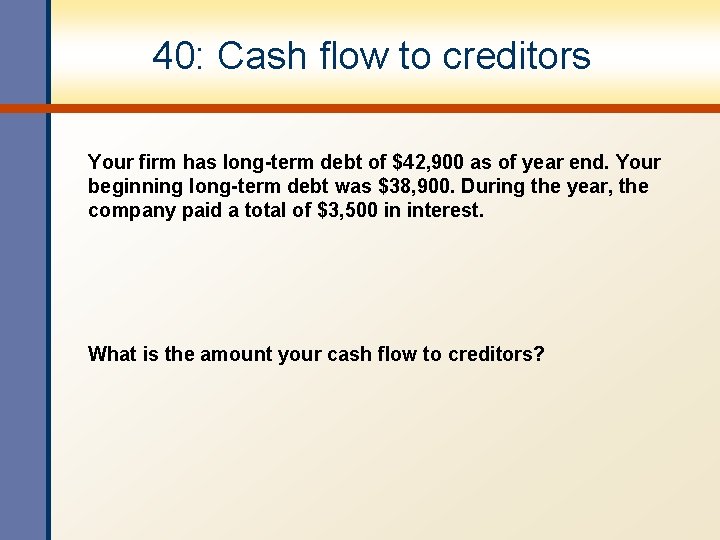
40: Cash flow to creditors Your firm has long-term debt of $42, 900 as of year end. Your beginning long-term debt was $38, 900. During the year, the company paid a total of $3, 500 in interest. What is the amount your cash flow to creditors?
41: Cash flow to creditors
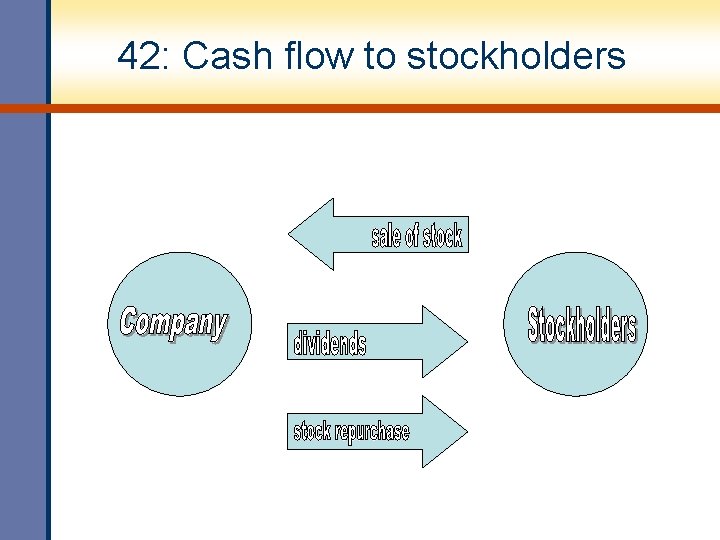
42: Cash flow to stockholders
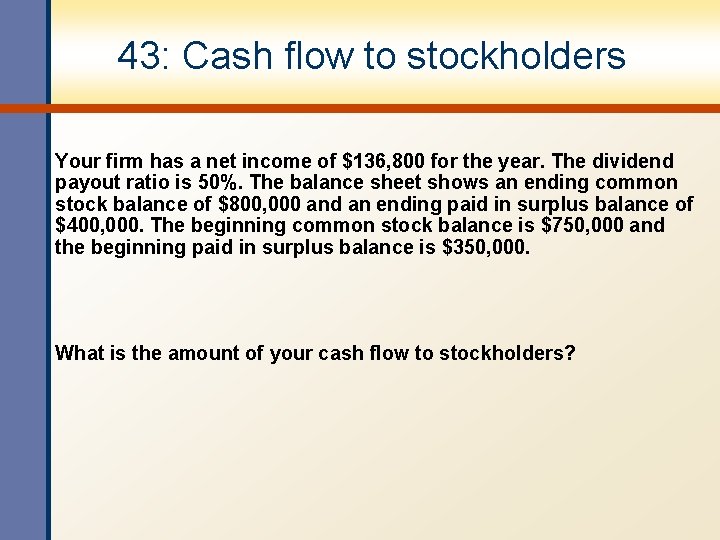
43: Cash flow to stockholders Your firm has a net income of $136, 800 for the year. The dividend payout ratio is 50%. The balance sheet shows an ending common stock balance of $800, 000 and an ending paid in surplus balance of $400, 000. The beginning common stock balance is $750, 000 and the beginning paid in surplus balance is $350, 000. What is the amount of your cash flow to stockholders?
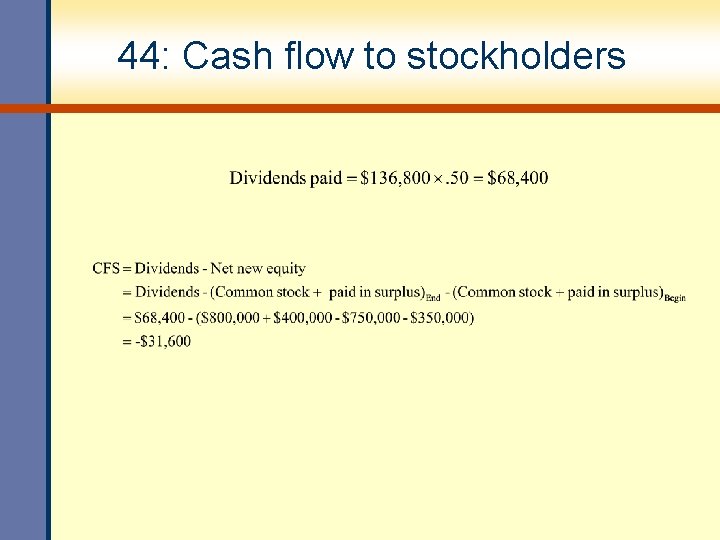
44: Cash flow to stockholders
Chapter 2 • End of Chapter 2 Mc. Graw-Hill/Irwin Copyright © 2006 by The Mc. Graw-Hill Companies, Inc. All rights reserved.