Terahertz spectroscopy of electromagnons excitation in a hexaferrite


 In 2003, RMn. O 3(R; rare earth element) Spiral-spin-order")


 (120) Transition of spin phase (100) by magnetic field Proper screw Longitudinal")
 • THz-TDS enables us to observe a waveform of")


![[001] Electromagnon L ・observed at THz region ・depends on the direction of electric field](https://slidetodoc.com/presentation_image_h2/75889690cac73cccf0711f7f0f1a5359/image-22.jpg "[001] Electromagnon L ・observed at THz region ・depends on the direction of electric field")

- Slides: 23
Terahertz spectroscopy of electromagnons excitation in a hexaferrite Ba 2 Mg 2 Fe 12 O 22 Phy. Rev. B 80, 220406(R) (2009) Phy. Rev. B 83, 064422(2011) Ashida Lab. Tadataka Saito
Contents • Introduction Polarization and magnetization Multiferroics Electromagnon • Method THz. TDS • Results • Conclusion
Introduction Polarization and Magnetization 強誘電性と強磁性 Polarization + E + + - 分極 Ferroelectric and Ferromagnetic + + P + Magnetization 磁化 Application for memory devices H M M=0
Introduction Multiferroics are materials where ferroelectricity and ferromagnetism are inherently coupled. E P H M The magnetization can be controlled by electric field of light. The polarization can be controlled by magnetic field.
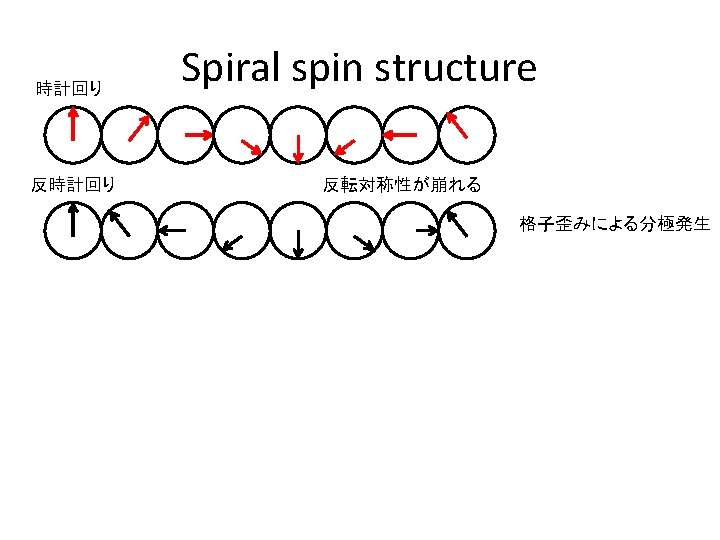
Introduction Magnetoelectric effect (ME effect) In 2003, RMn. O 3(R; rare earth element) Spiral-spin-order らせんスピン磁性 c Ptotal //c b a bc-spiral Polar lattice distortion 空間格子の反転対称性の歪み Induce Polarization Antisymmetry Dzyaloshinskii-Moriya interaction
Introduction Electromagnon Magnon Spin wave Magnon is exited by magnetic field of light. Multiferroics Magnon can be excited by electric field of light. Electromagnon (2006)
Introduction Theory of electromagnon ME effect Ptotal //c c b Eω//a a Symmetric exchange interaction Mn E O Mn
Introduction 六方晶フェライト Hexagonal ferrite Ba 2 Mg 2 Fe 12 O 22 Ferri magnetic Room temperature proper screw T<195 K Conical spin T<50 K By neutron diffraction
Introduction (001) (120) Transition of spin phase (100) by magnetic field Proper screw Longitudinal conical spin Ferrimagnetic θ H(>3 T) H//[001] Transverse conical spin H//[100] Ferrimagnetic H(> 4 T)
Method Terahertz time-domain spectroscopy (THz-TDS) • THz-TDS enables us to observe a waveform of ”E(t)” directly. • By using THz-TDS , both amplitude and phase of ”E(t)” are directly obtained. Probe beam fs pulse laser Pump beam THz detector Delay stage THz emitter sample THz-TDS
Results Longitudinal conical form F F F C C Proper Conical Proper-screw Ferri
Results Transverse conical form F F F C C Ferri Proper Conical Proper-screw Ferri
Conclusion ・The electromagnon appears only in the conical spin ordered phase but irrespective of the longitudinal or the transverse conical form. No electromagnon is observed in the properscrew or ferrimagnetic phase. ・The symmetric exchange interaction (Si・Sj) is dominant source of the observed electromagnon. Noncolinear spin structure at room temperature Electromagnon at room temperature
Purpose ・To investigate the situation where electromagnon induced by changing temperature and external magnetic field ・How the intensity of the absorption by electromagnon depend on the external magnetic field? Is it possible to induce electromagnon at room temperature?
Decide optical coefficient Sample d Fourier transformed spectrum Transmission Fresnel constants
Experimental set up
Results Emergency of electromagnon depend on the direction of electric field at conical spin phase(4. 3 K) depend on the external magnetic field (H//[001], 4. 3 K) Absorption by electromagnon is obserbed around 2. 8 me. V(0. 7 THz). Phy. Rev. B 80, 220406(R) (2009)
Y-type
[001] Electromagnon L ・observed at THz region ・depends on the direction of electric field ・The intensity of absorption depend on the external magnetic field. Magnon H [100] S Energy ………. . at THz region (0. 1 THz-10 THz) 0. 41 me. V-41 me. V [120]
RMn. O 3 electromagnon