Study of Pion Capture Solenoids for PRISM H


- Slides: 30

Study of Pion Capture Solenoids for PRISM H. Ohnishi AB M. Aoki C, Y. Ajima A, N. Fukasawa AD, K. Ishibashi B, Y. Kuno C, T. Miura A, K. Nakahara C, T. Nakamoto A, N. Nosaka C, M. Numajiri A, A. Sato C, N. Shigyo B, A. Yamamoto A, T. Yokoi A and K. Yoshimura A KEK A, Kyushu University B, Osaka University C, Tokyo University of Science D Nufact’ 03 June 7, 2003

Outline • Introduction – Pion capture solenoid for PRISM • A Model Experiment to Measure Radiation Heat Load – Experimental set up – Measurement – Results – Comparison with simulation results (MARS) • Further R&D plan • Summary

Pion Capture Solenoid for PRISM 50 Ge. V protons 750 k. W SC Solenoid Shield Pion capture solenoid PRISM • PRISM needs the SC solenoid required a high field (Bc = 6~12 T) – Keep the solenoid at low temperature • The solenoid is heated by radiations from the target • To reduce the radiation heat load, thick radiation shield is needed • We estimate the radiation heat load with simulation code MARS, but the accuracy of simulation results have not been studied We experimentally evaluate the accuracy of simulation results.

A Model Experiment to Measure Radiation Heat Load • Radiation heating in a model solenoid (mockup) was precisely measured • The experimental results were compared with the result obtained by MARS

Experimental Conditions (KEK 12 Ge. V-PS) Beam parameters – 12 Ge. V proton – Intensity ~1011 (protons/sec) – Slow extraction Experimental area – At upstream of EP 2 -A dump EP 2 1 m A-line KEK 12 Ge. V-PS main ring Experimental area Beam Dump

Experimental setup 12 Ge. V primary protons 1011(p/s) • Sensitive measurement of radiation heat load to the mockup with the cryo-calorimeter

Experimental Installation Cryostat 12 Ge. VPS primary protons Beam dump 12 Ge. V ~1011(p/s) Experimental area Mockup Beam Dump 240 mm

Profile & Intensity of Primary Protons Mockup Target (off) Profile of Primary Protons Cu foil intensity area (mm) (protons/sec) Cu foil Activate! SEC primary protons fraction (%) f 20 6. 70 ( 0. 45) 1010 99. 92 f 20_30 3. 14 ( 0. 26) 107 0. 05 f 30_40 1. 19 ( 0. 09) 107 0. 02 f 40_50 8. 00 ( 0. 77) 106 0. 01 Target size f 30 → >99. 9 % protons bombard the target SEC count rate 23. 16 (counts/sec) Calibration result 2. 89 0. 19 (109 protons/count)

Cryo-calorimeter Highly sensitive measurement by cooling the mockup (20 K) • Highly sensitive thermometers (resolution < 20 m. K) • Quick response because of small specific heat Mockup temperature rise up DT = Q K at thermal equilibrium state Q : Heat load K : Thermal conductance determined by thermal shunt Thermal shunt determines the relation between mockup temperature and heat load

How to Measure Radiation Heat Load Target Thermalequilibriumstate! Qbeam (W) beam TTheater Qbeam Qheater GM cryocooler Mockup Heater Qheater(W) Mockup temperature Thermometer Thermal shunt Tbeam Theater Tbeam = Theater Qbeam = Qheater time

Typical Experimental Data Thermal balance Tbeam heater Thermal balance Theater Target on / off Qbeam Qheater Target on Target off Heater on Heater off Target on Tbeam = Theater → Qbeam = Qheater

Experimental Results Target position Radiation heat load (mm) (W at 1011 protons/sec) -80 0. 34 0. 02 12 Ge. V primary protons 80 0 -80 Target position 0 0. 88 0. 06 80 1. 42 0. 10 Overall error is nearly equal to 7 %

Comparison with simulation results 12 Ge. V Overall error < 7% primary protons 80 0 -80 Target position

Experimantal Summary • We have performed direct measurement of radiation heat load. • Experimental results are 20 -30% higher than simulation results • Experimental results show the consistent dependency with simulation.

Further R&D Plan for PRISM Capture Solenoid

Base-line Parameters for PRISM Capture Solenoid • Boundary condition – The maximum transverse momentum Pt = 300 B R/2 = 90 Me. V/c • Central field Bc = 6 T • Effective bore R = 0. 1 m

Solenoid Parameters • Parameters – Central field – Coil length ( 2 target length) – Stored energy / solenoid mass ratio – Solenoid inner radius – Al stabilized Nb. Ti cable • Radial thickness – Beam pipe 0. 1 m – Radiation shield f(x) – Vacuum insulation 0. 05 m 6 T 1. 6 m 10 k. J/kg x

Radiation Heat Load & Stored energy vs. Solenoid radius 50 Ge. V protons (750 k. W) Materials • Target C(graphite) • Shield W • Solenoid Al stabilized Nb. Ti

Preliminary design Parameters PRISM Central field(T) 6 Shield thickness(m) 0. 25 Solenoid radius(m) 0. 45~0. 55 Length(m) 1. 6 stored energy(MJ) 16 Heat load(W) 470

Small Size R&D Solenoid R&D solenoid PRISM R&D(1/2. 5 scale) 6 3~6 Shield thickness(m) 0. 25 - Solenoid radius(m) 0. 45~0. 55 0. 2~0. 24 Length(m) 1. 6 0. 4~0. 6 stored energy(MJ) 16 0. 5~1 Heat load(W) 470/(2. 5)3 = 30 Central field(T)

Summary • We have performed direct measurement of radiation heat load • Experimental results are 20 -30% higher than simulation results • Experimental results show the consistent dependency of target position with simulation • We are planning R&D with a small size solenoid

Error Breakdown Target position (mm) -80 0 80 *12 Ge. V proton – Cu 24 Na production cross section 5. 1 Ge detector efficiency 4. 3 Fluctuation of beam intensity 2. 1 0. 8 1. 3 Measurement of heat load <1 <1 <1 Total error 7. 0 6. 8 (%) * T. Asano et al, 'Target dependence of charge distributions in spallation reactions of medium-mass nuclei with 12 Ge. V protons' , Phys. Rev. C 28, 1718(1983)

Mockup & Target Mockup Target f 30 f 180 f 170 f 130 f 280 Resistive heater 30 C 20 240 Thermometer • Mockup – Made of copper – Set resistive heater • Thermometer – High sensitivity at low temperature – Four terminal measurement • Target – 0. 2 interaction length – Movable – Made of copper

Typical Experimental Data A 12 Ge. V protons (<200 W) C B B C A Heat load measurement has need to thermal equilibrium state Target position move to up-stream higher radiation heat load Many secondary particles fly out forward

Tbeam & Theater Difference between Tbeam and Theater < 0. 15 K

Plot Qheater vs. Theater DT = Q K

Correcting Qbeam with difference between Tbeam and Theater Qbeam Effect of the difference between Tbeam and Theater < 1%

Fluctuation of Beam Intensity Tbeam Theater Mockup temperature am ter Qhea Qbe Beam Intensity Fluctuation of beam intensity (protons/10 min) < 3%

Tbeam & Theater at Various Thermometer Theater Tbeam TMo. I-L &TMo. I-H TSh. I-L DT = Tbeam - Theater Qbeam TCold cryocooler TSh. I-L TSh. I-H TMo. I-L TMo. I-H Mockup

Effect of Outside Mockup Tbeam Theater Qbeam Theater Temperature of outside mockup is nearly constant. Effect of outside mockup to Tbeam & Theater hardly changed.
 Georgia karagiorgi
 Pion decay
 Pion geant
 Pion
Pion Pion diamonds
 Louis pion montre
 Pion lifetime
 Cks
Cks Läkarutlåtande för livränta
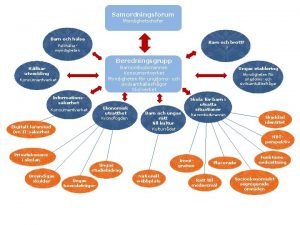
 Klassificeringsstruktur för kommunala verksamheter
 Returpilarna
 Inköpsprocessen steg för steg
 Påbyggnader för flakfordon
 Anatomi organ reproduksi
 Egg för emanuel
 Atmosfr
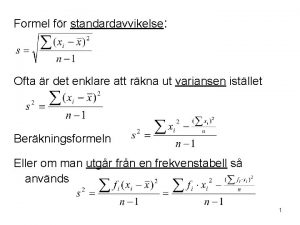
 Relativ standardavvikelse formel
 Tidbok för yrkesförare
 Rutin för avvikelsehantering
 Meios steg för steg
 Presentera för publik crossboss
 Formuö
 Myndigheten för delaktighet
 Hur skriver man en tes
 Kung som dog 1611
 Tack för att ni lyssnade
 Tobinskatten för och nackdelar
 Hur ser ett referat ut
 Varför kallas perioden 1918-1939 för mellankrigstiden
 Lågenergihus nyproduktion
 Tät skog karttecken


