Stream Nutrient Processing Spiraling Removal and Lotic Eutrophication


- Slides: 85
Stream Nutrient Processing: Spiraling, Removal and Lotic Eutrophication Ecohydrology Fall 2015
Nutrient Cycles • Global recycling of elemental requirements – Major elements (C, H, N, O, P, S) – Micro nutrients (Ca, Fe, Co, B, Mg, Mn, Cu, K, Z, Na, …) • These planetary element cycles are: – Exert massive control on ecological organization – In turn are controlled in their rate, mode, timing and location by ecological process – Are highly coupled to the planets water cycle – In many cases, are being dramatically altered by human enterprise – Ergo…ecohydrology
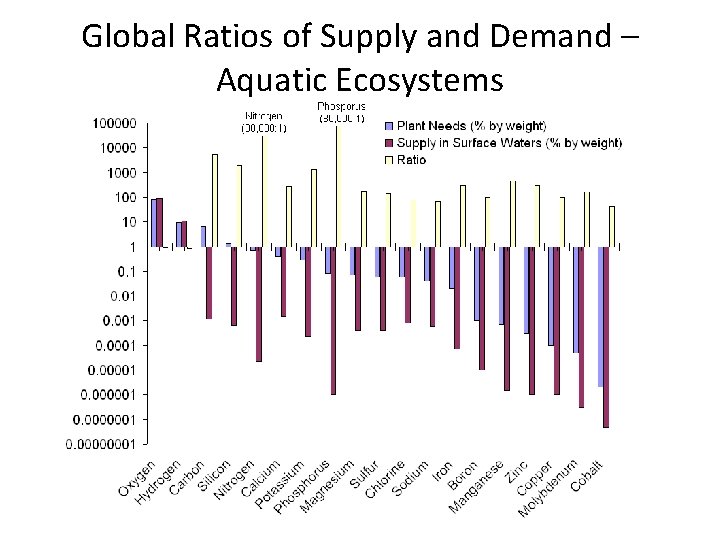
Global Ratios of Supply and Demand – Aquatic Ecosystems
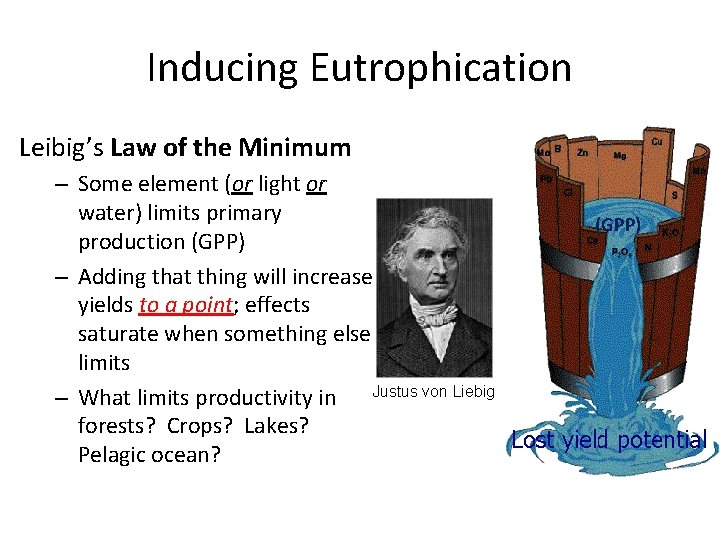
Inducing Eutrophication Leibig’s Law of the Minimum – Some element (or light or water) limits primary production (GPP) – Adding that thing will increase yields to a point; effects saturate when something else limits – What limits productivity in Justus von Liebig forests? Crops? Lakes? Pelagic ocean? (GPP)
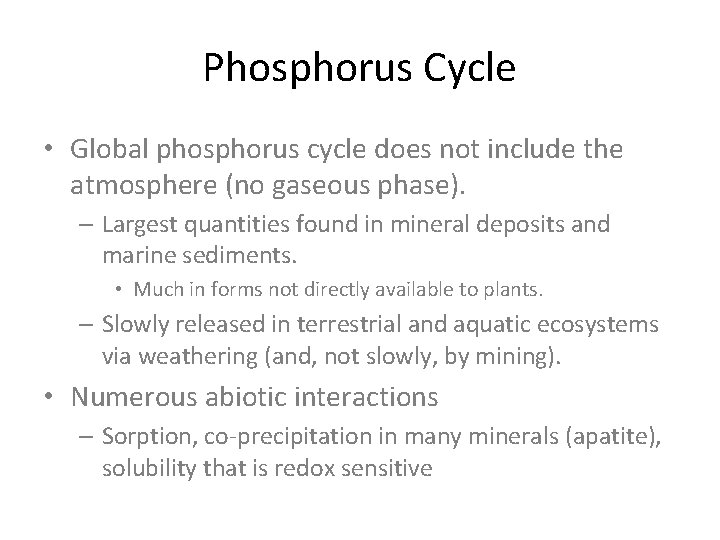
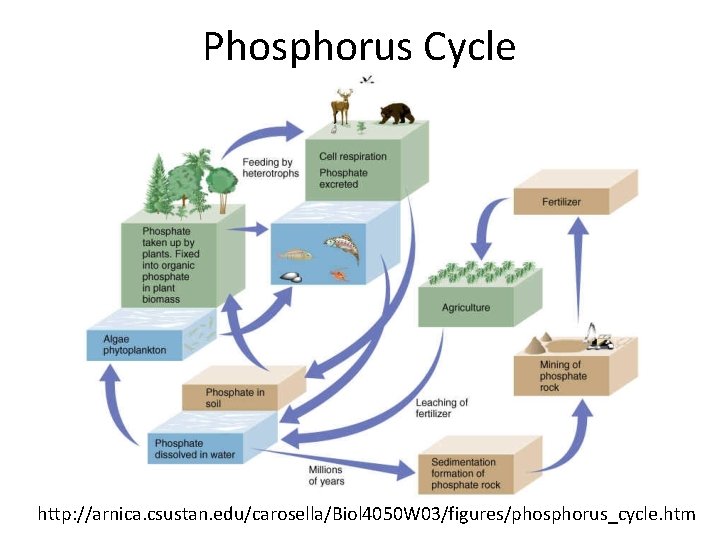
Phosphorus Cycle • Global phosphorus cycle does not include the atmosphere (no gaseous phase). – Largest quantities found in mineral deposits and marine sediments. • Much in forms not directly available to plants. – Slowly released in terrestrial and aquatic ecosystems via weathering (and, not slowly, by mining). • Numerous abiotic interactions – Sorption, co-precipitation in many minerals (apatite), solubility that is redox sensitive
Phosphorus Cycle http: //arnica. csustan. edu/carosella/Biol 4050 W 03/figures/phosphorus_cycle. htm
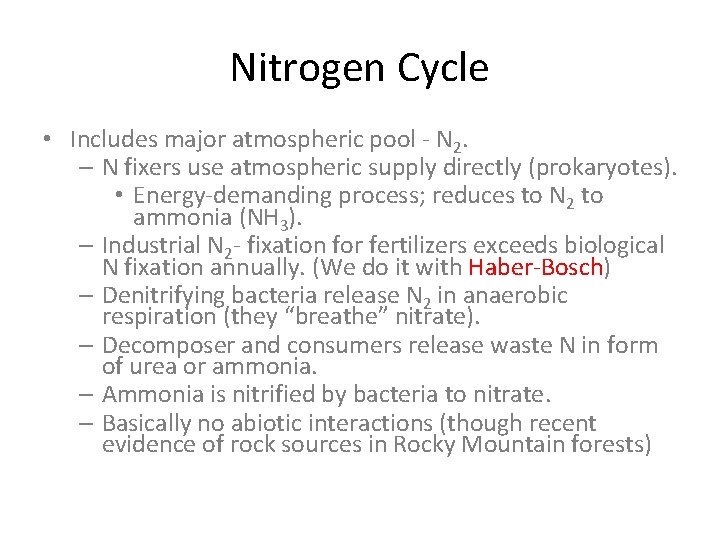
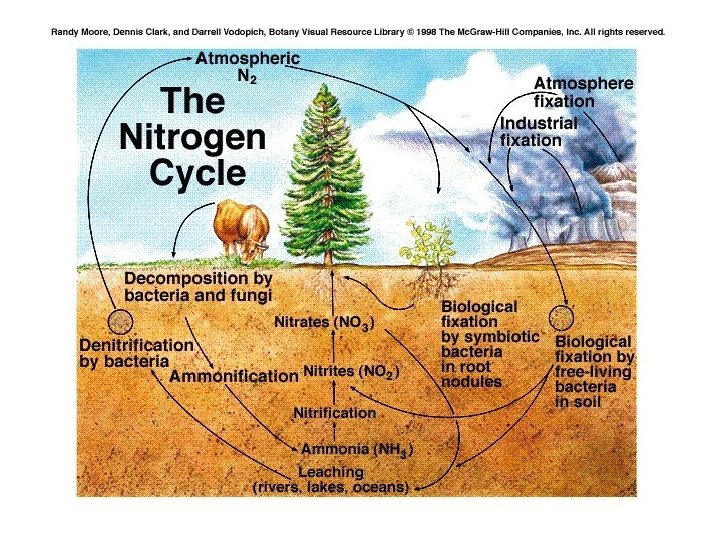
Nitrogen Cycle • Includes major atmospheric pool - N 2. – N fixers use atmospheric supply directly (prokaryotes). • Energy-demanding process; reduces to N 2 to ammonia (NH 3). – Industrial N 2 - fixation for fertilizers exceeds biological N fixation annually. (We do it with Haber-Bosch) – Denitrifying bacteria release N 2 in anaerobic respiration (they “breathe” nitrate). – Decomposer and consumers release waste N in form of urea or ammonia. – Ammonia is nitrified by bacteria to nitrate. – Basically no abiotic interactions (though recent evidence of rock sources in Rocky Mountain forests)
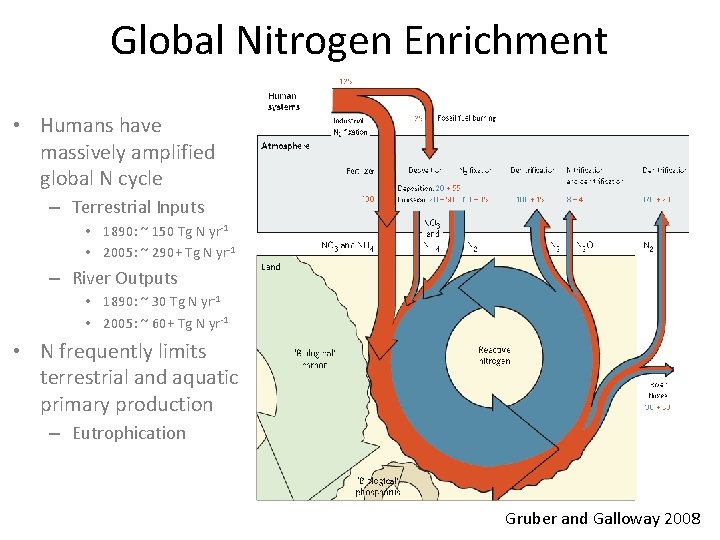
Global Nitrogen Enrichment • Humans have massively amplified global N cycle – Terrestrial Inputs • 1890: ~ 150 Tg N yr-1 • 2005: ~ 290+ Tg N yr-1 – River Outputs • 1890: ~ 30 Tg N yr-1 • 2005: ~ 60+ Tg N yr-1 • N frequently limits terrestrial and aquatic primary production – Eutrophication Gruber and Galloway 2008
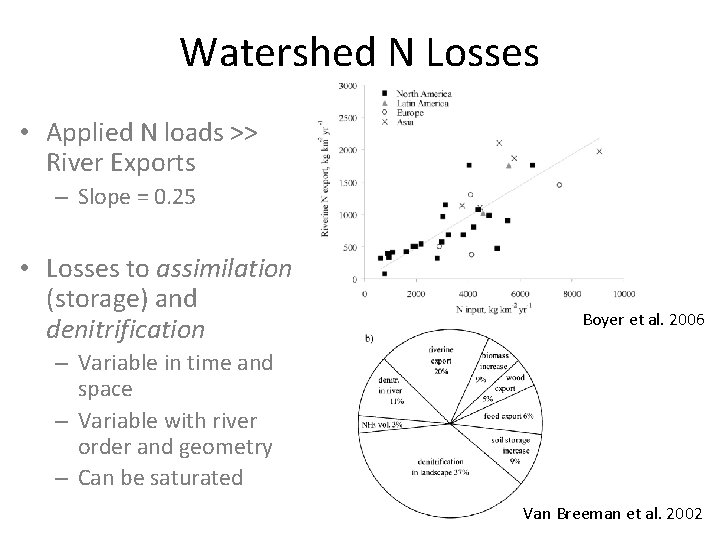
Watershed N Losses • Applied N loads >> River Exports – Slope = 0. 25 • Losses to assimilation (storage) and denitrification Boyer et al. 2006 – Variable in time and space – Variable with river order and geometry – Can be saturated Van Breeman et al. 2002
Rivers are not chutes (Rivers are the chutes down which slide the ruin of continents. L. Leopold) • Internal processes dramatically attenuate load – Assimilation to create particulate N – Denitrification – a permanent sink • Understanding the internal processing is important – Local effects of enrichment (i. e. , eutrophication) – Downstream protection (i. e. , autopurification) • Understanding nutrient processing (across scales) is a major priority
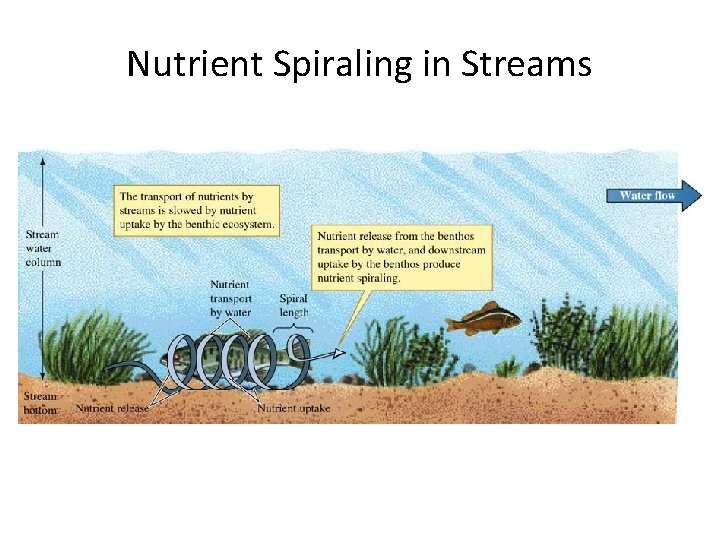
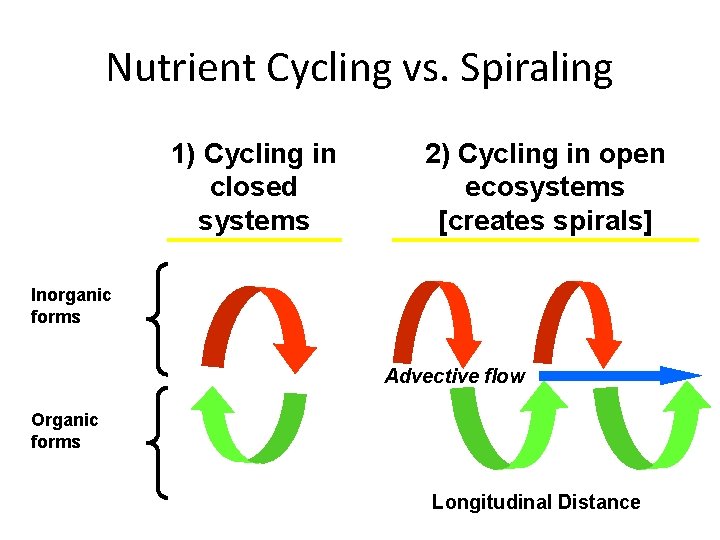
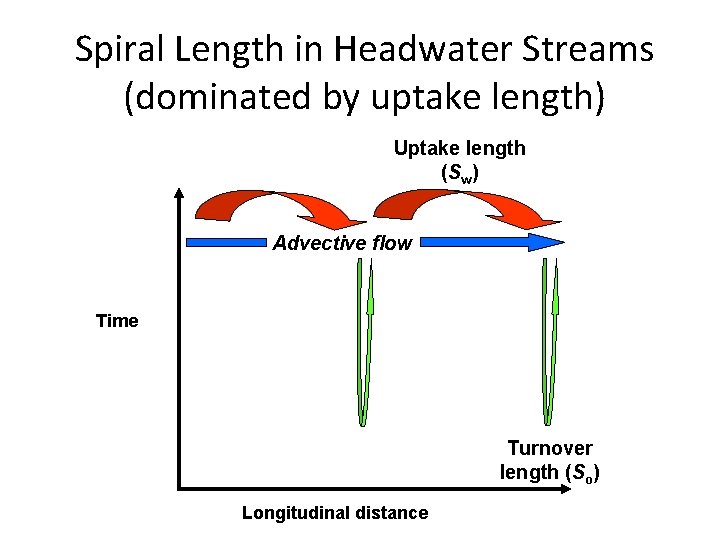
Nutrient Cycling in Streams • Advection it commanding organization process in streams and rivers – FLOW MATTERS • Nutrients in streams are subject to downstream transport. – Nutrient cycling does not happen in one place. – Flow turns nutrient cycles in SPIRALS – Spiraling Length is the length of a stream required for a nutrient atom to complete a cycle (mineral – organic – mineral). • Uptake (assimilation + other removal processes) • Remineralization
Nutrient Spiraling in Streams
Nutrient Cycling vs. Spiraling 1) Cycling in closed systems 2) Cycling in open ecosystems [creates spirals] Inorganic forms Advective flow Organic forms Longitudinal Distance
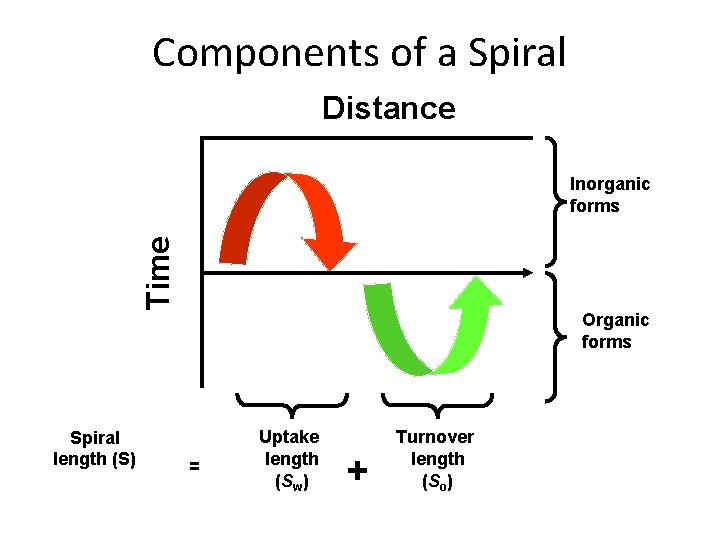
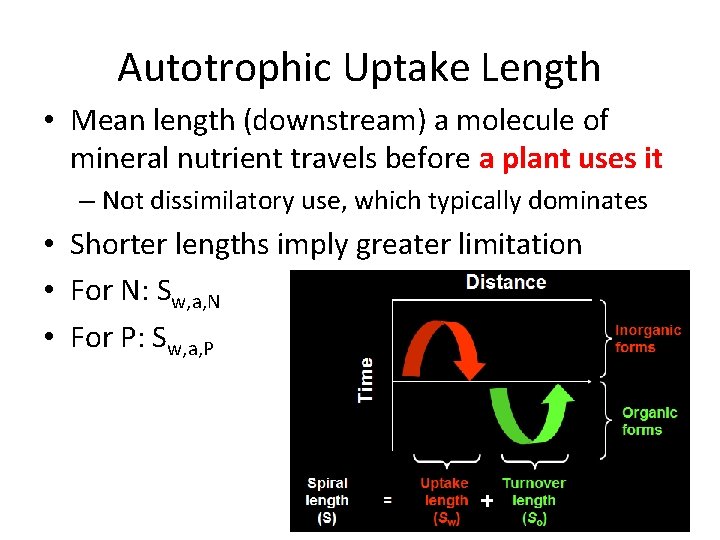
Components of a Spiral Distance Time Inorganic forms Spiral length (S) Organic forms = Uptake length (Sw) + Turnover length (So)
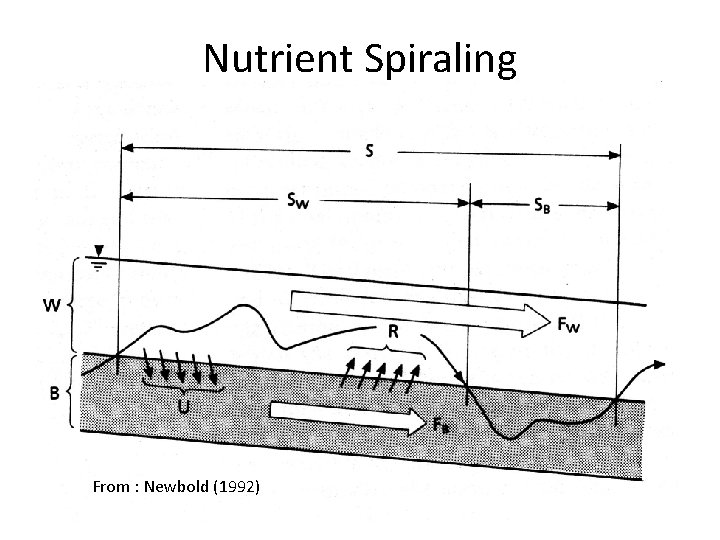
Nutrient Spiraling From : Newbold (1992)
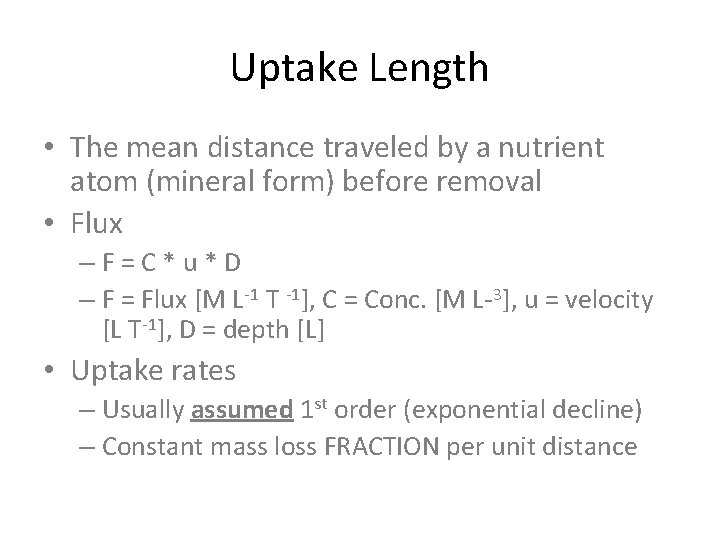
Uptake Length • The mean distance traveled by a nutrient atom (mineral form) before removal • Flux –F=C*u*D – F = Flux [M L-1 T -1], C = Conc. [M L-3], u = velocity [L T-1], D = depth [L] • Uptake rates – Usually assumed 1 st order (exponential decline) – Constant mass loss FRACTION per unit distance
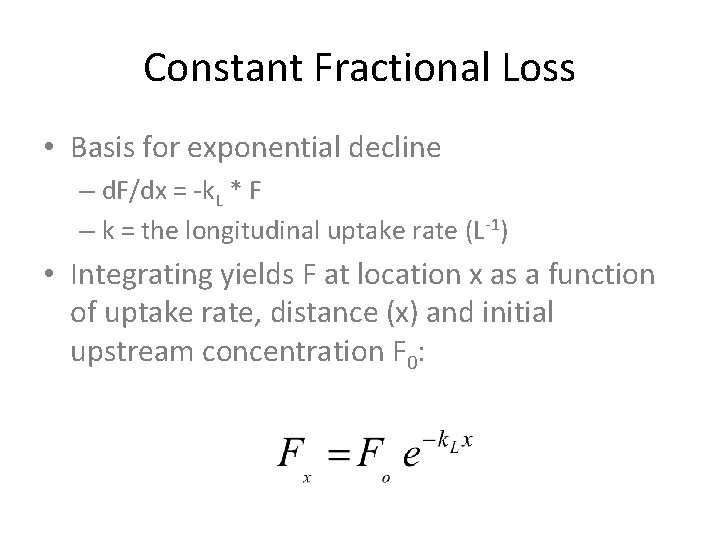
Constant Fractional Loss • Basis for exponential decline – d. F/dx = -k. L * F – k = the longitudinal uptake rate (L-1) • Integrating yields F at location x as a function of uptake rate, distance (x) and initial upstream concentration F 0:
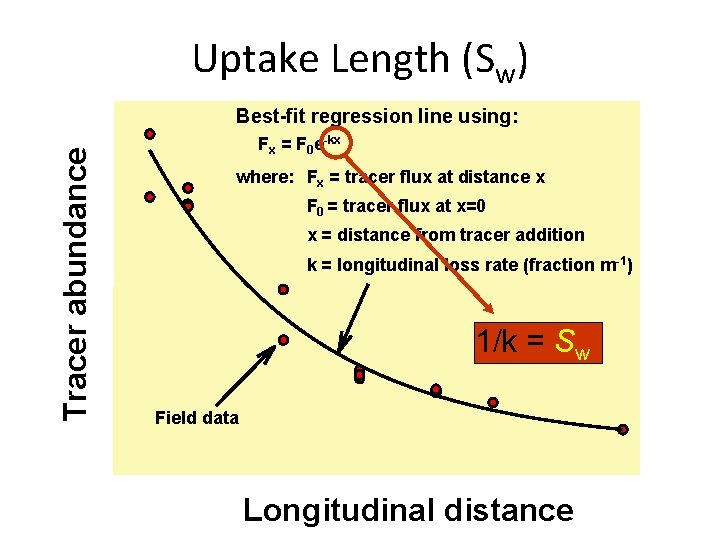
Uptake Length (Sw) Tracer abundance Best-fit regression line using: Fx = F 0 e-kx where: Fx = tracer flux at distance x F 0 = tracer flux at x=0 x = distance from tracer addition k = longitudinal loss rate (fraction m-1) 1/k = S w w Field data Longitudinal distance
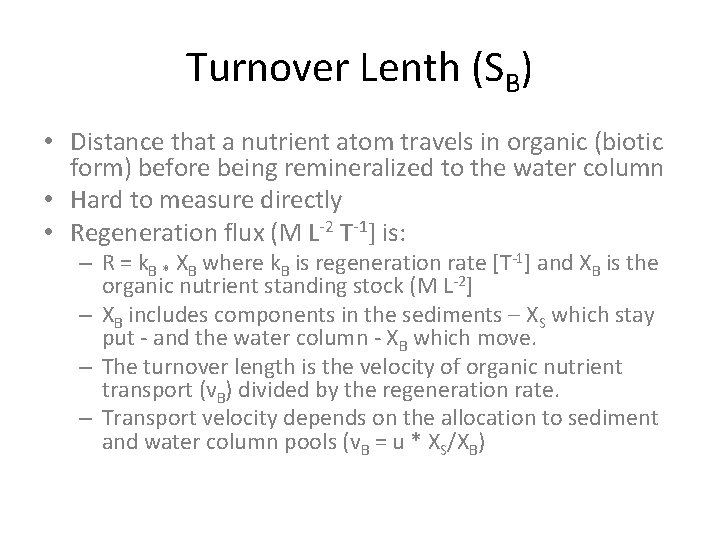
Turnover Lenth (SB) • Distance that a nutrient atom travels in organic (biotic form) before being remineralized to the water column • Hard to measure directly • Regeneration flux (M L-2 T-1] is: – R = k. B * XB where k. B is regeneration rate [T-1] and XB is the organic nutrient standing stock (M L-2] – XB includes components in the sediments – XS which stay put - and the water column - XB which move. – The turnover length is the velocity of organic nutrient transport (v. B) divided by the regeneration rate. – Transport velocity depends on the allocation to sediment and water column pools (v. B = u * XS/XB)
Spiral Length in Headwater Streams (dominated by uptake length) Uptake length (Sw) Advective flow Time Turnover length (So) Longitudinal distance
Open Controversy • Headwater systems have short uptake lengths – Direct (1 st) contact with mineral nutrients – Shallow depths • Alexander et al. (2000), Peterson et al. (2001) – Large rivers have much longer uptake lengths (therefore no net N removal) • Wollheim et al. (2006) – Uptake length doesn’t measure removal, it measures spiral length – Uptake rates per unit area may be more informative when the question is “where does nutrient removal occur within river networks” – Most of the benthic area and most of the residence time in river networks is in LARGE rivers
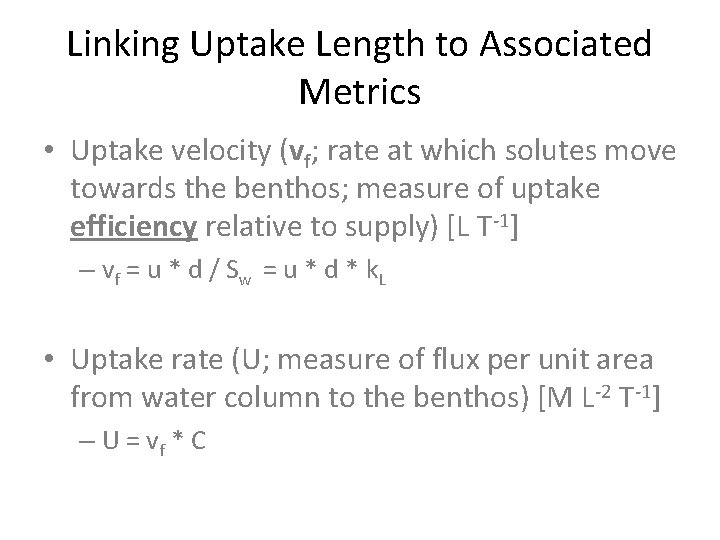
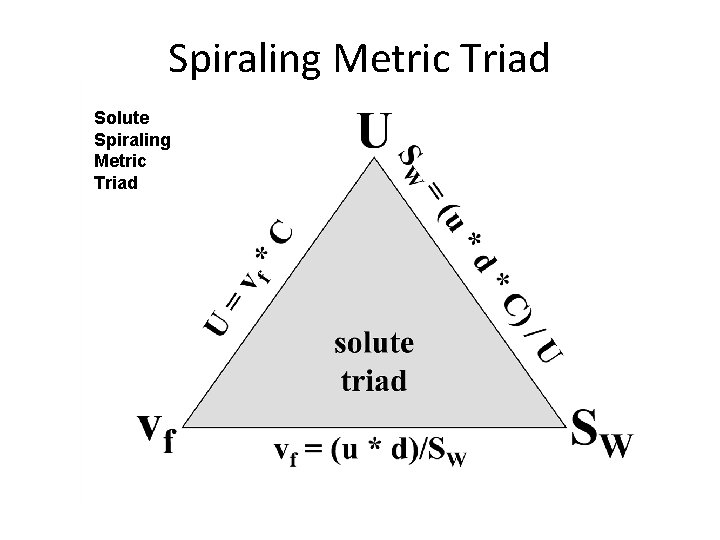
Linking Uptake Length to Associated Metrics • Uptake velocity (vf; rate at which solutes move towards the benthos; measure of uptake efficiency relative to supply) [L T-1] – vf = u * d / S w = u * d * k L • Uptake rate (U; measure of flux per unit area from water column to the benthos) [M L-2 T-1] – U = vf * C
Spiraling Metric Triad Solute Spiraling Metric Triad
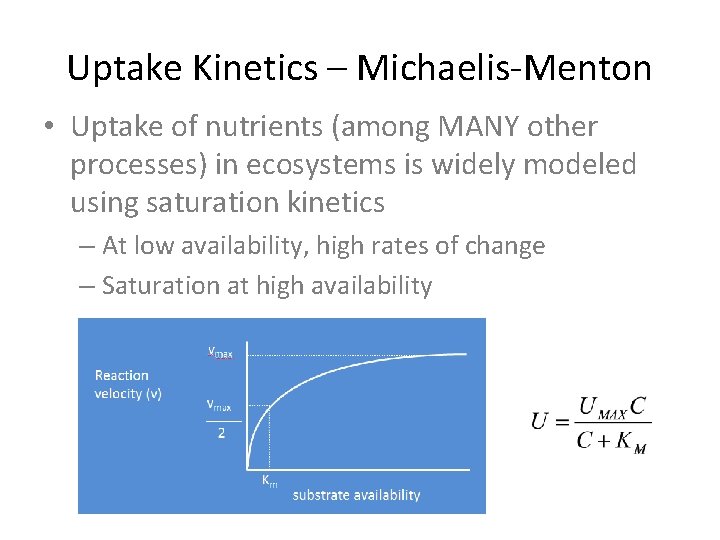
Uptake Kinetics – Michaelis-Menton • Uptake of nutrients (among MANY other processes) in ecosystems is widely modeled using saturation kinetics – At low availability, high rates of change – Saturation at high availability
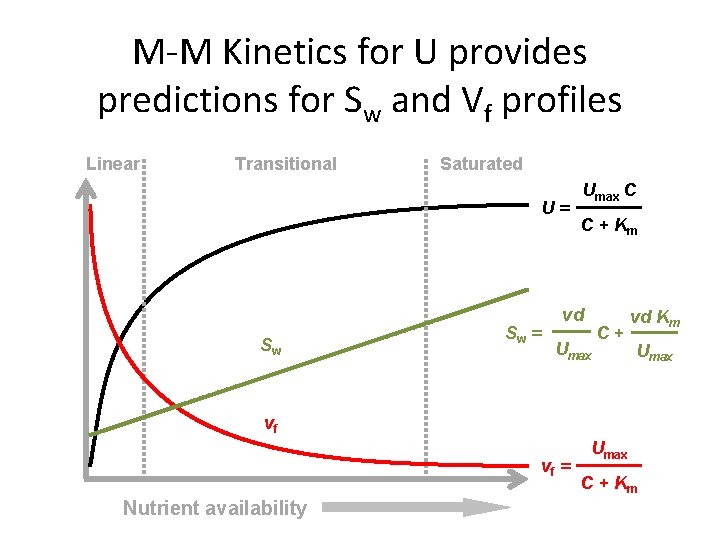
M-M Kinetics for U provides predictions for Sw and Vf profiles Linear Transitional Saturated U= U Sw Sw = Umax C C + Km vd Umax C+ vd Km Umax vf vf = Nutrient availability Umax C + Km
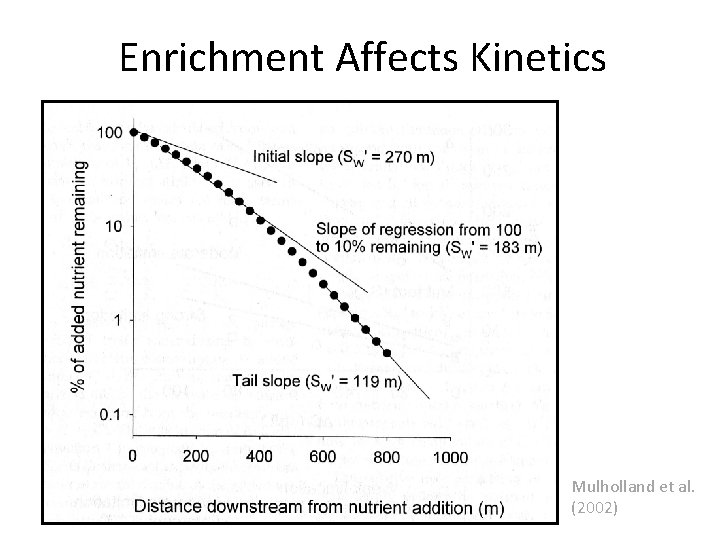
How Do We Measure Uptake Length? • Add nutrients – Since nutrients are spiraling (i. e. , no longitudinal change in concentration), we need to disequilibrate the system to see the spiraling curve • Adding nutrients changes availability • Changes in availability affects uptake kinetics • Ergo – adding nutrients (changing the concentration) changes the thing we’re trying to measure
Enrichment Affects Kinetics Mulholland et al. (2002)
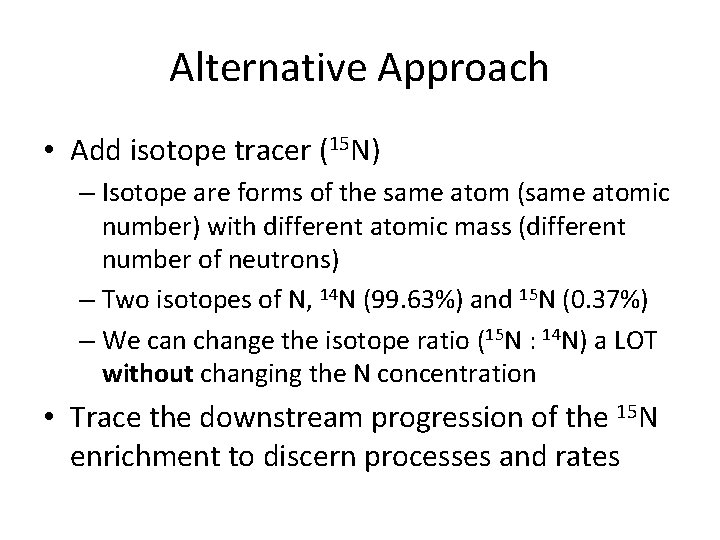
Alternative Approach • Add isotope tracer (15 N) – Isotope are forms of the same atom (same atomic number) with different atomic mass (different number of neutrons) – Two isotopes of N, 14 N (99. 63%) and 15 N (0. 37%) – We can change the isotope ratio (15 N : 14 N) a LOT without changing the N concentration • Trace the downstream progression of the 15 N enrichment to discern processes and rates
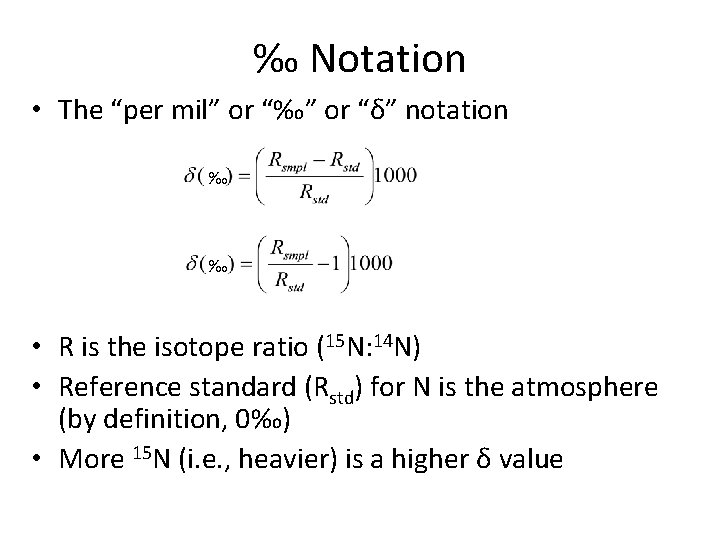
‰ Notation • The “per mil” or “‰” or “δ” notation ‰ ‰ • R is the isotope ratio (15 N: 14 N) • Reference standard (Rstd) for N is the atmosphere (by definition, 0‰) • More 15 N (i. e. , heavier) is a higher δ value
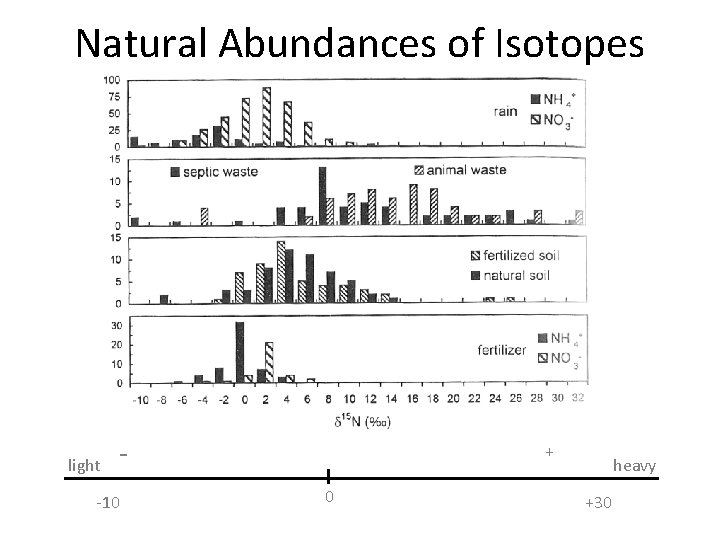
Natural Abundances of Isotopes light - -10 + 0 heavy +30
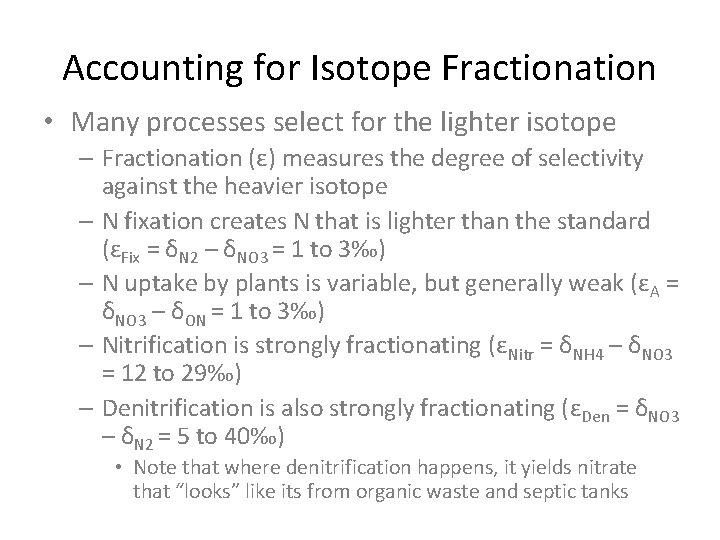
Accounting for Isotope Fractionation • Many processes select for the lighter isotope – Fractionation (ε) measures the degree of selectivity against the heavier isotope – N fixation creates N that is lighter than the standard (εFix = δN 2 – δNO 3 = 1 to 3‰) – N uptake by plants is variable, but generally weak (εA = δNO 3 – δON = 1 to 3‰) – Nitrification is strongly fractionating (εNitr = δNH 4 – δNO 3 = 12 to 29‰) – Denitrification is also strongly fractionating (εDen = δNO 3 – δN 2 = 5 to 40‰) • Note that where denitrification happens, it yields nitrate that “looks” like its from organic waste and septic tanks
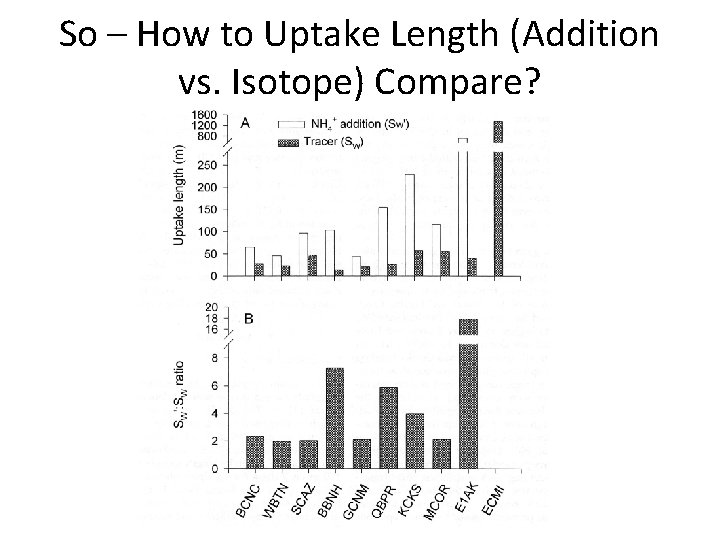
So – How to Uptake Length (Addition vs. Isotope) Compare?
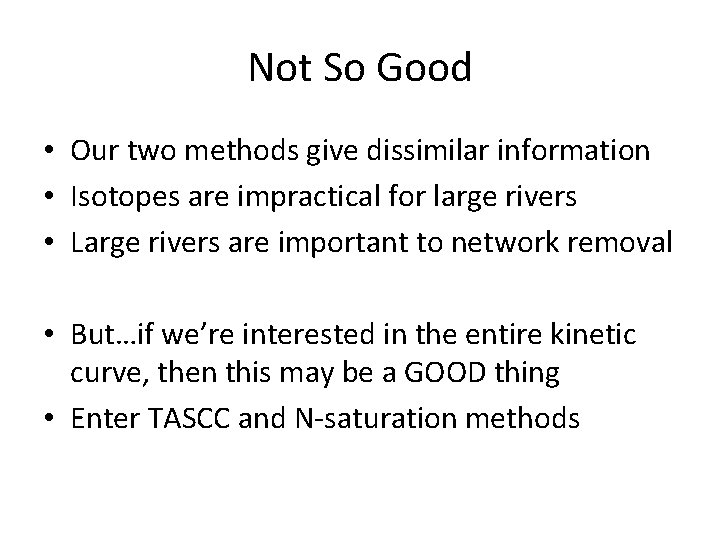
Not So Good • Our two methods give dissimilar information • Isotopes are impractical for large rivers • Large rivers are important to network removal • But…if we’re interested in the entire kinetic curve, then this may be a GOOD thing • Enter TASCC and N-saturation methods
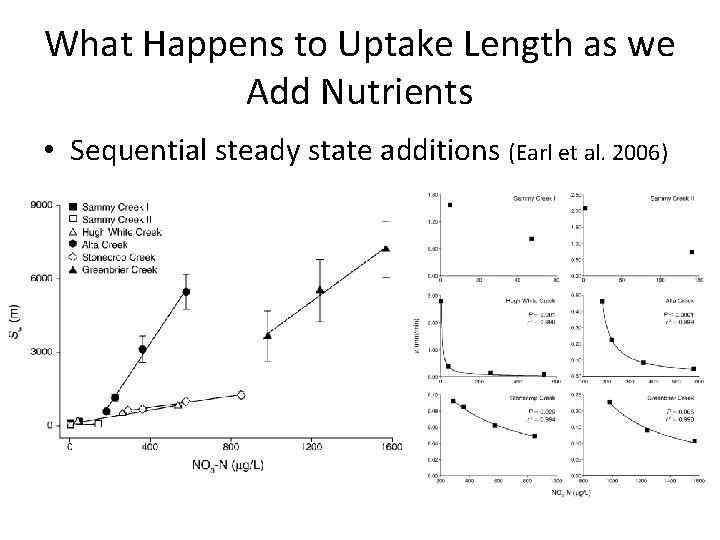
What Happens to Uptake Length as we Add Nutrients • Sequential steady state additions (Earl et al. 2006)
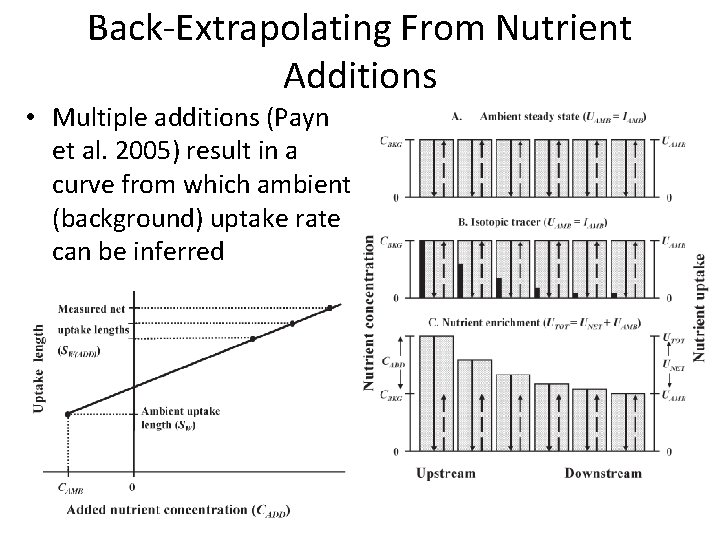
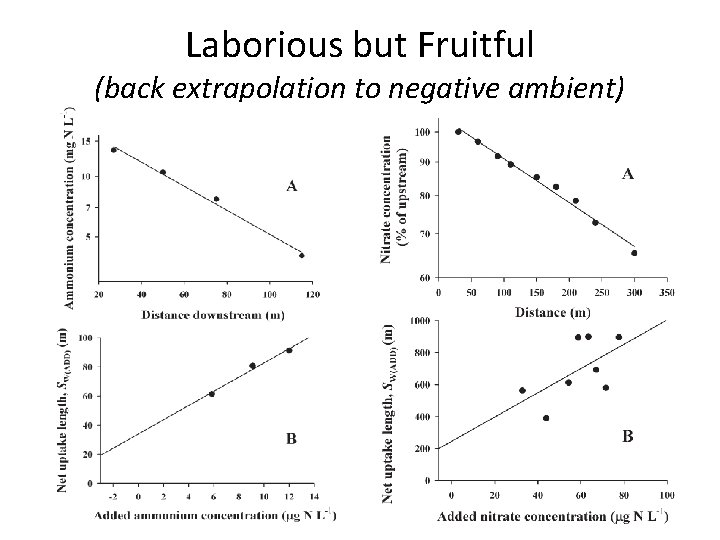
Back-Extrapolating From Nutrient Additions • Multiple additions (Payn et al. 2005) result in a curve from which ambient (background) uptake rate can be inferred
Laborious but Fruitful (back extrapolation to negative ambient)
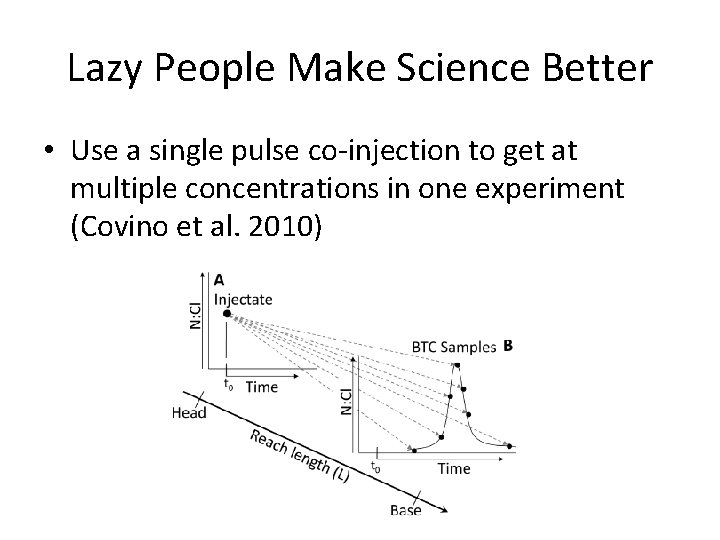
Lazy People Make Science Better • Use a single pulse co-injection to get at multiple concentrations in one experiment (Covino et al. 2010)
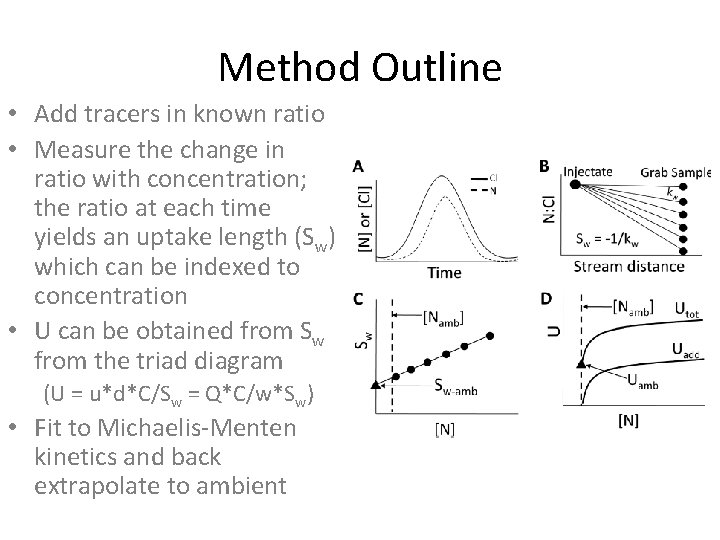
Method Outline • Add tracers in known ratio • Measure the change in ratio with concentration; the ratio at each time yields an uptake length (Sw) which can be indexed to concentration • U can be obtained from Sw from the triad diagram (U = u*d*C/Sw = Q*C/w*Sw) • Fit to Michaelis-Menten kinetics and back extrapolate to ambient
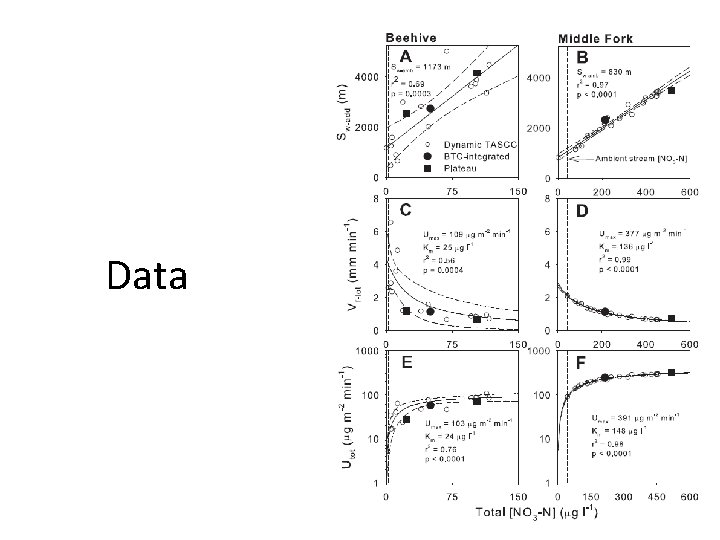
Data
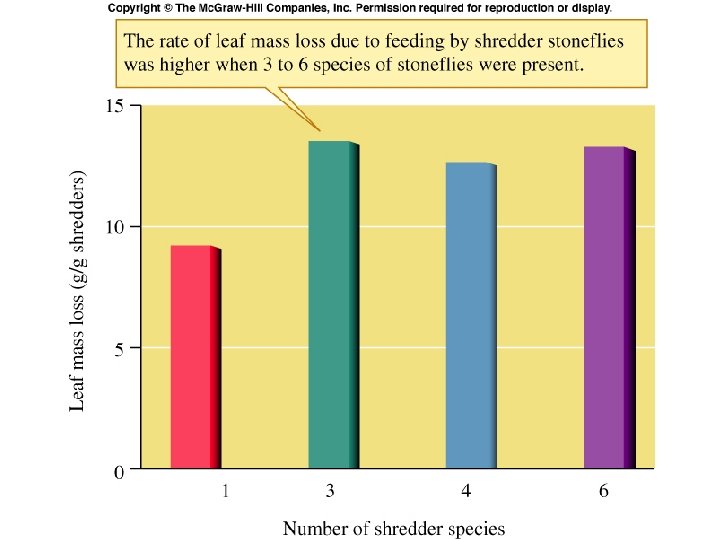
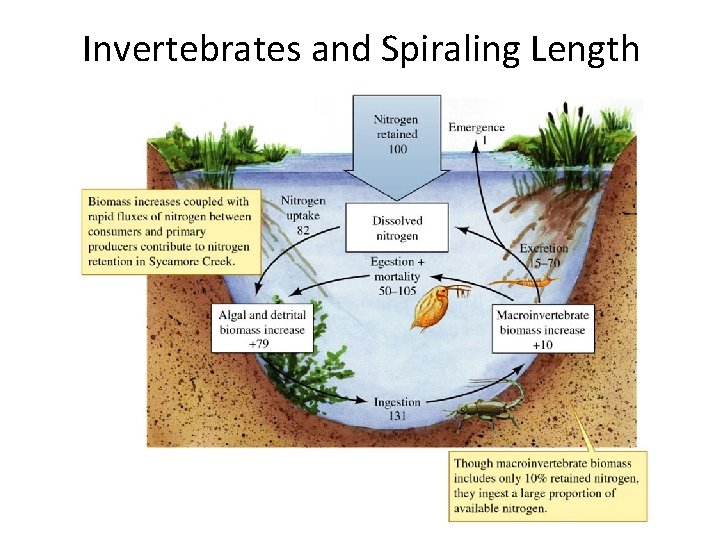
Stream Biota and Spiraling Length • Several studies have shown that aquatic invertebrates can significantly increase N cycling. – Suggested rapid recycling of N by macroinvertebrates may increase primary production. • Excreted and recycled 15 -70% of nitrogen pool as ammonia. • Stream ecosystem organization creates short spirals for scarce elements – In a “pure” limitation, uptake length goes to zero and all downstream transport occurs via organic particles • CONCENTRATION GOES TO ZERO @ LIMITATION – Any biota that accelerate remineralization (e. g. , shorten turnover length) amplify productivity – Invertebrates accelerate remineralization
19_16. jpg
Invertebrates and Spiraling Length
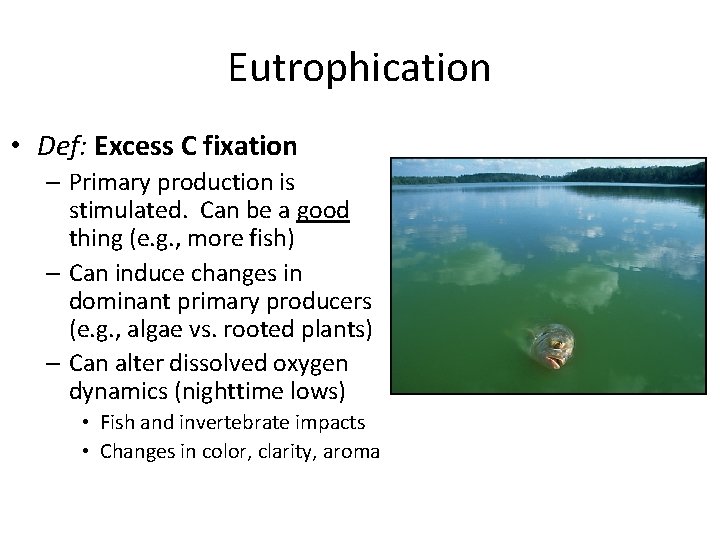
Eutrophication • Def: Excess C fixation – Primary production is stimulated. Can be a good thing (e. g. , more fish) – Can induce changes in dominant primary producers (e. g. , algae vs. rooted plants) – Can alter dissolved oxygen dynamics (nighttime lows) • Fish and invertebrate impacts • Changes in color, clarity, aroma
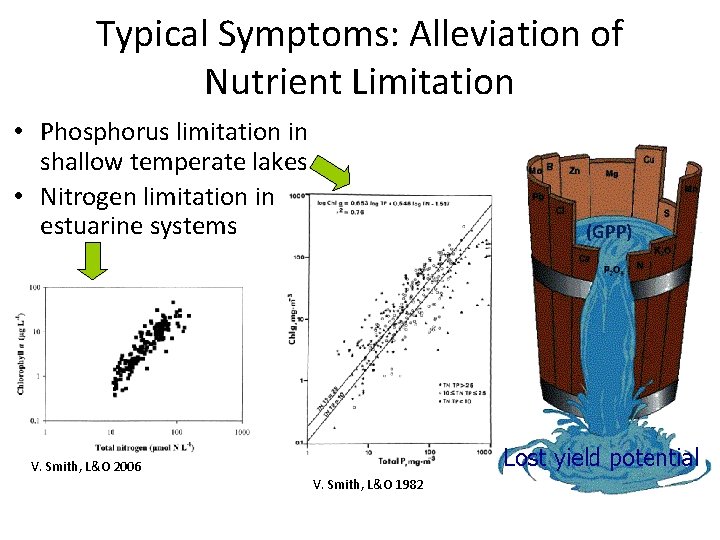
Typical Symptoms: Alleviation of Nutrient Limitation • Phosphorus limitation in shallow temperate lakes • Nitrogen limitation in estuarine systems (GPP) V. Smith, L&O 2006 V. Smith, L&O 1982
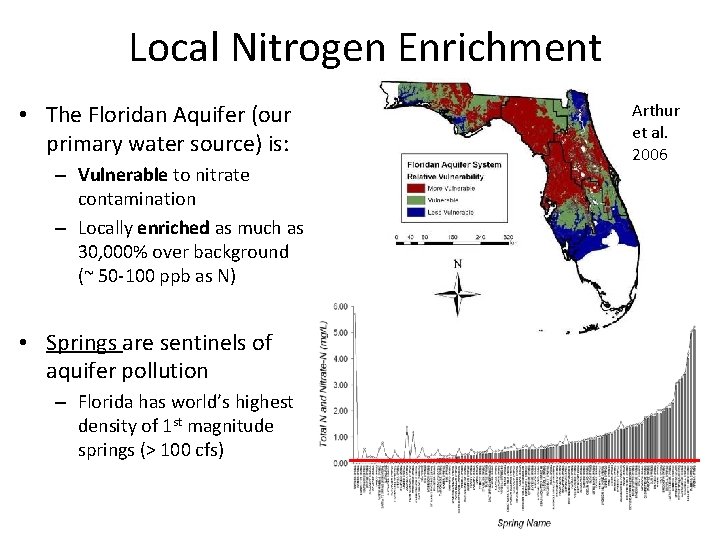
Local Nitrogen Enrichment • The Floridan Aquifer (our primary water source) is: – Vulnerable to nitrate contamination – Locally enriched as much as 30, 000% over background (~ 50 -100 ppb as N) • Springs are sentinels of aquifer pollution – Florida has world’s highest density of 1 st magnitude springs (> 100 cfs) Arthur et al. 2006
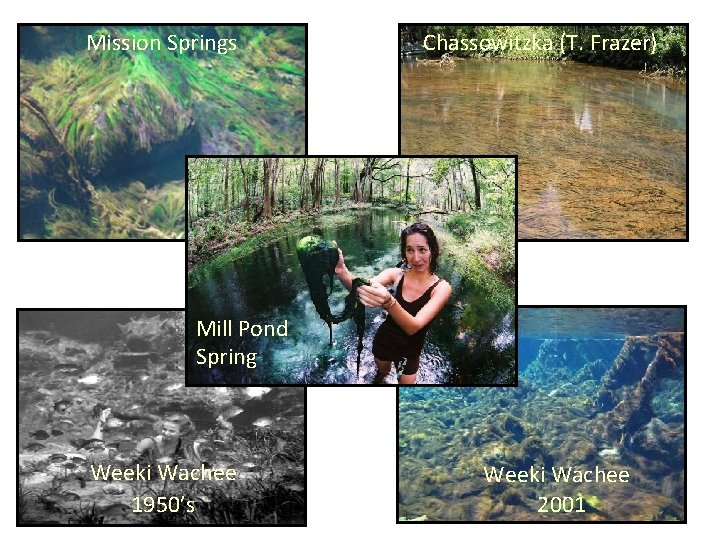
Mission Springs Chassowitzka (T. Frazer) Mill Pond Spring Weeki Wachee 1950’s Weeki Wachee 2001
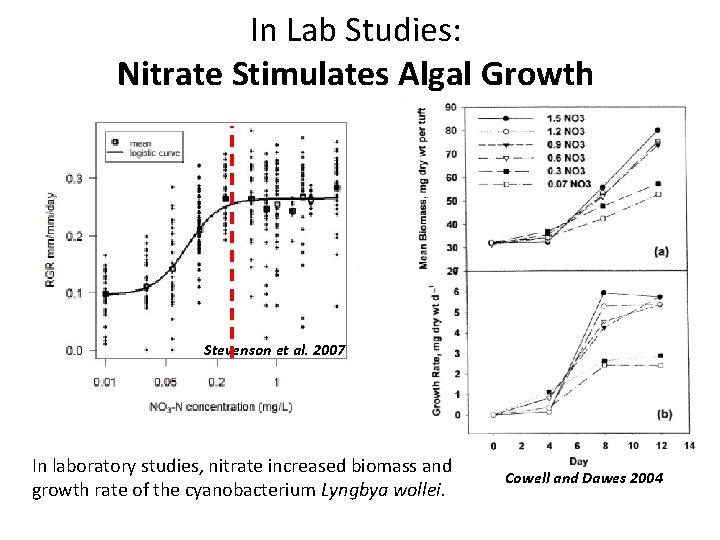
In Lab Studies: Nitrate Stimulates Algal Growth Stevenson et al. 2007 In laboratory studies, nitrate increased biomass and growth rate of the cyanobacterium Lyngbya wollei. Cowell and Dawes 2004
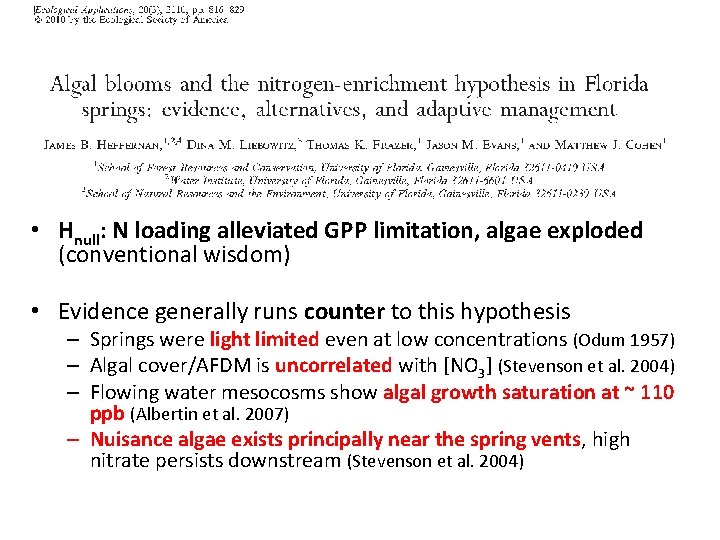
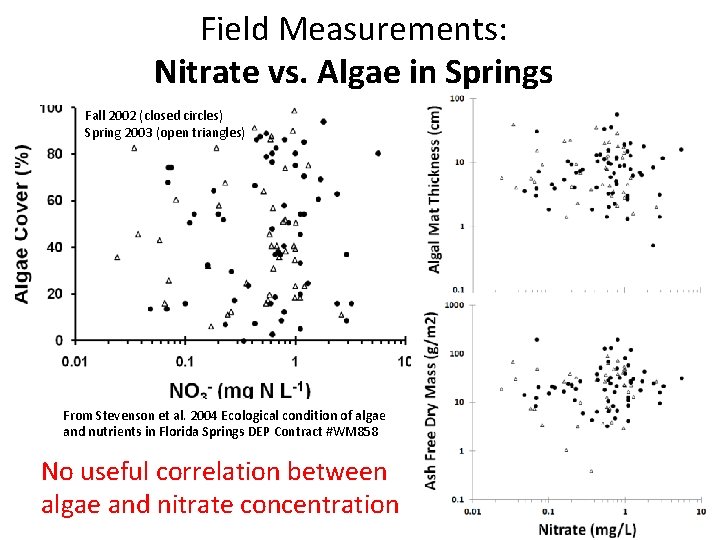
• Hnull: N loading alleviated GPP limitation, algae exploded (conventional wisdom) • Evidence generally runs counter to this hypothesis – Springs were light limited even at low concentrations (Odum 1957) – Algal cover/AFDM is uncorrelated with [NO 3] (Stevenson et al. 2004) – Flowing water mesocosms show algal growth saturation at ~ 110 ppb (Albertin et al. 2007) – Nuisance algae exists principally near the spring vents, high nitrate persists downstream (Stevenson et al. 2004)
Field Measurements: Nitrate vs. Algae in Springs Fall 2002 (closed circles) Spring 2003 (open triangles) From Stevenson et al. 2004 Ecological condition of algae and nutrients in Florida Springs DEP Contract #WM 858 No useful correlation between algae and nitrate concentration
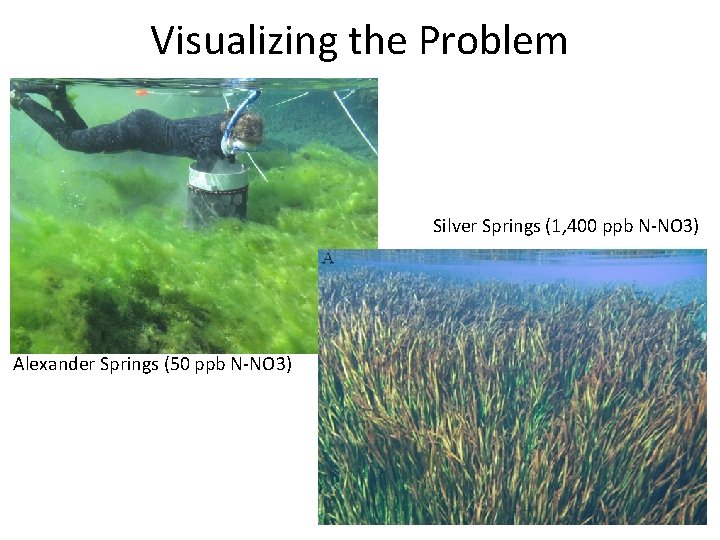
Visualizing the Problem Silver Springs (1, 400 ppb N-NO 3) Alexander Springs (50 ppb N-NO 3)
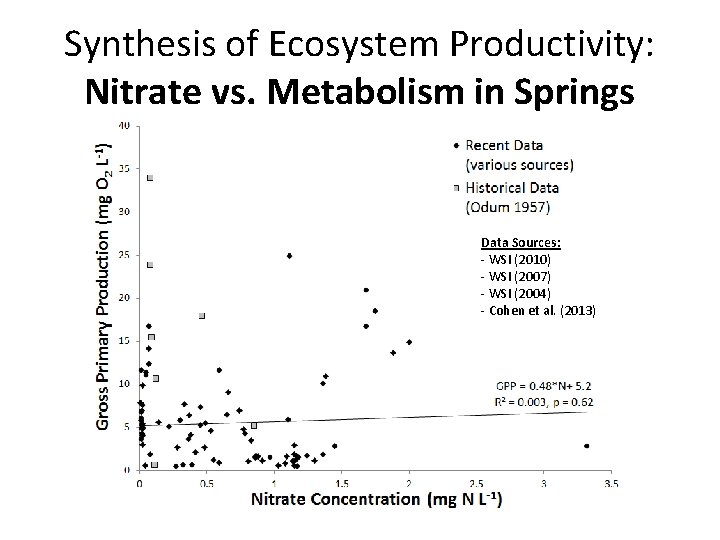
Synthesis of Ecosystem Productivity: Nitrate vs. Metabolism in Springs Data Sources: - WSI (2010) - WSI (2007) - WSI (2004) - Cohen et al. (2013)
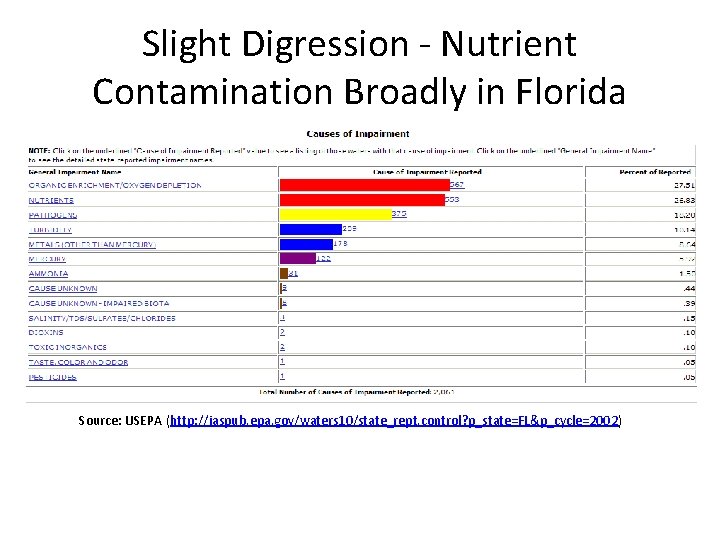
Slight Digression - Nutrient Contamination Broadly in Florida Source: USEPA (http: //iaspub. epa. gov/waters 10/state_rept. control? p_state=FL&p_cycle=2002)
Recent Developments – Numeric Nutrient Criteria • Nov 14 th 2010 – EPA signed into law new rules about nutrient pollution in Florida – Nutrients will be regulated using fixed numeric thresholds rather than narrative criteria – Became effective September 2013 • Result of lawsuit against EPA by Earthjustice arguing that existing rules were under-protective – Why?
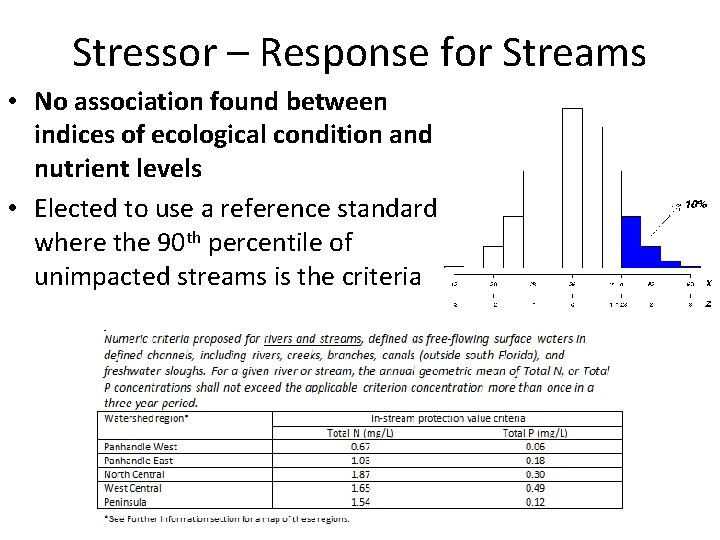
Stressor – Response for Streams • No association found between indices of ecological condition and nutrient levels • Elected to use a reference standard where the 90 th percentile of unimpacted streams is the criteria
Eutrophication in Flowing Waters? • Why no clear biological effect of enrichment in lotic systems? – What is ecosystem N demand? – How does this compare with supply (flux)? – What does this say about limitation? • Is concentration a good metric of response in lotic systems? – In lakes/estuaries, diffusion matters. – In streams, advection continually resupplies nutrients.
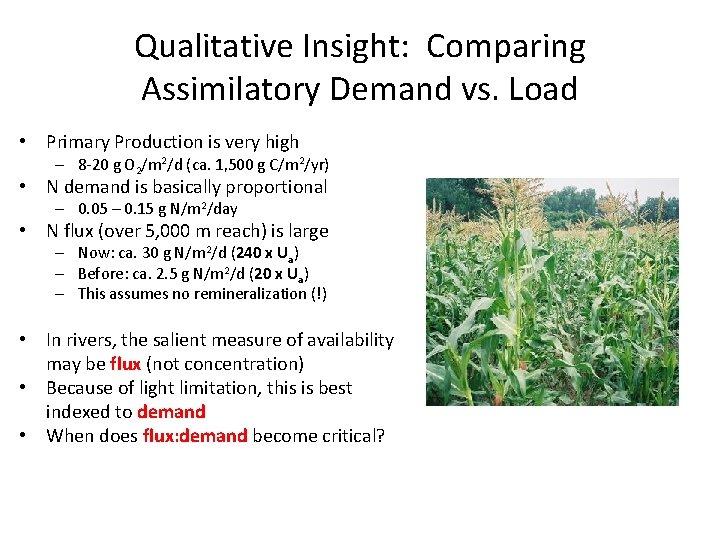
Qualitative Insight: Comparing Assimilatory Demand vs. Load • Primary Production is very high – 8 -20 g O 2/m 2/d (ca. 1, 500 g C/m 2/yr) • N demand is basically proportional – 0. 05 – 0. 15 g N/m 2/day • N flux (over 5, 000 m reach) is large – Now: ca. 30 g N/m 2/d (240 x Ua) – Before: ca. 2. 5 g N/m 2/d (20 x Ua) – This assumes no remineralization (!) • In rivers, the salient measure of availability may be flux (not concentration) • Because of light limitation, this is best indexed to demand • When does flux: demand become critical?
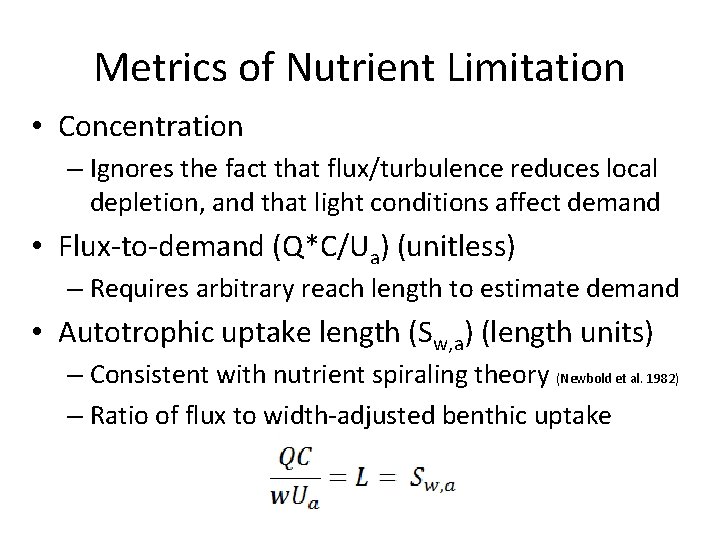
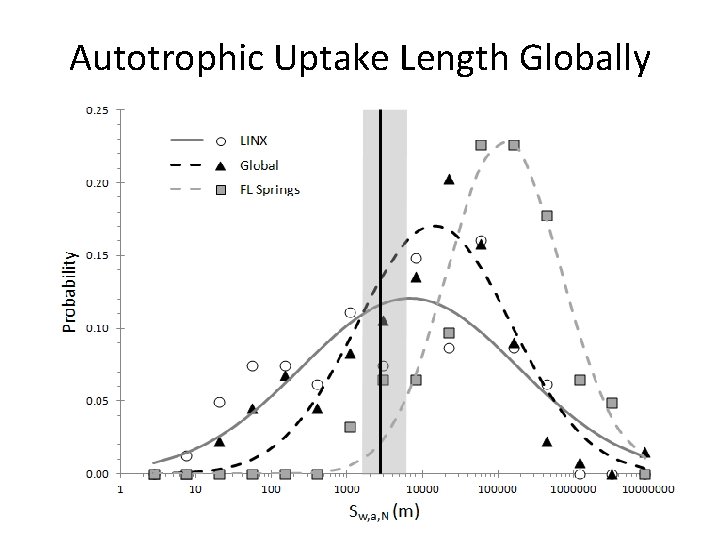
Metrics of Nutrient Limitation • Concentration – Ignores the fact that flux/turbulence reduces local depletion, and that light conditions affect demand • Flux-to-demand (Q*C/Ua) (unitless) – Requires arbitrary reach length to estimate demand • Autotrophic uptake length (Sw, a) (length units) – Consistent with nutrient spiraling theory (Newbold et al. 1982) – Ratio of flux to width-adjusted benthic uptake
Autotrophic Uptake Length • Mean length (downstream) a molecule of mineral nutrient travels before a plant uses it – Not dissimilatory use, which typically dominates • Shorter lengths imply greater limitation • For N: Sw, a, N • For P: Sw, a, P
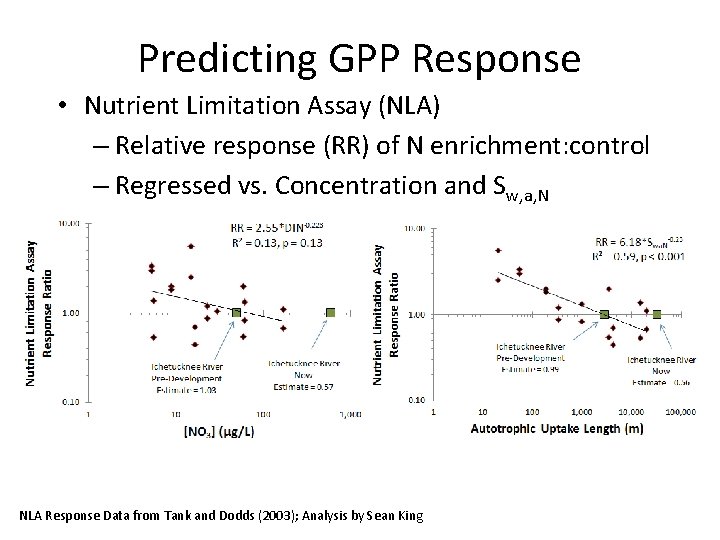
Predicting GPP Response • Nutrient Limitation Assay (NLA) – Relative response (RR) of N enrichment: control – Regressed vs. Concentration and Sw, a, N NLA Response Data from Tank and Dodds (2003); Analysis by Sean King
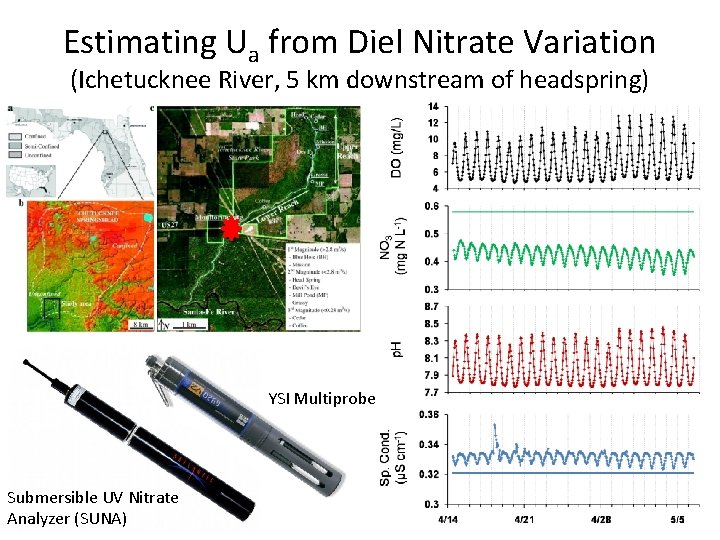
Estimating Ua from Diel Nitrate Variation (Ichetucknee River, 5 km downstream of headspring) YSI Multiprobe Submersible UV Nitrate Analyzer (SUNA)
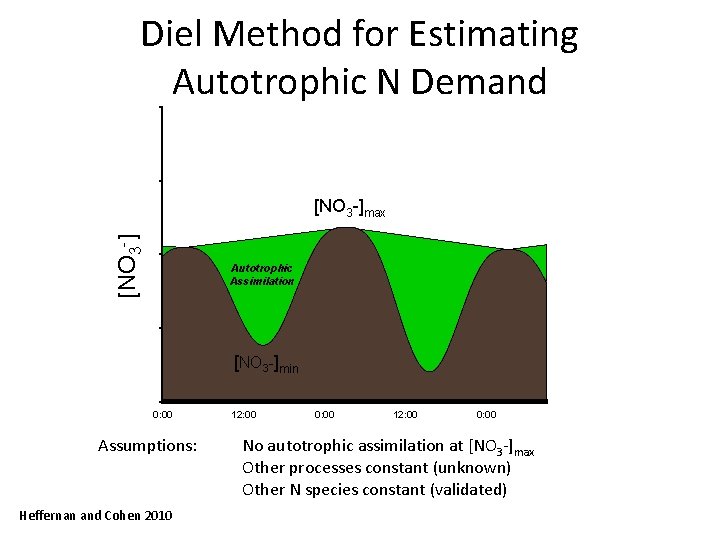
Diel Method for Estimating Autotrophic N Demand [NO 3 -]max Autotrophic Assimilation [NO 3 -]min 0: 00 Assumptions: Heffernan and Cohen 2010 12: 00 0: 00 No autotrophic assimilation at [NO 3 -]max Other processes constant (unknown) Other N species constant (validated)
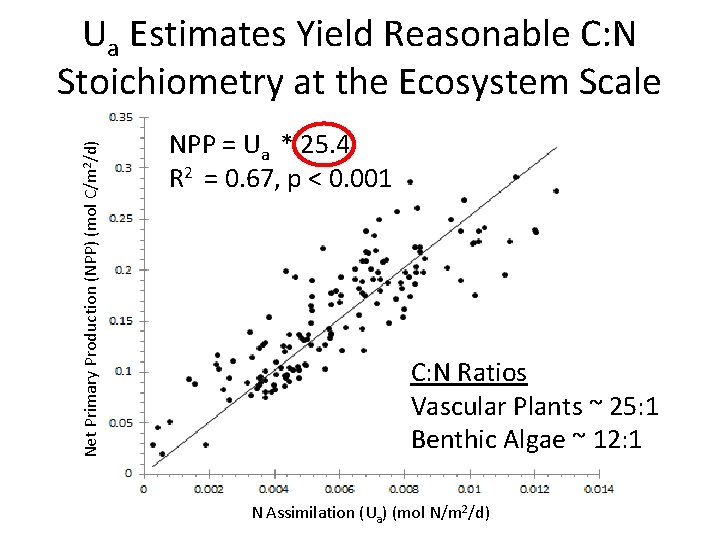
Net Primary Production (NPP) (mol C/m 2/d) Ua Estimates Yield Reasonable C: N Stoichiometry at the Ecosystem Scale NPP = Ua * 25. 4 R 2 = 0. 67, p < 0. 001 C: N Ratios Vascular Plants ~ 25: 1 Benthic Algae ~ 12: 1 N Assimilation (Ua) (mol N/m 2/d)
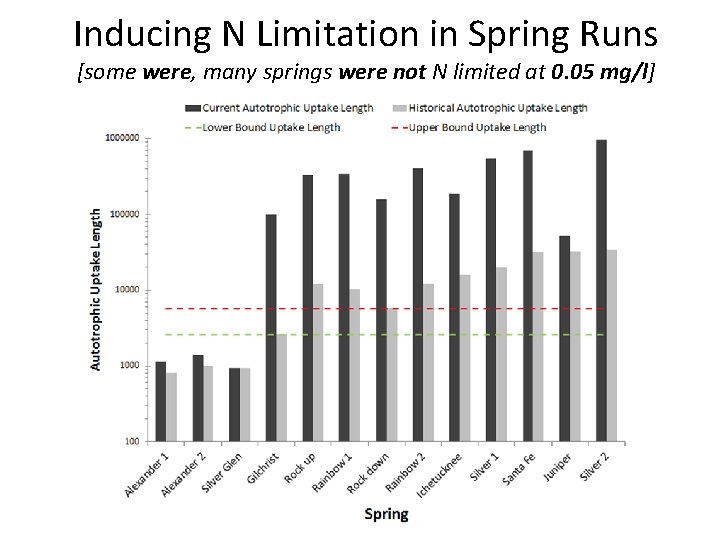
Inducing N Limitation in Spring Runs [some were, many springs were not N limited at 0. 05 mg/l]
Autotrophic Uptake Length Globally
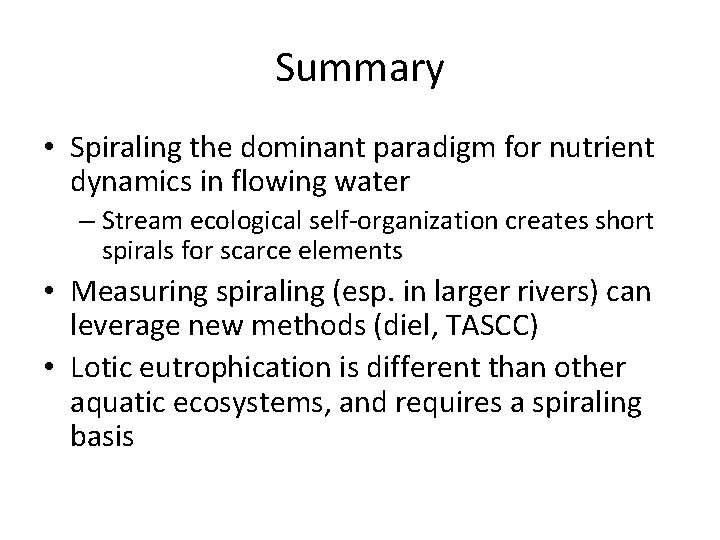
Summary • Spiraling the dominant paradigm for nutrient dynamics in flowing water – Stream ecological self-organization creates short spirals for scarce elements • Measuring spiraling (esp. in larger rivers) can leverage new methods (diel, TASCC) • Lotic eutrophication is different than other aquatic ecosystems, and requires a spiraling basis
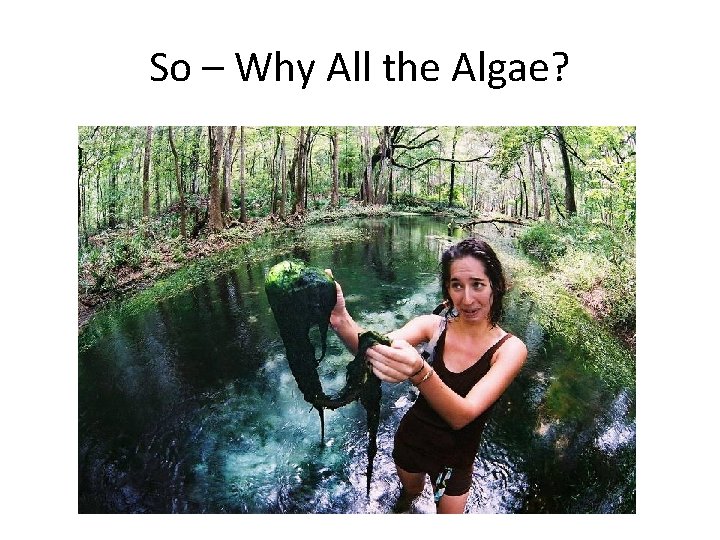
So – Why All the Algae?
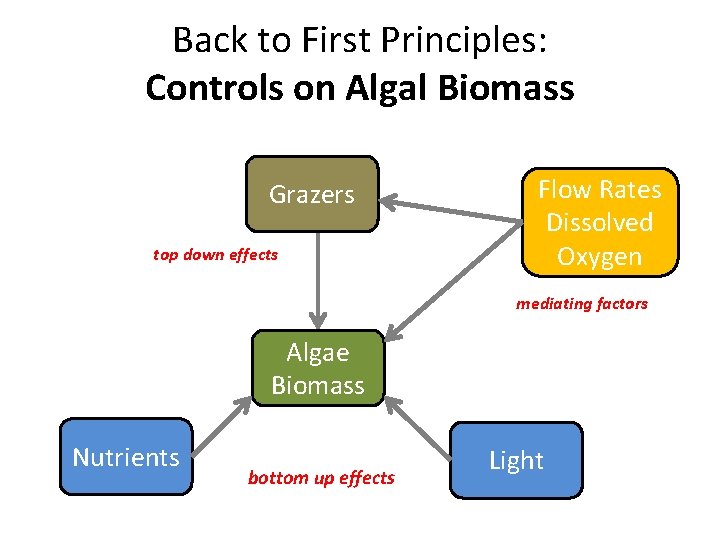
Back to First Principles: Controls on Algal Biomass Grazers top down effects Flow Rates Dissolved Oxygen mediating factors Algae Biomass Nutrients bottom up effects Light
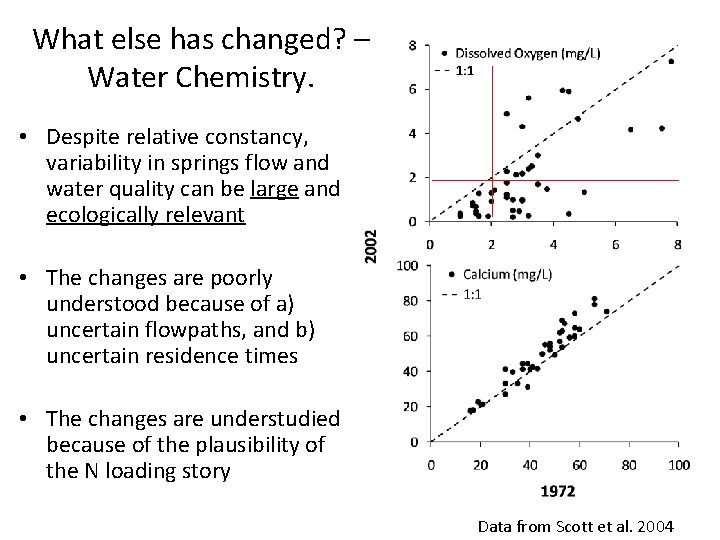
What else has changed? – Water Chemistry. • Despite relative constancy, variability in springs flow and water quality can be large and ecologically relevant • The changes are poorly understood because of a) uncertain flowpaths, and b) uncertain residence times • The changes are understudied because of the plausibility of the N loading story Data from Scott et al. 2004
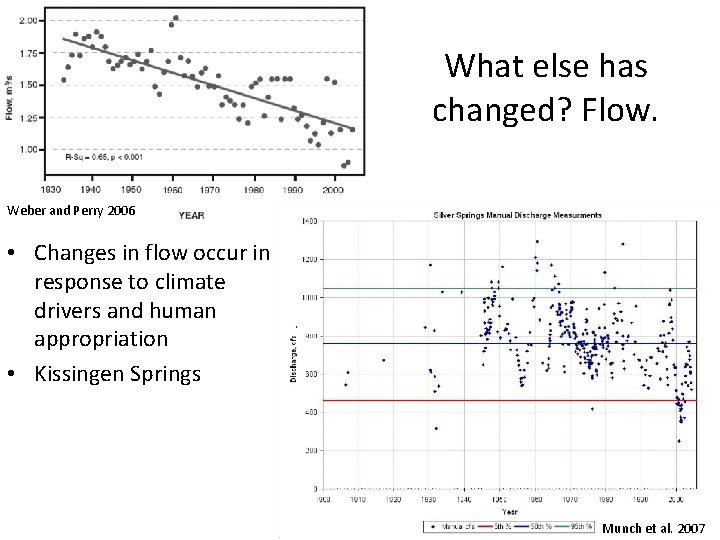
What else has changed? Flow. Weber and Perry 2006 • Changes in flow occur in response to climate drivers and human appropriation • Kissingen Springs Munch et al. 2007
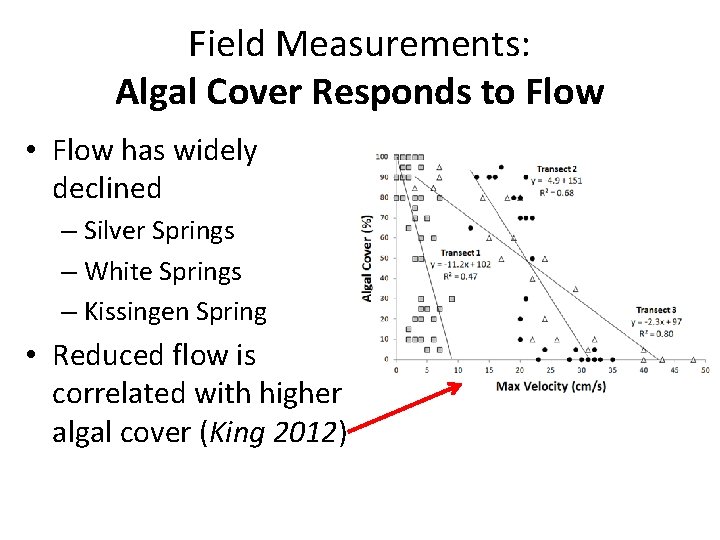
Field Measurements: Algal Cover Responds to Flow • Flow has widely declined – Silver Springs – White Springs – Kissingen Spring • Reduced flow is correlated with higher algal cover (King 2012)
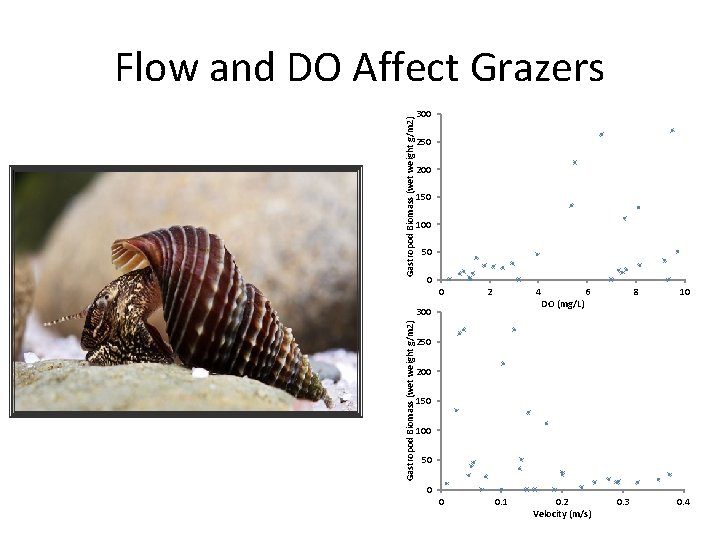
Gastropod Biomass (wet weight g/m 2) Flow and DO Affect Grazers 300 250 200 150 100 50 0 0 2 4 Gastropod Biomass (wet weight g/m 2) 300 DO (mg/L) 6 8 10 250 200 150 100 50 0 0 0. 1 0. 2 Velocity (m/s) 0. 3 0. 4
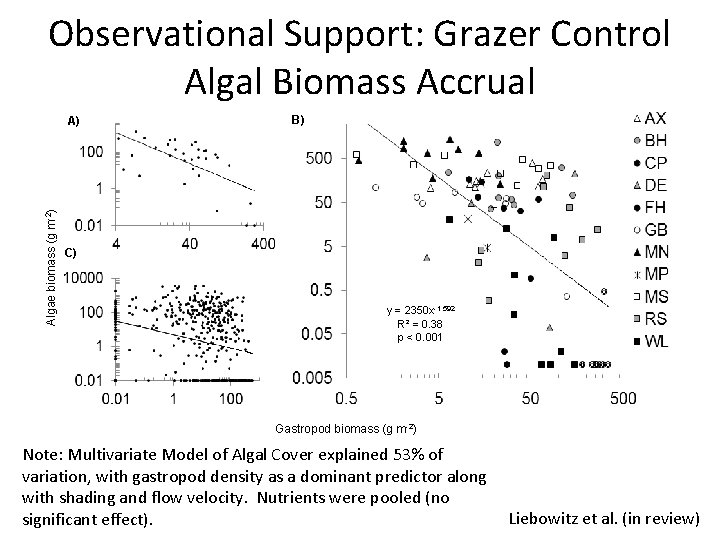
Observational Support: Grazer Control Algal Biomass Accrual Algae biomass (g m-2) A) B) C) y = 2350 x-1. 592 R² = 0. 38 p < 0. 001 Gastropod biomass (g m-2) Note: Multivariate Model of Algal Cover explained 53% of variation, with gastropod density as a dominant predictor along with shading and flow velocity. Nutrients were pooled (no significant effect). Liebowitz et al. (in review)
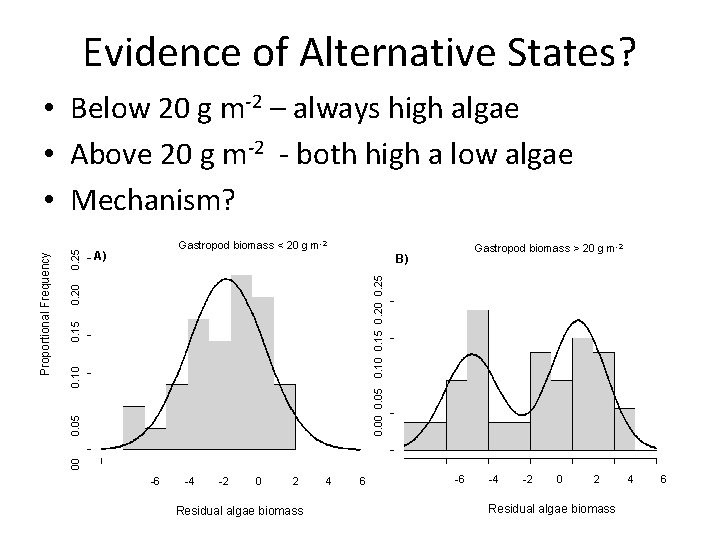
Evidence of Alternative States? A) Gastropod biomass < 20 g m-2 B) Gastropod biomass > 20 g m-2 0. 00 0. 05 0. 10 0. 15 0. 20 0. 25 0. 00 0. 05 0. 10 0. 15 0. 20 0. 25 Proportional Frequency • Below 20 g m-2 – always high algae • Above 20 g m-2 - both high a low algae • Mechanism? -6 -4 -2 0 2 4 6 Residual algae biomass -6 -4 -2 0 2 4 6 Residual algae biomass
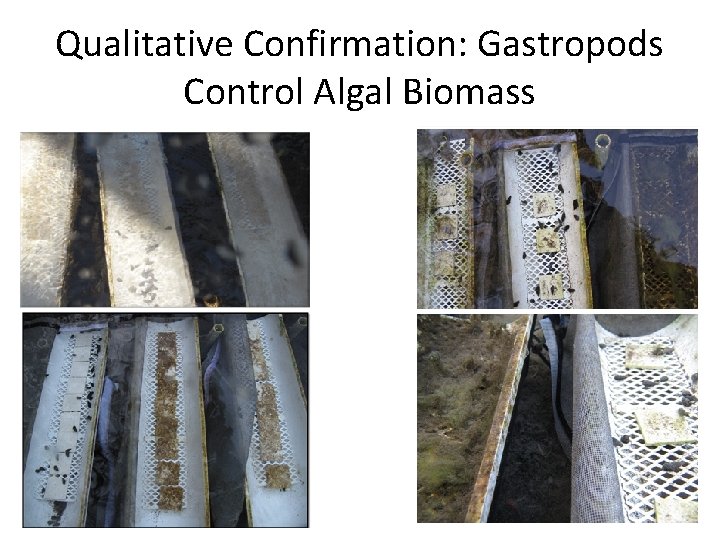
Qualitative Confirmation: Gastropods Control Algal Biomass
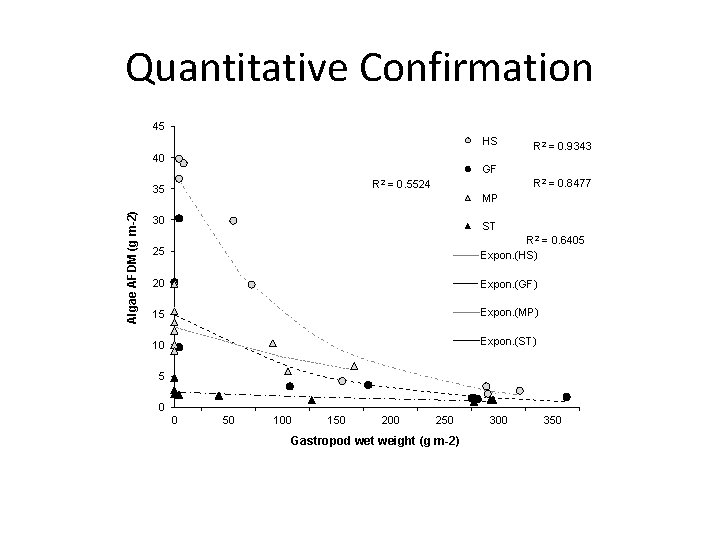
Algae AFDM (g m-2) Quantitative Confirmation Gastropod wet weight (g m-2)
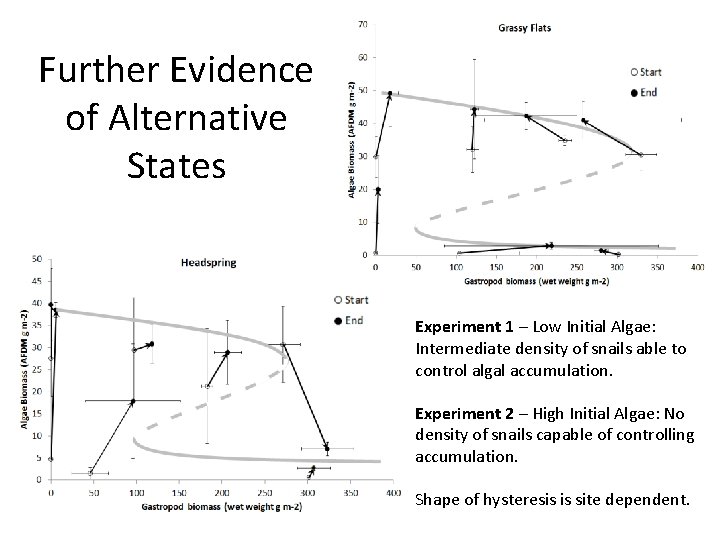
Further Evidence of Alternative States Experiment 1 – Low Initial Algae: Intermediate density of snails able to control algal accumulation. Experiment 2 – High Initial Algae: No density of snails capable of controlling accumulation. Shape of hysteresis is site dependent.
Alternative Mechanisms? Declines in animal populations that control algae [top-down effects] – Mullet excluded (90+% loss) from Silver Springs with construction of Rodman dam – ~2 orders of magnitude increase in snail density with distance downstream in Ichetucknee • Changes in flow (direct and indirect effects) – Significant declines regionally (Kissingen Springs) • Changes in human disturbance – Recreational burden is 25, 000 visitors/mo at Wekiva Springs Heffernan et al. (2010)
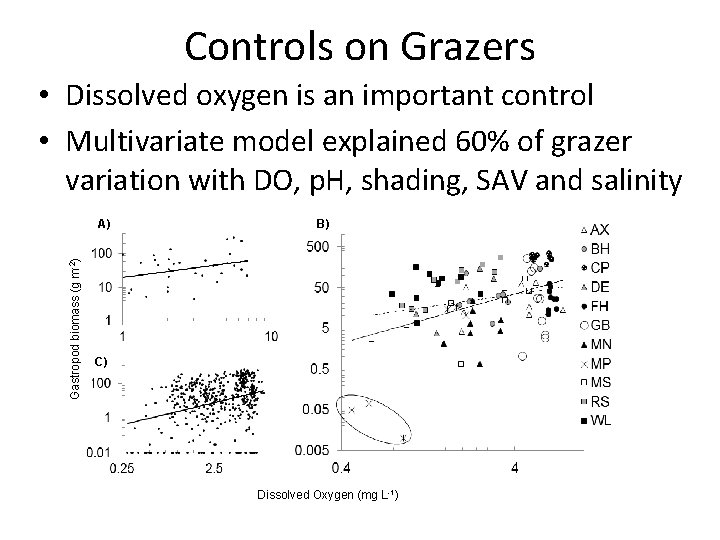
Controls on Grazers • Dissolved oxygen is an important control • Multivariate model explained 60% of grazer variation with DO, p. H, shading, SAV and salinity Gastropod biomass (g m-2) A) B) C) Dissolved Oxygen (mg L-1)
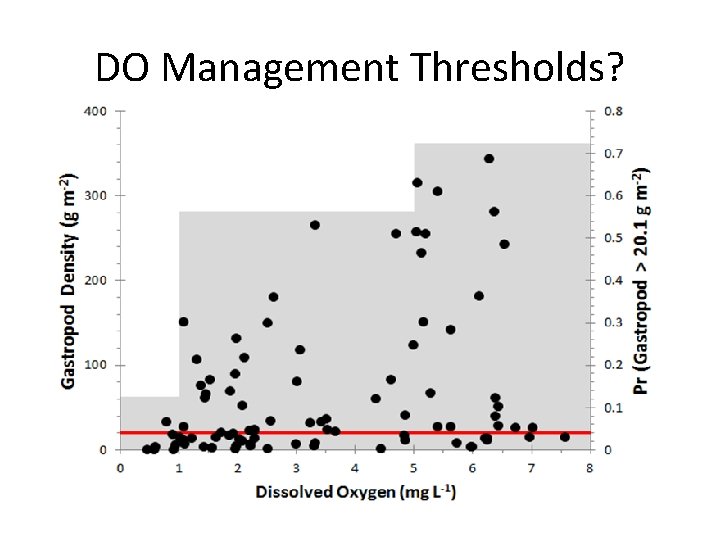
DO Management Thresholds?
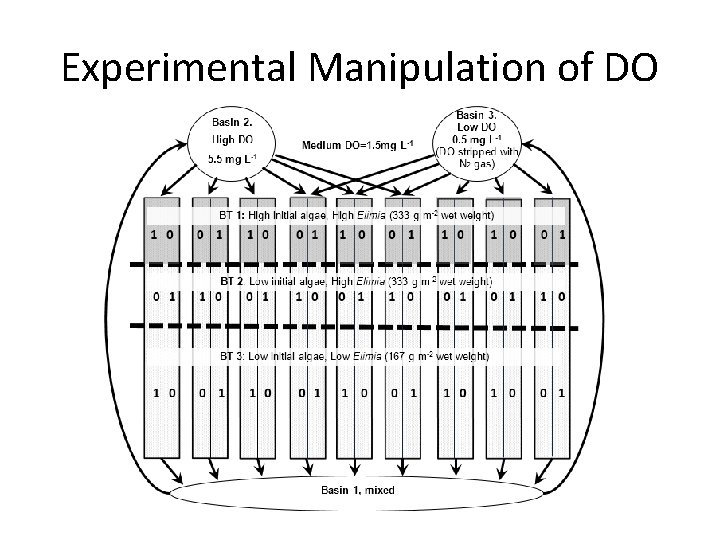
Experimental Manipulation of DO
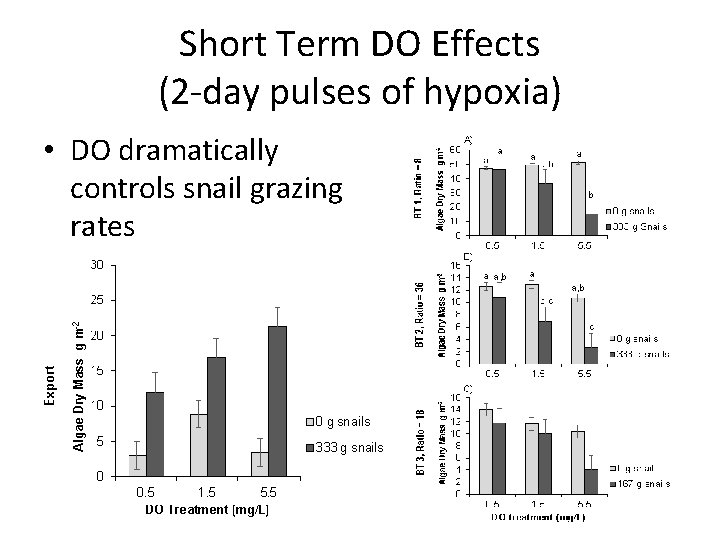
Short Term DO Effects (2 -day pulses of hypoxia) • DO dramatically controls snail grazing rates
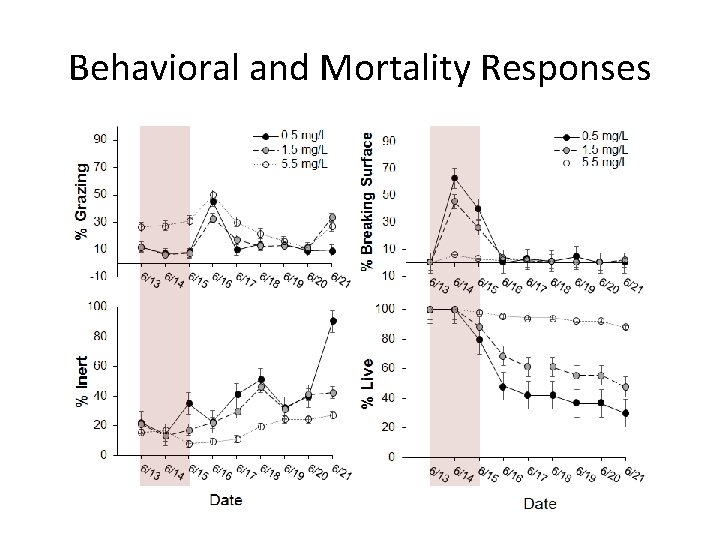
Behavioral and Mortality Responses
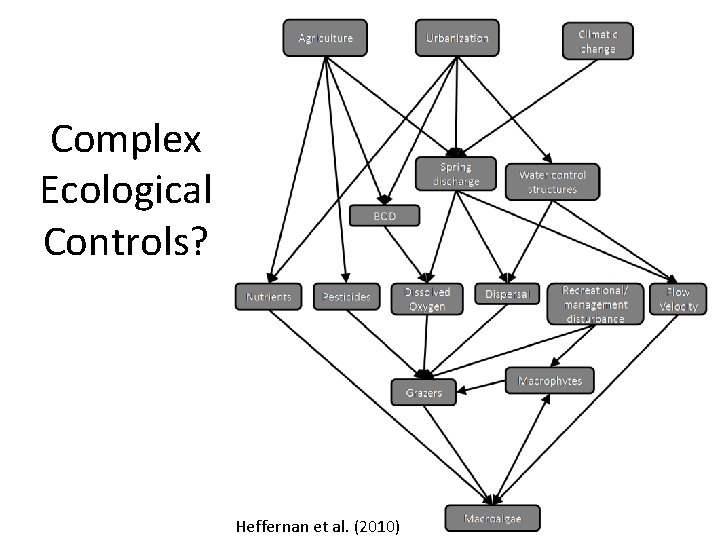
Complex Ecological Controls? Heffernan et al. (2010)
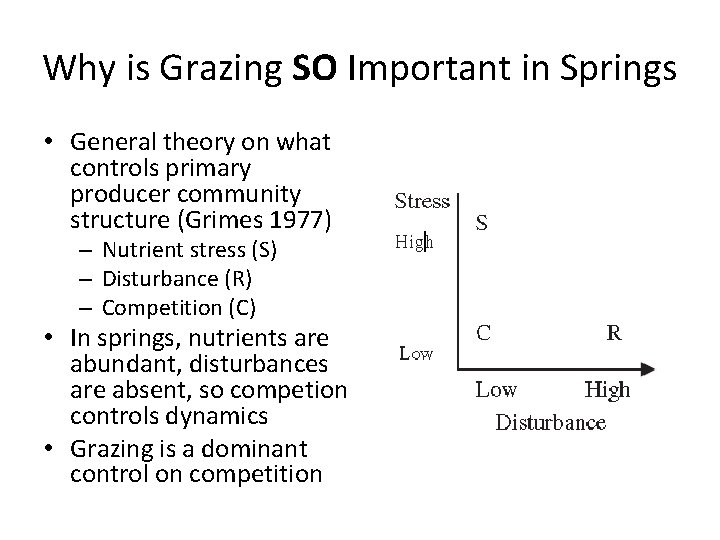
Why is Grazing SO Important in Springs • General theory on what controls primary producer community structure (Grimes 1977) – Nutrient stress (S) – Disturbance (R) – Competition (C) • In springs, nutrients are abundant, disturbances are absent, so competion controls dynamics • Grazing is a dominant control on competition