STOCK SYNTHESIS Integrated Analysis of Fishery and Survey
- Slides: 33
STOCK SYNTHESIS: Integrated Analysis of Fishery and Survey Size, Age, and Abundance Information for Stock Assessment Modified from Richard Methot NOAA Fisheries
What is AD Model Builder • • • Tool for developing nonlinear models Efficient estimation of model parameters C++ libraries Thousands of parameters Combining many data sets or analyses General Models – Stock Synthesis 2
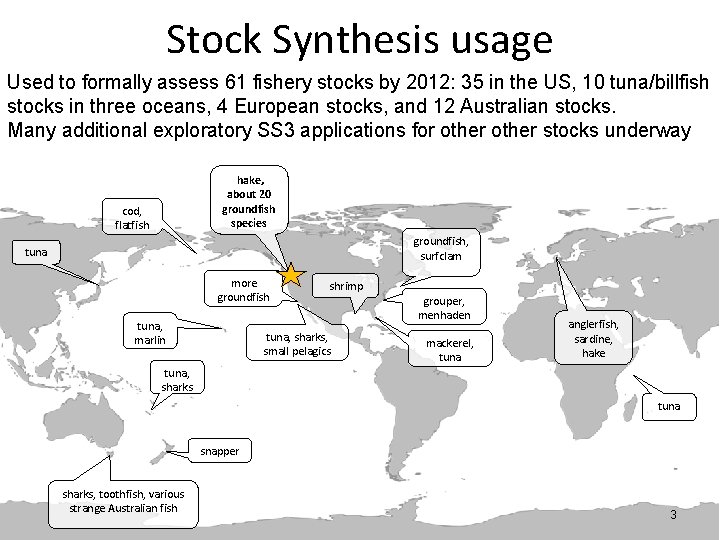
Stock Synthesis usage Used to formally assess 61 fishery stocks by 2012: 35 in the US, 10 tuna/billfish stocks in three oceans, 4 European stocks, and 12 Australian stocks. Many additional exploratory SS 3 applications for other stocks underway hake, about 20 groundfish species cod, flatfish groundfish, surfclam tuna more groundfish tuna, marlin shrimp tuna, sharks, small pelagics grouper, menhaden mackerel, tuna anglerfish, sardine, hake tuna, sharks tuna snapper sharks, toothfish, various strange Australian fish 3 3
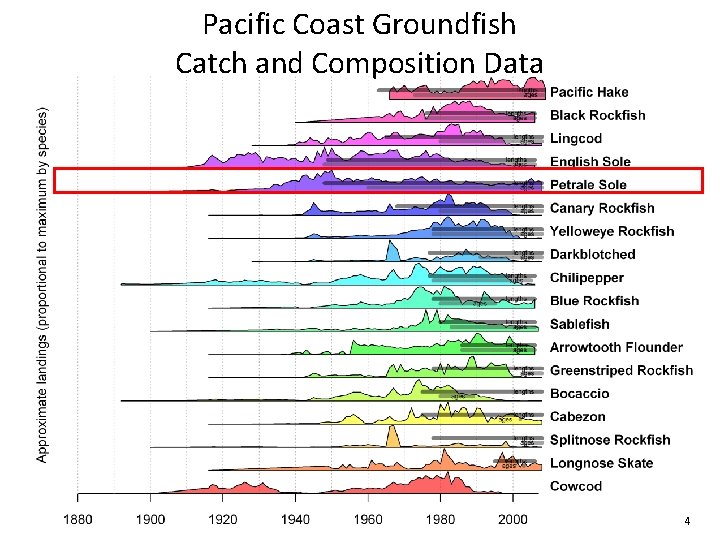
Pacific Coast Groundfish Catch and Composition Data 4
Benefits of widespread use (of any modeling platform) • Bugs less likely to escape notice • More comparison with other models • More development of associated tools • r 4 ss for plotting • ss 3 sim for end to end simulation/estimation • Facilitates sharing knowledge • common language among many scientists • more advice on building models • easier to understand each others’ results 5
Benefits of Stock Synthesis • • • Flexible range of options for many population processes Integrates many sources of data Propagates uncertainty well Works well from very simple to very complex models Widely used Evolving based on decades of development and exploration 6
Sub-Models of SS • Population Model – Recruitment, mortality, growth – Age and/or size structured • Observation Model – Derive expected values for data • Likelihood-based Statistical Model – Quantify goodness-of-fit • Algorithm to search for parameter set that maximizes the likelihood – Auto-Differentiation Model Builder (ADMB) • Cast results in terms of management quantities • Propagate uncertainty onto confidence interval for management quantities 7
Bring Model to the Data • Don’t transform data to meet rigid model structure • Do add processes to model to develop expected values for diverse, lightly processed data – Improves understanding of processes – Allows simultaneous use of more types of data – Statistical properties of data are preserved and transferred to variance of final model results 8
Tuning a Model: From Data to Results • Result will be a complex weighted average of fit to all included data; • Type, contrast and precision of data determine its influence • Examine residuals and root mean squared error of fit to data • Parsimoniously, add enough process to remove pattern to residuals • Judicious re-weighting of inputs to make error assumptions consistent 9
Data, Penalties, Priors • Penalties and Priors are information about parameters in a model – Example: maximum age used to create prior on M • Data are information about a derived quantity – Expected value for this quantity is derived from model parameters and structure – Example: Age composition of catch from a fleet • In IA, the expected value for maximum observed age could be derived as a function of M, then observed maximum age could be included as model data • Concept of Data and Priors blur; it’s all information 10
Stock Synthesis • • An implementation of IA Age and size structured, with geographic areas High diversity of data types, including tags Fully integrates population estimation, benchmark calculation, and forecasting 11
SS Outline • • Length and age structured population Derived life history quantities Data options Model structural options Biology: M, growth, reproduction Recruitment Catchability Selectivity 12
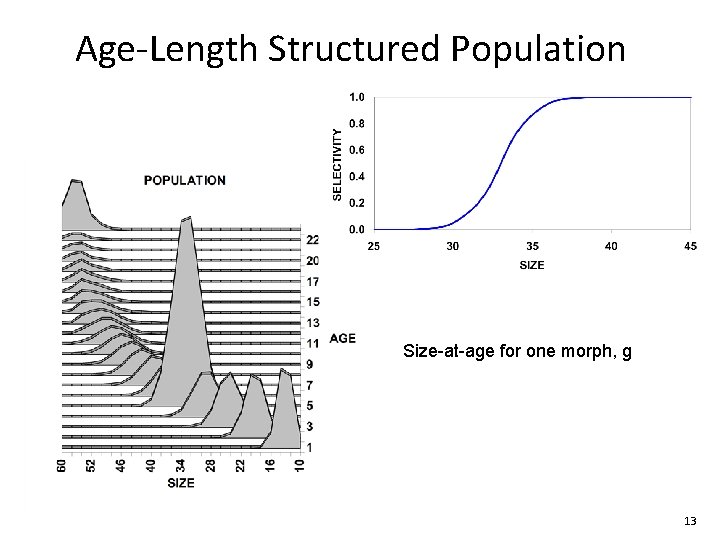
Age-Length Structured Population Size-at-age for one morph, g 13
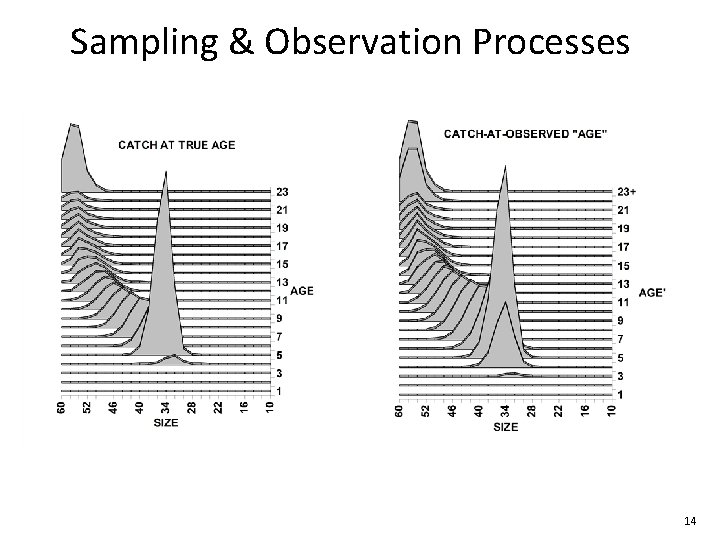
Sampling & Observation Processes 14
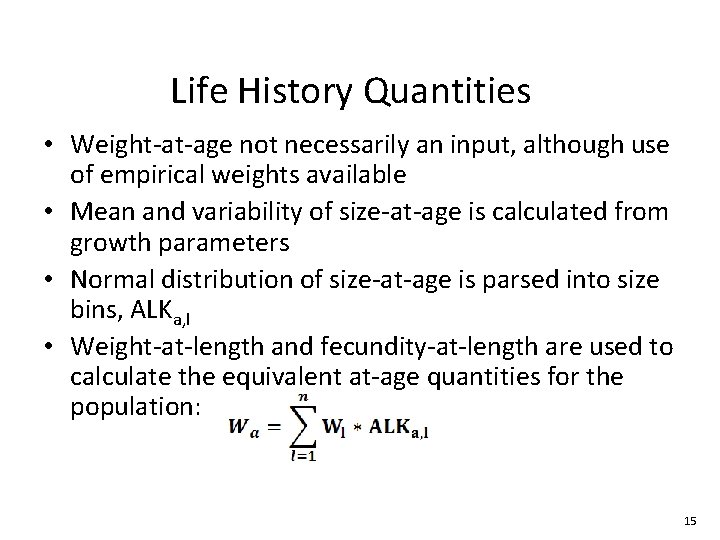
Life History Quantities • Weight-at-age not necessarily an input, although use of empirical weights available • Mean and variability of size-at-age is calculated from growth parameters • Normal distribution of size-at-age is parsed into size bins, ALKa, l • Weight-at-length and fecundity-at-length are used to calculate the equivalent at-age quantities for the population: 15
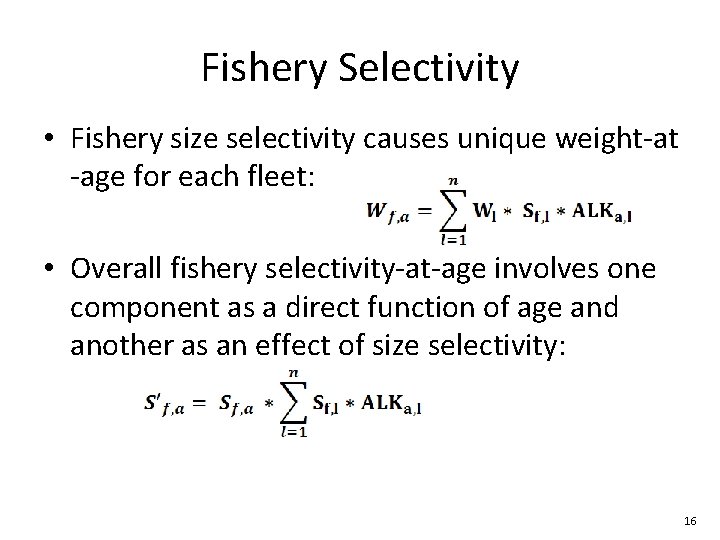
Fishery Selectivity • Fishery size selectivity causes unique weight-at -age for each fleet: • Overall fishery selectivity-at-age involves one component as a direct function of age and another as an effect of size selectivity: 16
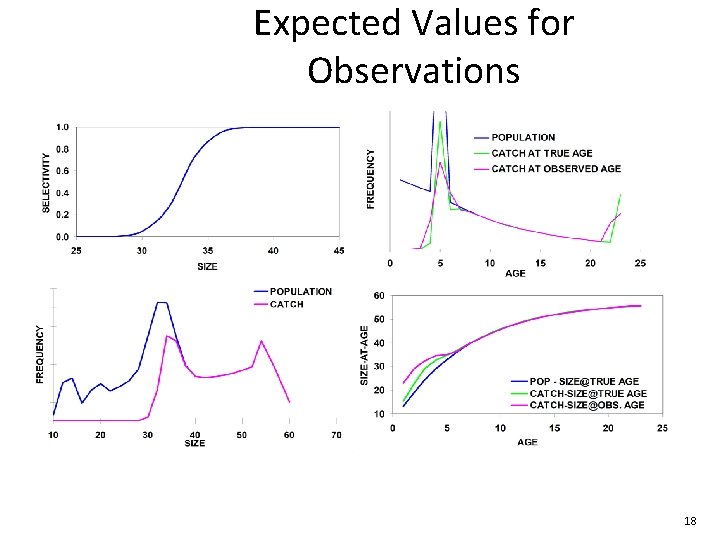
Real and Perceived Quantities • Real: Fishery body weight and selectivity are used in SS catch equations as described on the previous slide • Perceived: If there are observations of fishery weight-at-age or length-at-age, these will take into account imprecision in the ageing process which blurs across the age dimension 17
Expected Values for Observations 18
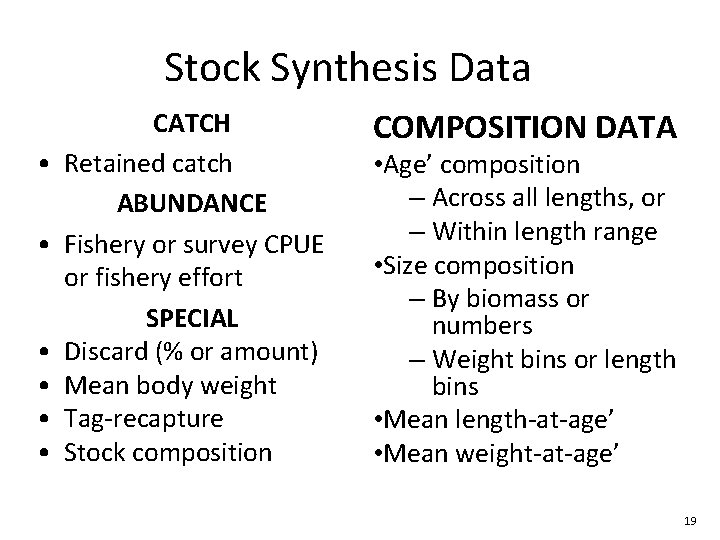
Stock Synthesis Data • • • CATCH Retained catch ABUNDANCE Fishery or survey CPUE or fishery effort SPECIAL Discard (% or amount) Mean body weight Tag-recapture Stock composition COMPOSITION DATA • Age’ composition – Across all lengths, or – Within length range • Size composition – By biomass or numbers – Weight bins or length bins • Mean length-at-age’ • Mean weight-at-age’ 19
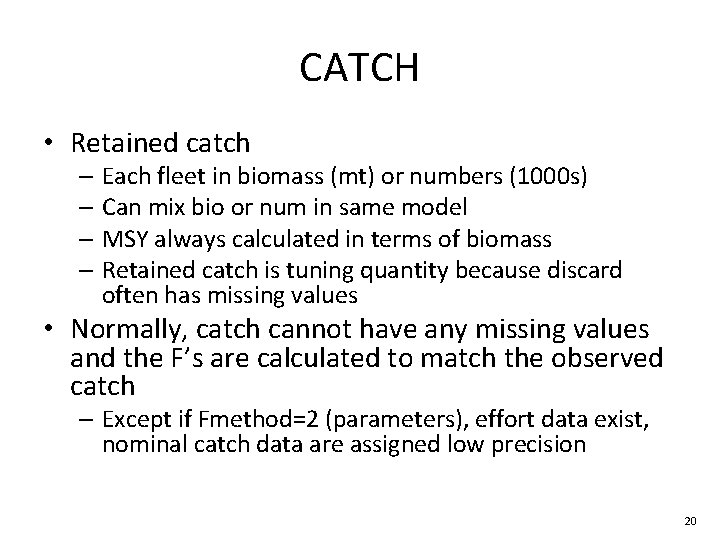
CATCH • Retained catch – Each fleet in biomass (mt) or numbers (1000 s) – Can mix bio or num in same model – MSY always calculated in terms of biomass – Retained catch is tuning quantity because discard often has missing values • Normally, catch cannot have any missing values and the F’s are calculated to match the observed catch – Except if Fmethod=2 (parameters), effort data exist, nominal catch data are assigned low precision 20
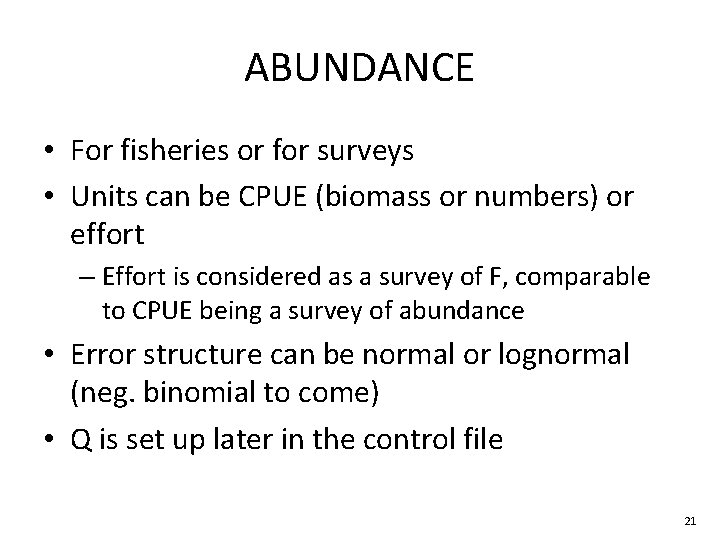
ABUNDANCE • For fisheries or for surveys • Units can be CPUE (biomass or numbers) or effort – Effort is considered as a survey of F, comparable to CPUE being a survey of abundance • Error structure can be normal or lognormal (neg. binomial to come) • Q is set up later in the control file 21
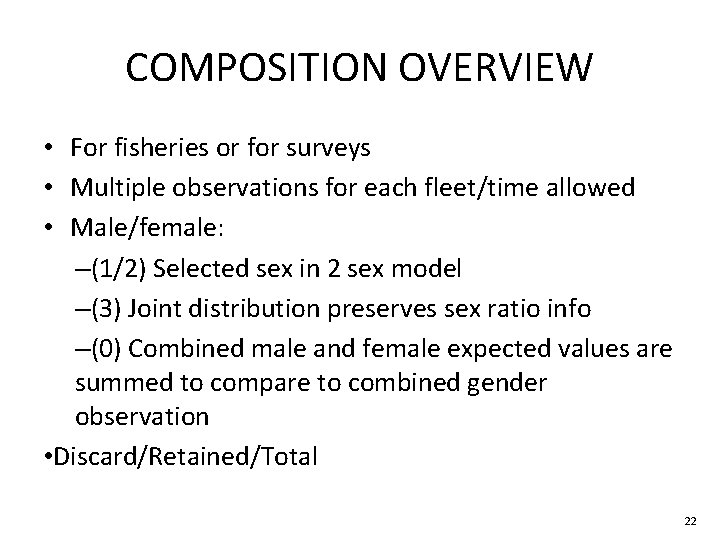
COMPOSITION OVERVIEW • For fisheries or for surveys • Multiple observations for each fleet/time allowed • Male/female: –(1/2) Selected sex in 2 sex model –(3) Joint distribution preserves sex ratio info –(0) Combined male and female expected values are summed to compare to combined gender observation • Discard/Retained/Total 22
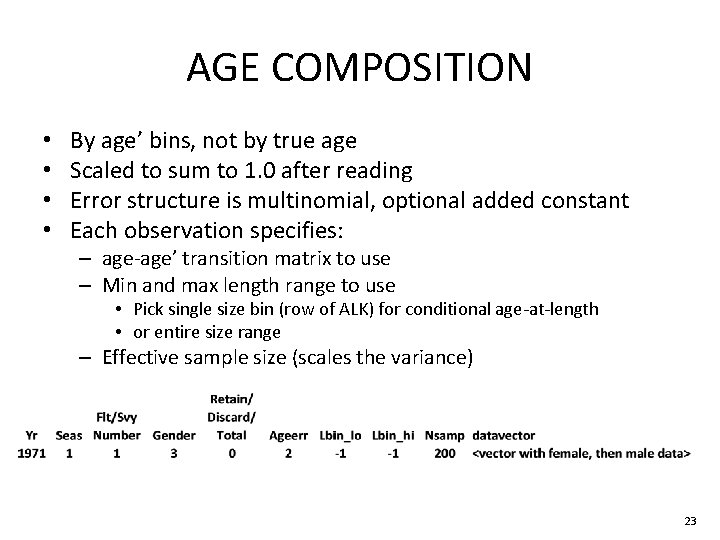
AGE COMPOSITION • • By age’ bins, not by true age Scaled to sum to 1. 0 after reading Error structure is multinomial, optional added constant Each observation specifies: – age-age’ transition matrix to use – Min and max length range to use • Pick single size bin (row of ALK) for conditional age-at-length • or entire size range – Effective sample size (scales the variance) 23
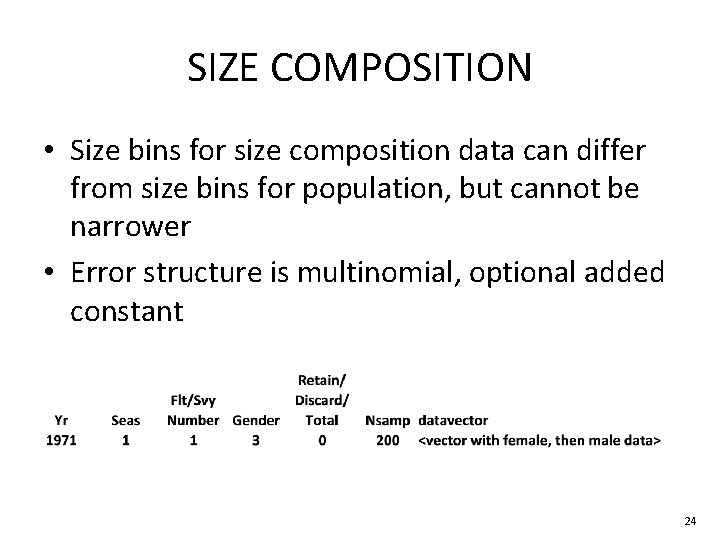
SIZE COMPOSITION • Size bins for size composition data can differ from size bins for population, but cannot be narrower • Error structure is multinomial, optional added constant 24
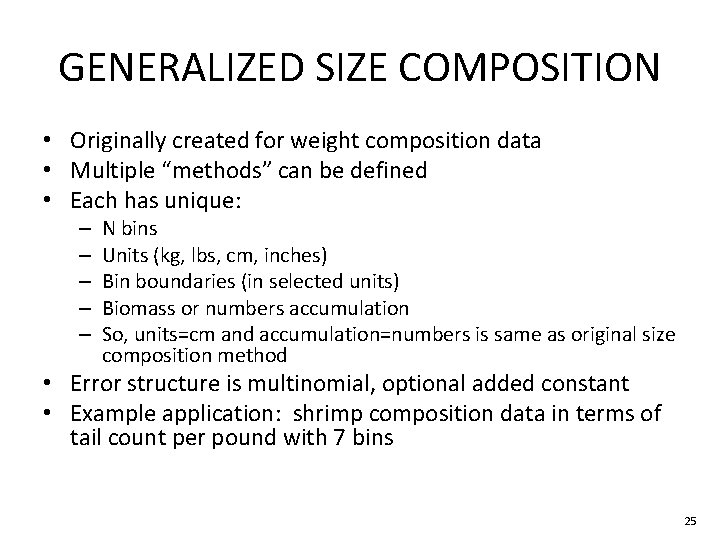
GENERALIZED SIZE COMPOSITION • Originally created for weight composition data • Multiple “methods” can be defined • Each has unique: – – – N bins Units (kg, lbs, cm, inches) Bin boundaries (in selected units) Biomass or numbers accumulation So, units=cm and accumulation=numbers is same as original size composition method • Error structure is multinomial, optional added constant • Example application: shrimp composition data in terms of tail count per pound with 7 bins 25
MEAN SIZE-at-AGE • • • Mean sizes are by age’ bins, not true age Values can be in units of body length or weight Each age’ has a sample size, N entered Error structure is normal, with: se = stddev(size-at-age’)/sqrt(N) 26
SS Structure • • Numbers-at-age for each of several “morphs” Recruitment = f(Spawn. Output)*exp(dev) Growth: defines normal dist. of size-at-age Selectivity Catchability Fishing and Natural Mortality Catch: can partition into discard and retained Areas with movement 27
Numbers-at-Age • Apportioned among biological morphs (growth patterns, birth seasons, areas) according to model parameters • Each is split male: female with specified ratio • Further split among sub-morphs with specified ratio • Each retains biological characteristics when move among areas 28
Stock Synthesis Data • Retained catch • CPUE and survey abundance • • Discard (% or total) Mean body weight Tag-recapture Stock composition • Age composition • Within length range • Size composition • By biomass or numbers • Within gender and discard/retained • Weight bins or length bins • Mean length-at-age 29
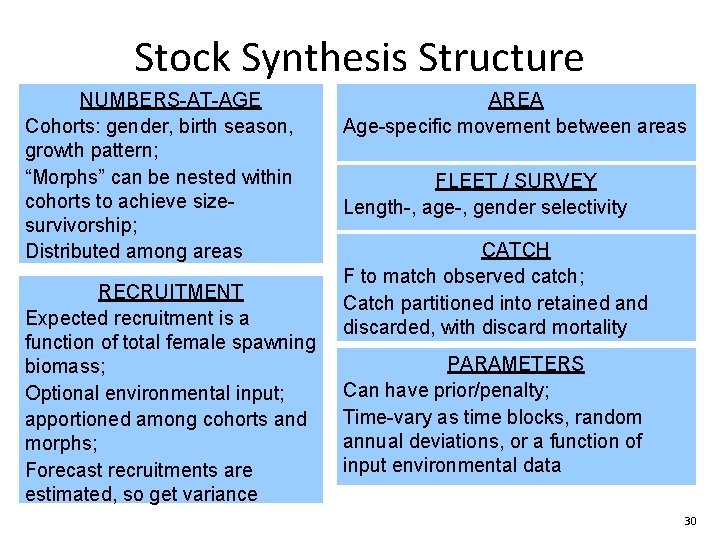
Stock Synthesis Structure NUMBERS-AT-AGE Cohorts: gender, birth season, growth pattern; “Morphs” can be nested within cohorts to achieve sizesurvivorship; Distributed among areas RECRUITMENT Expected recruitment is a function of total female spawning biomass; Optional environmental input; apportioned among cohorts and morphs; Forecast recruitments are estimated, so get variance AREA Age-specific movement between areas FLEET / SURVEY Length-, age-, gender selectivity CATCH F to match observed catch; Catch partitioned into retained and discarded, with discard mortality PARAMETERS Can have prior/penalty; Time-vary as time blocks, random annual deviations, or a function of input environmental data 30
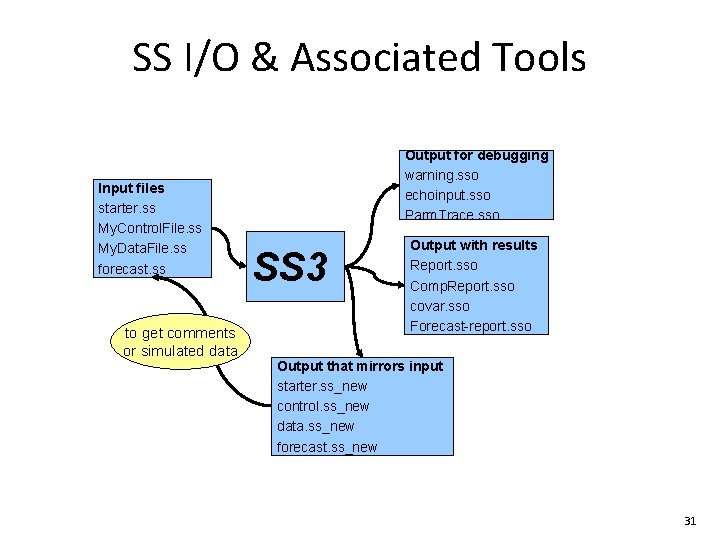
SS I/O & Associated Tools Input files starter. ss My. Control. File. ss My. Data. File. ss forecast. ss to get comments or simulated data Output for debugging warning. sso echoinput. sso Parm. Trace. sso SS 3 Output with results Report. sso Comp. Report. sso covar. sso Forecast-report. sso Output that mirrors input starter. ss_new control. ss_new data. ss_new forecast. ss_new 31
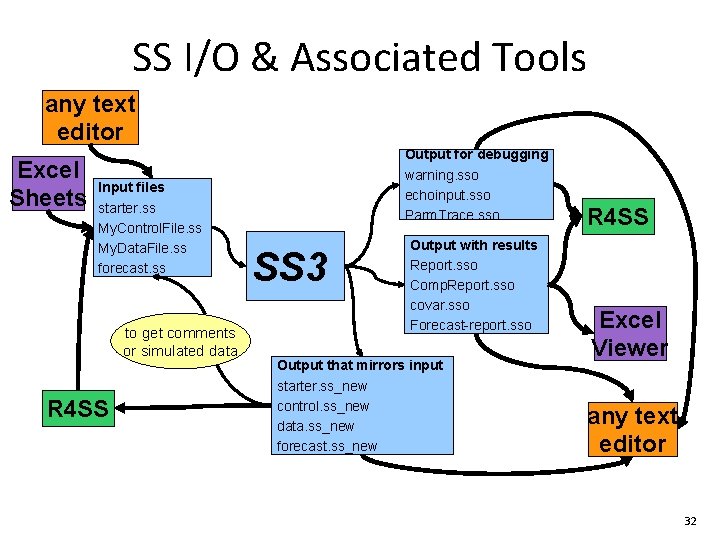
SS I/O & Associated Tools any text editor Excel Sheets Input files starter. ss My. Control. File. ss My. Data. File. ss forecast. ss to get comments or simulated data R 4 SS Output for debugging warning. sso echoinput. sso Parm. Trace. sso SS 3 Output with results Report. sso Comp. Report. sso covar. sso Forecast-report. sso Output that mirrors input starter. ss_new control. ss_new data. ss_new forecast. ss_new R 4 SS Excel Viewer any text editor 32
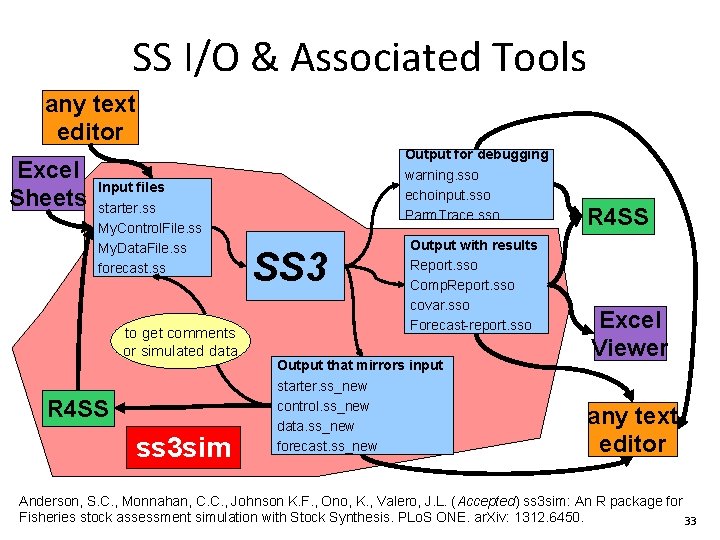
SS I/O & Associated Tools any text editor Excel Sheets Input files starter. ss My. Control. File. ss My. Data. File. ss forecast. ss to get comments or simulated data R 4 SS ss 3 sim Output for debugging warning. sso echoinput. sso Parm. Trace. sso SS 3 Output with results Report. sso Comp. Report. sso covar. sso Forecast-report. sso Output that mirrors input starter. ss_new control. ss_new data. ss_new forecast. ss_new R 4 SS Excel Viewer any text editor Anderson, S. C. , Monnahan, C. C. , Johnson K. F. , Ono, K. , Valero, J. L. (Accepted) ss 3 sim: An R package for Fisheries stock assessment simulation with Stock Synthesis. PLo. S ONE. ar. Xiv: 1312. 6450. 33