Statistical Analysis Standard Level Diploma What is statistics


= used to summarise the spread of values around the")


: 240 -5. An evaluation of the")


- Slides: 19
Statistical Analysis Standard Level Diploma
What is statistics? ● Even though you may not have realized it, you probably have made some statistical statements in your everyday conversation or thinking. Statements like "I sleep for about eight hours per night on average" and "You are more likely to pass the exam if you start preparing earlier" are actually statistical in nature. ● Statistics is a discipline which is concerned with: ●designing experiments and other data collection, ●summarizing information to aid understanding, ●drawing conclusions from data, and ●estimating the present or predicting the future.
Why start with statistics? ● You will need to design your own experiments and collect your own data ● You need to know whether your data is ‘statistically significant’ and also whether is SPECIFIC, ACCURATE, RELIABLE and VALID. ● Ideally you want to do the majority of this in year 12 so you can focus on your exams in year 13
Statistical Analysis Sample = the world leading long jumps by men and women each year. mean (µ) Calculate the = add up all the numbers and divide by the population size
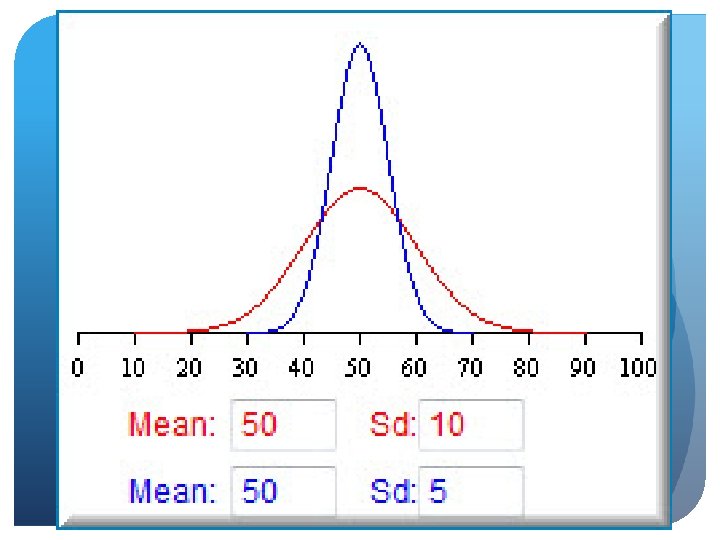
Statistical Analysis Standard Deviation (∂)= used to summarise the spread of values around the mean
Statistical Analysis Within a normal distribution approximately 68% and 95% of the values fall within plus or minus one or two standard deviations respectively. World average for 100 m
WHO So. CAN DRAW A SIMPLE why is SD important? ? GRAPH WITH ERROR BARS 2 Sports Drinks both claim to improve sprint SHOWING THIS DATA? performance on average by 10% (mean) A B 10 9. 5 9 11 10. 5 9. 5 8 12 10 1. 1 10 2 18 19 1 17 3 19. 8 0. 2 10 8. 5 Q. What else do you notice about the number of tests? ?
Error Bars
• Can everyone now calculate their mean, standard deviation and co-efficient of variance for both sets of results • Co-efficient of variance (v) The ratio of the standard deviation to the mean expressed as a percentage. V= 100 x SD Mean What do you think the co-efficient of variance tells us? ?
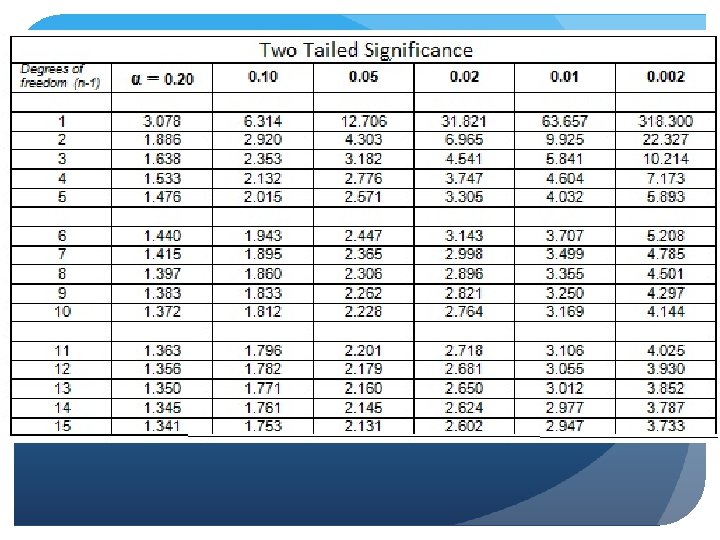
• We will now conduct a t-test in excel on our results. • The t-test tells us whether two sets of data are statistically significantly • We also need to work out the P value (probability that the results are caused by chance) needs to be less than 0. 05 (5%). If they are <0. 05 then they are thought to be statistically significant. • What type of t-test was this? • Why is it not an un-paired or independent t-test? • Lets watch this video
Correlation or cause?
Correlation or cause?
Refers to how close a determined value is to the actual value and depends on the procedures and equipment used. refers to the degree to which a test is consistent and stable in measuring what it is intended to measure. It will depend upon how strict the test is conducted and the individual's level of motivation to perform the test. refers to the degree to which the test actually measures what it claims to measure and the extent to which conclusions and decisions made on the basis of test scores are appropriate and meaningful. Refers to the ability of the test to correctly identify those parameters which are most RELIABILIT Y SPECIFICI TY ACCURAC Y
J Sports Med Phys Fitness. 1997 Dec; 37(4): 240 -5. An evaluation of the specificity, validity and reliability of jumping tests. ● There were three objectives of this study: 1. To describe the influence of using a single and double leg take-off as a function of run-up length in jumping for height. 2. To determine if various types of jumps are specific in nature. 3. To evaluate two methods of assessing jumping height (a modified Vertec or Yardstick and a Board) for validity and inter-day reliability. METHODS: ● Seventeen male subjects were tested on jumps for height from a standing position and using a 1, 3, 5 and 7 stride run-up. These jumps were performed using a single and double leg take-off measured by the Yardstick. Selected jumps were also tested using a Board method and repeated for assessment of reliability. RESULTS: ● The single leg take-off produced significantly higher jumps when the run-up was three or more strides. The interrelationships among jump conditions were generally high, however jump types could be considered as specific when the run-up length and number of legs used in the take-off were different. The Yardstick produced significantly greater jump heights than the Board method, which questions the validity of using a board for assessment of maximum jump performance. The reliability of both methods was generally high however the jumps performed from a run-up produced less reliable results than the standing jumps for the Yardstick. CONCLUSIONS: ● It was suggested that the design of tests to assess jumping ability should consider the specific jump type used in the sport of interest and that the Yardstick is the preferred mode of testing, provided that attempts are made to maximise reliability.
Sodium bicarbonate and sprint performance The positive impact of sodium bicarbonate on sprint performance has been confirmed by a new study comparing its effects with those of two other potential ‘buffering’ agents. In a double blind randomised crossover trial, 15 competitive male endurance runners, accustomed to brief intense efforts as part of their interval training, performed a run to exhaustion 90 minutes after ingestion of each of the agents and a placebo (sodium chloride) on separate days. The mean run times to exhaustion were: ● bicarbonate 82. 3 seconds; ● lactate 80. 2 s; ● citrate 78. 2 s; ● chloride 77. 4 s. There were no substantial differences in gut discomfort between the buffer treatments. The researchers conclude they have found ‘more evidence that ingestion of sodium bicarbonate is an effective strategy to enhance sprint performance. Sodium lactate is also likely to be effective, although possibly not as effective as sodium bicarbonate. Sodium citrate is probably not as effective as sodium bicarbonate. ‘We therefore recommend ingestion of sodium bicarbonate to enhance sprint performance. ’