SQL Saturday Cork Welcome to Cork Data Storytelling


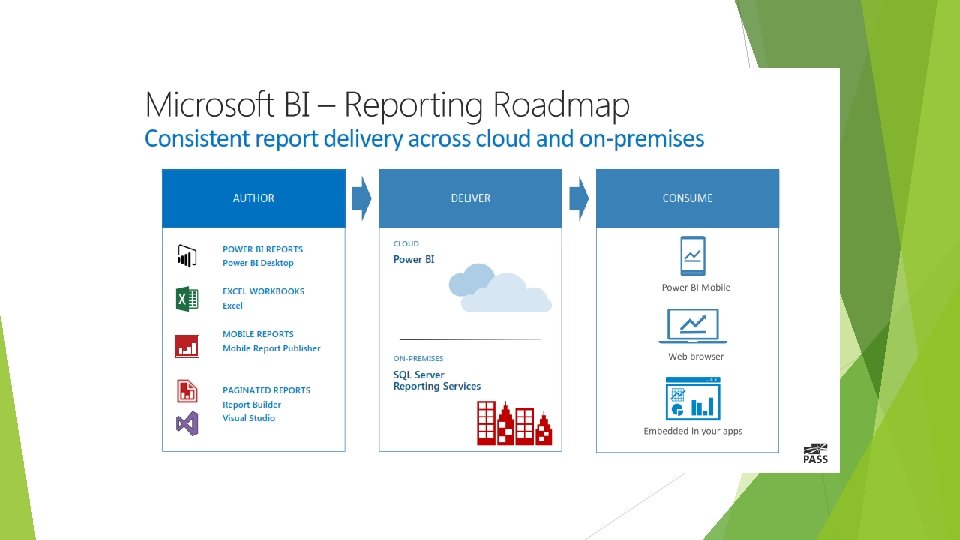
 REPORT DELIVERY")


- Slides: 36
SQL Saturday Cork Welcome to Cork Data Storytelling for Business Intelligence with SQL Server 2017
Where is the data coming from?
2025 Opportunity Space Data: Mc. Kinsey
BIModel BI The practice of managing two separate, coherent modes of business intelligence and analytics delivery: Stability Agility
Analysis Services Multidimensional and Tabular
Analysis Services – in perspective Tabular Model x. Velocity, In-Memory 1998 1996 2001 2000 2012 2005 2003 2008 2011 Power. Pivot for Excel 2010 “Vertipaq” 2014
Power Pivot vs Tabular Scalability Manageability Security Development Toolchain More info http: //bit. ly/1 w. Mq. RP 2 Credit, Microsoft Virtual Academy, https: //mva. microsoft. com/en-us/training-courses/implementing-tabular-data-models-8441? l=sn 9 y 00 Vz_1904984382
Multidimensional vs Tabular Data Source Model Size Scripting / Language Model Features Programmability Security Credit, Microsoft Virtual Academy, https: //mva. microsoft. com/en-us/training-courses/implementing-tabular-data-models-8441? l=sn 9 y 00 Vz_1904984382
BISM Normalizer Visual Studio Extension aimed at source control and model management workflows for Azure Analysis Services and SQL Server Analysis Services Enabling the adoption of Dev. Ops processes for tabular models, BISM Normalizer bridges the gap between self-service and IT-owned “corporate BI”.
Github Azure Analysis Services and SQL Server Analysis Services community repository on Github
BISM Normalizer
Query. Memory. Limit The settable value of 1 to 100 is a percentage. Above that, it’s in bytes. The default value of 0 means not specified and no limit is applied. Azure Analysis Services only Latest Version of SSMS only
This property limits the number of rows returned in a rowset to clients Azure Analysis Services only Rowset Serialization. Limit It applies to both DAX and MDX.
Reporting Services Report Creation, Connectivity, Design, Output
Learning = ∆Knowledge
“ If it takes significant effort to fully understand the insights, then the honesty of the visualization is questionable. - Shi. Sh Shridhar
REPORT SERVER Processing and rendering Scheduling and delivery REPORT VIEWING (PCs, mobile) REPORT DELIVERY DESTINATIONS Web browsers Email File share Power BI Mobile Share. Point Power BI Custom apps/LOB Custom Power BI – SSRS Data Driven Subscription Embed R data set Email alerts (Share. Point mode only) Embed R visualization Mobile scenario Pin to Power BI Pro
What is SSRS? Server components that execute reports Get data from data source Render report to a certain target format (e. g. PDF, Excel, HTML, etc. ) Web portal for managing reports Management tasks (upload report, schedule report execution, etc. ) Trigger report execution incl. interaction (drill down, links between reports, etc. ) Share. Point integration API Web services URL-based API . NET components for Win. Forms and ASP. NET
5 Techniques to beautiful and actionable data insights • Enrich your data - R and External script for R language • Understand Statistics - Sum, Avg, Min and Max are boring! • Know graph tools - Leverage the best of SSRS (and Power BI) as powerful tools with R and learn R third party software for visualization (Shiny, Plotly) • Master story telling - Use visualizations to emphasize on your story • Enable users – Self-service, mobile BI and intelligent alerting
Adventure Works Sample File for SQL Server 2016 CTP 3 - http: //bit. ly/1 TVf. DBv 5 Golden Rules of Data Visualization - http: //bit. ly/1 TVf. DBv The Data Visualisation Catalogue - http: //bit. ly/1 h. GUJEf What’s New in Reporting Services (SSRS) - http: //bit. ly/1 Uc. Dgbx SQL Server R Services - http: //bit. ly/1 Uc. Dgbx Creating Power BI Visuals using R - http: //bit. ly/1 Uc. CJqa Data Driven Subscriptions in SSRS - http: //bit. ly/1 XTH 2 tv Reporting Services Data Alerts - http: //bit. ly/1 WNADR 3
SQL Server Reporting Services News Report Creation Report Connectivity Report Design Report Output
Report Creation You can add comments to reports within the web portal of a report server Annotate a snapshot of a tile, report, or visual from the Power BI mobile app for i. OS and Android devices.
Report Connectivity mobile reports can connect to onpremises SQL Server Analysis Services multidimensional data mobile reports can connect to onpremises SQL Server Analysis Services tabular data
Report Output Charts, gauges, maps and images can be pinned to a Power BI dashboard When you have pinned your SSRS report item to a Power BI dashboard, Reporting Services manages the subscription
Report Output SSRS can produce Power. Point output in the Report Builder, Report Designer (SSDT) and the SSRS web portal Send the SSRS output to the Power. Point rendering extension selecting the PPTX format for subscription output Use the SSRS URL access to render and export
Reporting Services Futures Reporting Services integration with Share. Point is no longer available after SQL Server 2016 Only Native mode from now on Integrate Native mode in Share. Point
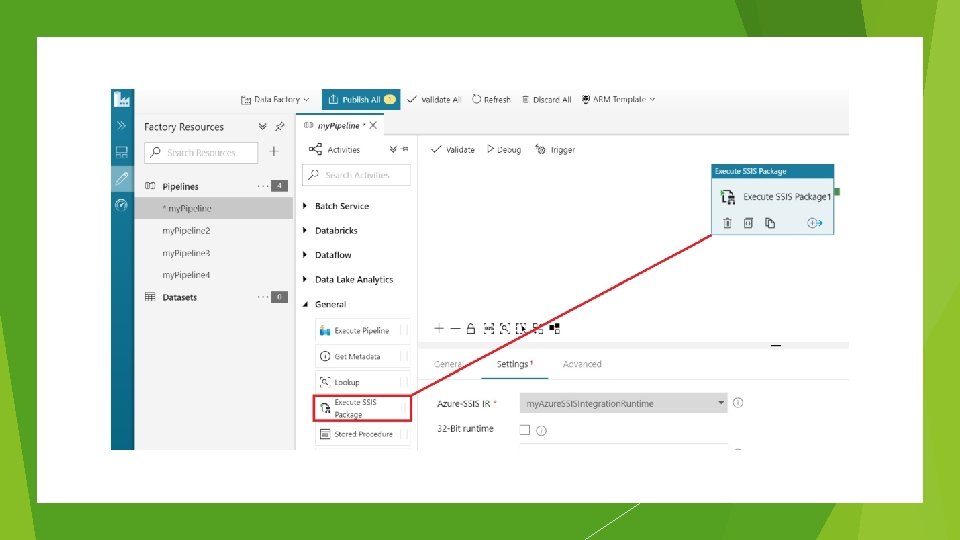
Invoke SSIS package executions within ADF pipelines Stored Procedure activity used in ADF invoke SSIS packages in ADF. Create a linked service to connect to Azure SQL Database (DB) server hosting their catalog of SSIS projects (SSISDB) and T-SQL script to invoke stored procedures in SSISDB that create, configure, and start SSIS package executions First class Execute SSIS Package into the ADF pipeline Select Azure-SSIS Integration Runtime (IR) to execute package Specify path to deployed package in SSIDB Reference: https: //docs. microsoft. com/en-us/azure/data-factory/how-to-invoke-ssis-package-ssis-activity.
Monitor Pipelines in SSMS Schedule SSIS package executions on Azure-SSIS IR Triggering runs of ADF pipelines that contain Execute SSIS Package activities. Modernize your ETL (Extract – Transform – Load) workflows Group SSIS activities with other activities such as Web activities with webhooks splicing/injecting built-in SSIS connectors, tasks, and data transformations within ADF pipelines custom/Open Source/3 rd party components
Power BI News June 2018 News
Dashboard Themes Theming is an extension to the existing report theming feature on Desktop A theme file is a JSON file that includes all the colours you want use for your dashboard. You can upload a theme file using the Upload JSON theme button on top of the pane.
Questions?
Thank You!
Thanks to our Sponsors