SQL Saturday OKC 2016 Edition SQL Server 2016












- Slides: 48

SQL Saturday OKC 2016 Edition SQL Server 2016 It Just Runs Faster http: //aka. ms/sql 2016 faster Credits to Robert Dorr Bob Ward Principal Architect – Tiger Team Microsoft bobward@microsoft. com @bobwardms http: //aka. ms/bobsql http: //aka. ms/bobwardms 11 -13 August 2016. NIMHANS Convention Centre, Bangalore, India.

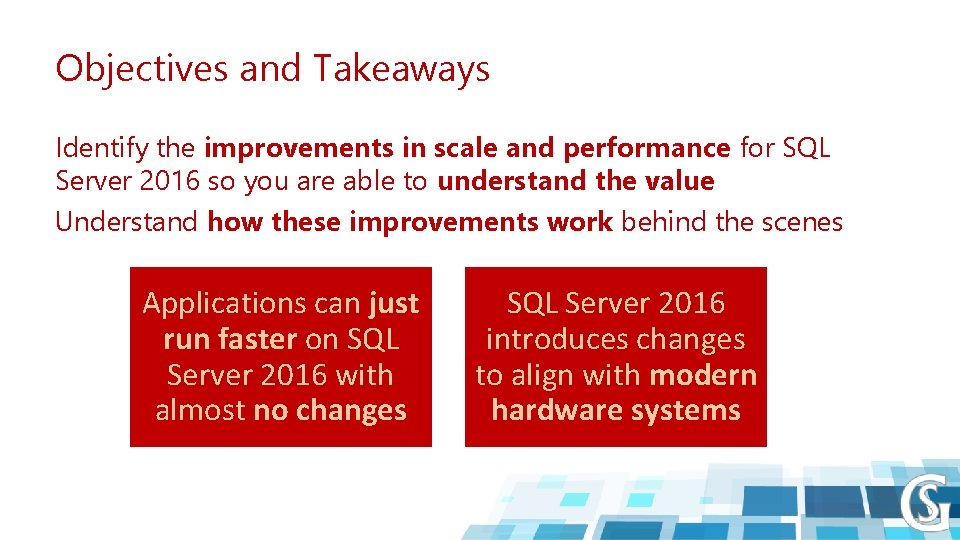
Objectives and Takeaways Identify the improvements in scale and performance for SQL Server 2016 so you are able to understand the value Understand how these improvements work behind the scenes Applications can just run faster on SQL Server 2016 with almost no changes SQL Server 2016 introduces changes to align with modern hardware systems

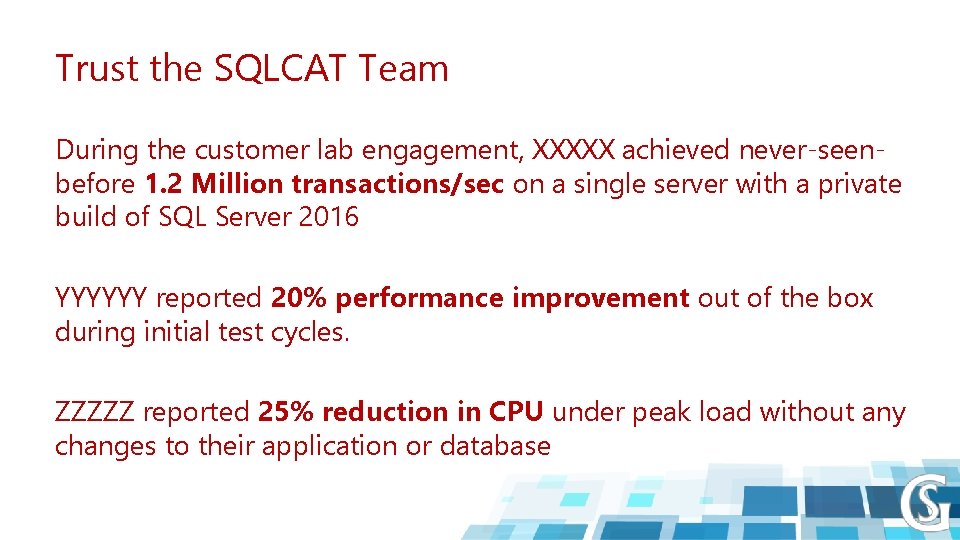
Trust the SQLCAT Team During the customer lab engagement, XXXXX achieved never-seenbefore 1. 2 Million transactions/sec on a single server with a private build of SQL Server 2016 YYYYYY reported 20% performance improvement out of the box during initial test cycles. ZZZZZ reported 25% reduction in CPU under peak load without any changes to their application or database

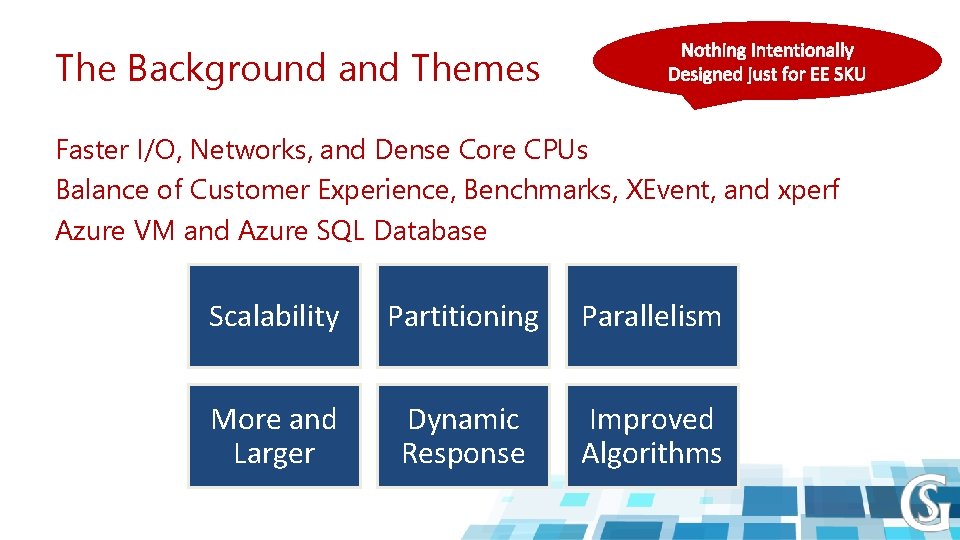
The Background and Themes Faster I/O, Networks, and Dense Core CPUs Balance of Customer Experience, Benchmarks, XEvent, and xperf Azure VM and Azure SQL Database Scalability Partitioning Parallelism More and Larger Dynamic Response Improved Algorithms

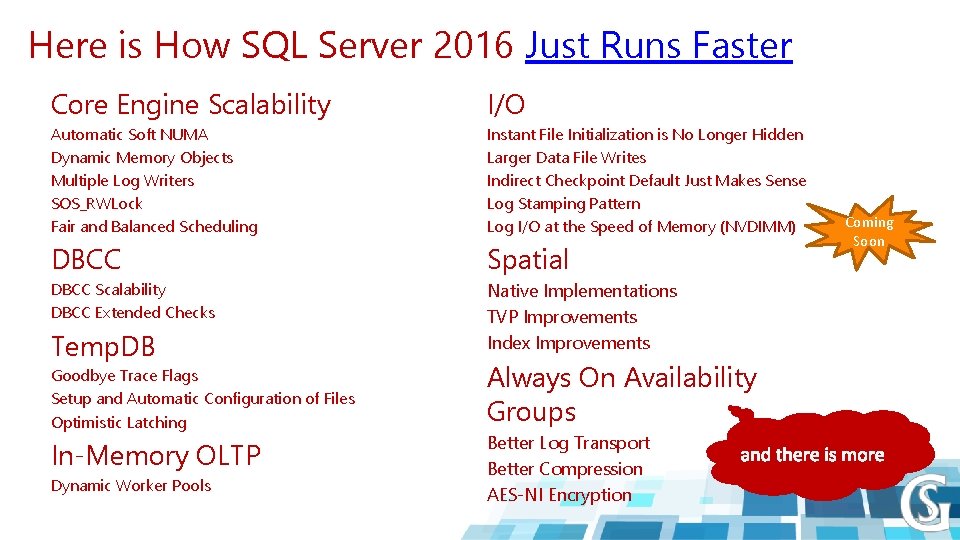
Here is How SQL Server 2016 Just Runs Faster Core Engine Scalability I/O Automatic Soft NUMA Dynamic Memory Objects Multiple Log Writers SOS_RWLock Fair and Balanced Scheduling Instant File Initialization is No Longer Hidden Larger Data File Writes Indirect Checkpoint Default Just Makes Sense Log Stamping Pattern Log I/O at the Speed of Memory (NVDIMM) DBCC Spatial DBCC Scalability DBCC Extended Checks Native Implementations TVP Improvements Index Improvements Temp. DB Goodbye Trace Flags Setup and Automatic Configuration of Files Optimistic Latching In-Memory OLTP Dynamic Worker Pools Always On Availability Groups Better Log Transport Better Compression AES-NI Encryption Coming Soon

CORE ENGINE SCALABILITY

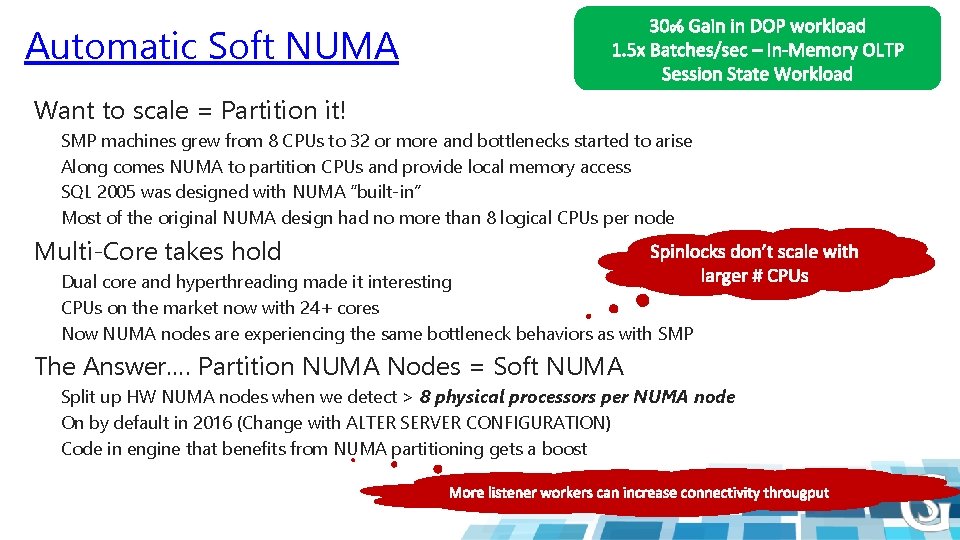
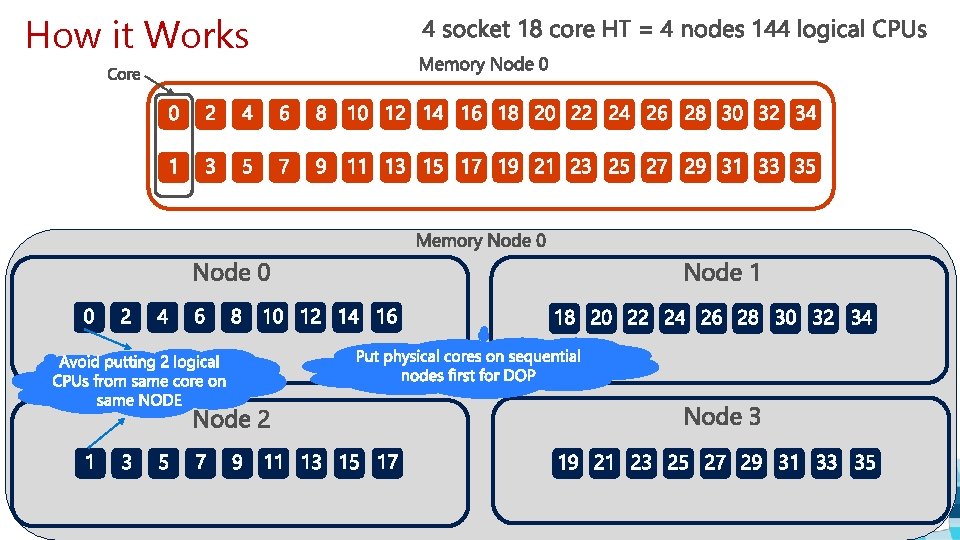
Automatic Soft NUMA Want to scale = Partition it! SMP machines grew from 8 CPUs to 32 or more and bottlenecks started to arise Along comes NUMA to partition CPUs and provide local memory access SQL 2005 was designed with NUMA “built-in” Most of the original NUMA design had no more than 8 logical CPUs per node Multi-Core takes hold Dual core and hyperthreading made it interesting CPUs on the market now with 24+ cores Now NUMA nodes are experiencing the same bottleneck behaviors as with SMP The Answer…. Partition NUMA Nodes = Soft NUMA Split up HW NUMA nodes when we detect > 8 physical processors per NUMA node On by default in 2016 (Change with ALTER SERVER CONFIGURATION) Code in engine that benefits from NUMA partitioning gets a boost

How it Works

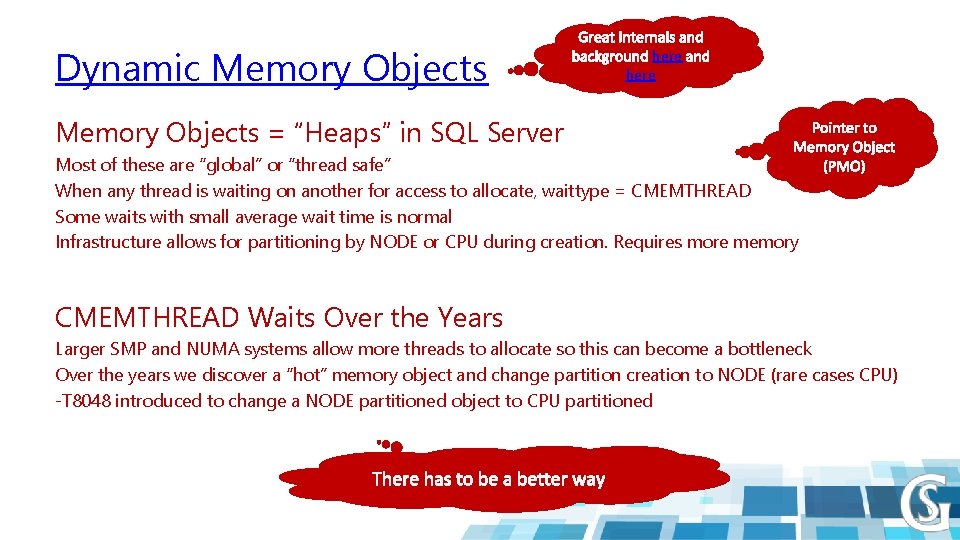
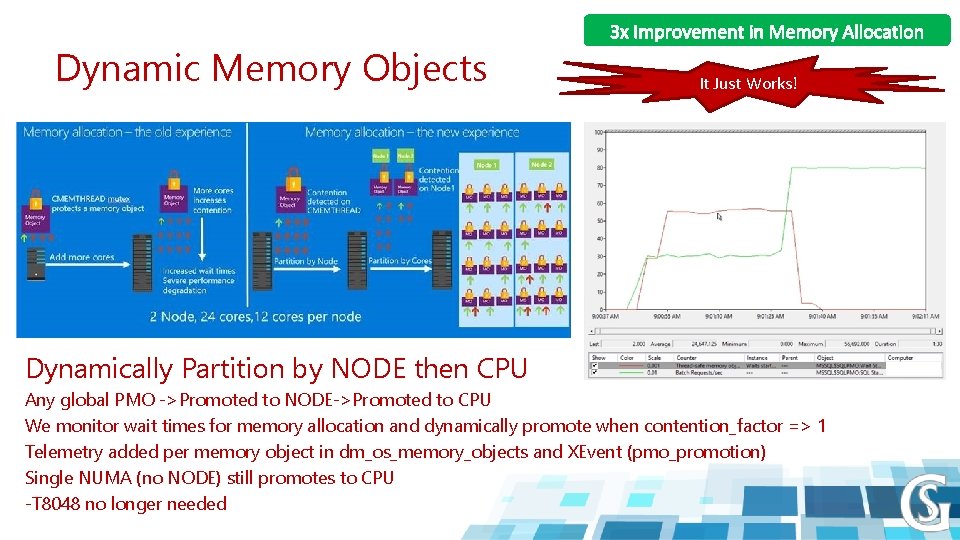
Dynamic Memory Objects here Memory Objects = “Heaps” in SQL Server Most of these are “global” or “thread safe” When any thread is waiting on another for access to allocate, waittype = CMEMTHREAD Some waits with small average wait time is normal Infrastructure allows for partitioning by NODE or CPU during creation. Requires more memory CMEMTHREAD Waits Over the Years Larger SMP and NUMA systems allow more threads to allocate so this can become a bottleneck Over the years we discover a “hot” memory object and change partition creation to NODE (rare cases CPU) -T 8048 introduced to change a NODE partitioned object to CPU partitioned

Dynamic Memory Objects It Just Works! Dynamically Partition by NODE then CPU Any global PMO ->Promoted to NODE->Promoted to CPU We monitor wait times for memory allocation and dynamically promote when contention_factor => 1 Telemetry added per memory object in dm_os_memory_objects and XEvent (pmo_promotion) Single NUMA (no NODE) still promotes to CPU -T 8048 no longer needed

Watch PMOs dynamically fly Demo

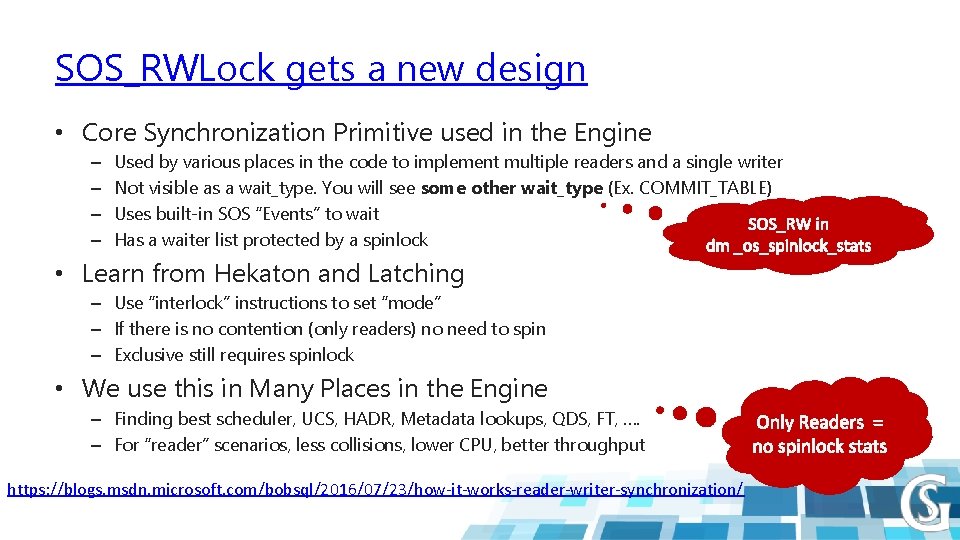
SOS_RWLock gets a new design • Core Synchronization Primitive used in the Engine – – Used by various places in the code to implement multiple readers and a single writer Not visible as a wait_type. You will see some other wait_type (Ex. COMMIT_TABLE) Uses built-in SOS “Events” to wait Has a waiter list protected by a spinlock • Learn from Hekaton and Latching – Use “interlock” instructions to set “mode” – If there is no contention (only readers) no need to spin – Exclusive still requires spinlock • We use this in Many Places in the Engine – Finding best scheduler, UCS, HADR, Metadata lookups, QDS, FT, …. – For “reader” scenarios, less collisions, lower CPU, better throughput https: //blogs. msdn. microsoft. com/bobsql/2016/07/23/how-it-works-reader-writer-synchronization/

DBCC JUST RUNS FASTER

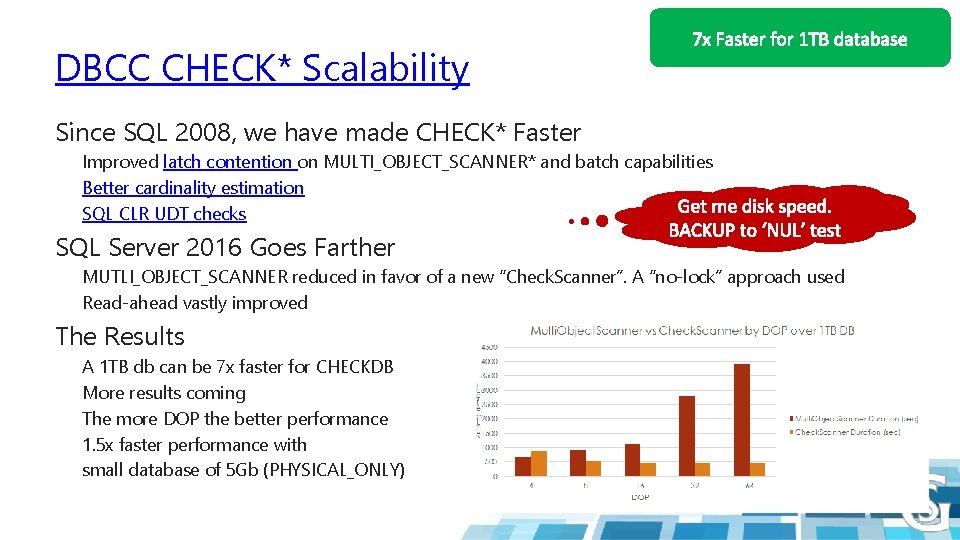
DBCC CHECK* Scalability Since SQL 2008, we have made CHECK* Faster Improved latch contention on MULTI_OBJECT_SCANNER* and batch capabilities Better cardinality estimation SQL CLR UDT checks SQL Server 2016 Goes Farther MUTLI_OBJECT_SCANNER reduced in favor of a new “Check. Scanner”. A “no-lock” approach used Read-ahead vastly improved The Results A 1 TB db can be 7 x faster for CHECKDB More results coming The more DOP the better performance 1. 5 x faster performance with small database of 5 Gb (PHYSICAL_ONLY)

TEMPDB IS JUST FASTER

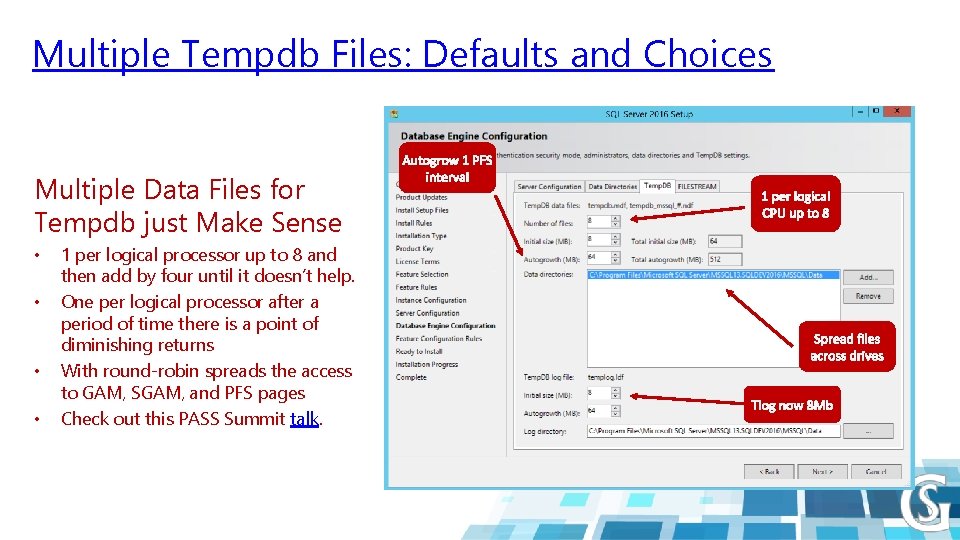
Multiple Tempdb Files: Defaults and Choices Multiple Data Files for Tempdb just Make Sense • • 1 per logical processor up to 8 and then add by four until it doesn’t help. One per logical processor after a period of time there is a point of diminishing returns With round-robin spreads the access to GAM, SGAM, and PFS pages Check out this PASS Summit talk.

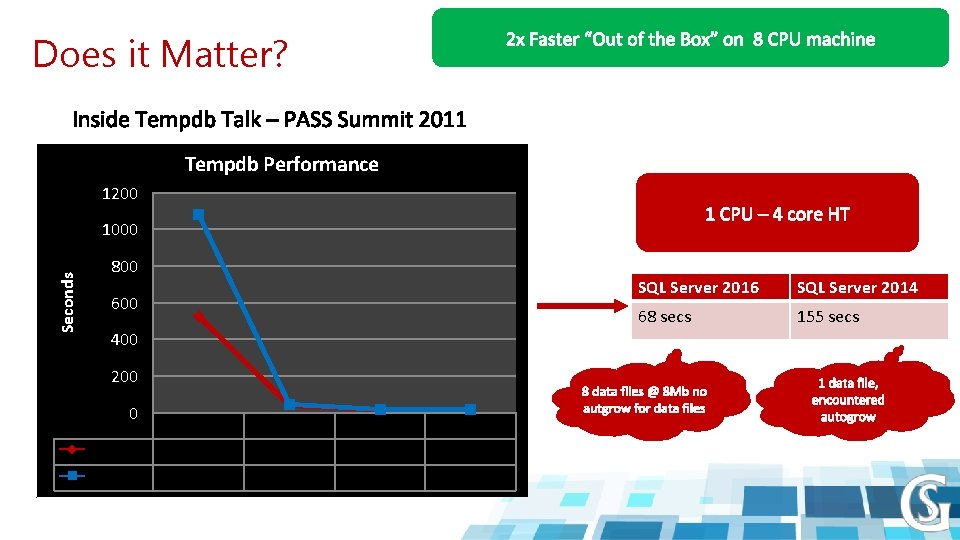
Does it Matter? Tempdb Performance 1200 Seconds 1000 800 600 400 200 0 1118 On 1118 Off 1 File 525 1080 8 Files 38 45 32 Files 15 17 64 Files 15 15 SQL Server 2016 SQL Server 2014 68 secs 155 secs

Tempdb out of the box is faster Demo

I/O JUST RUNS FASTER

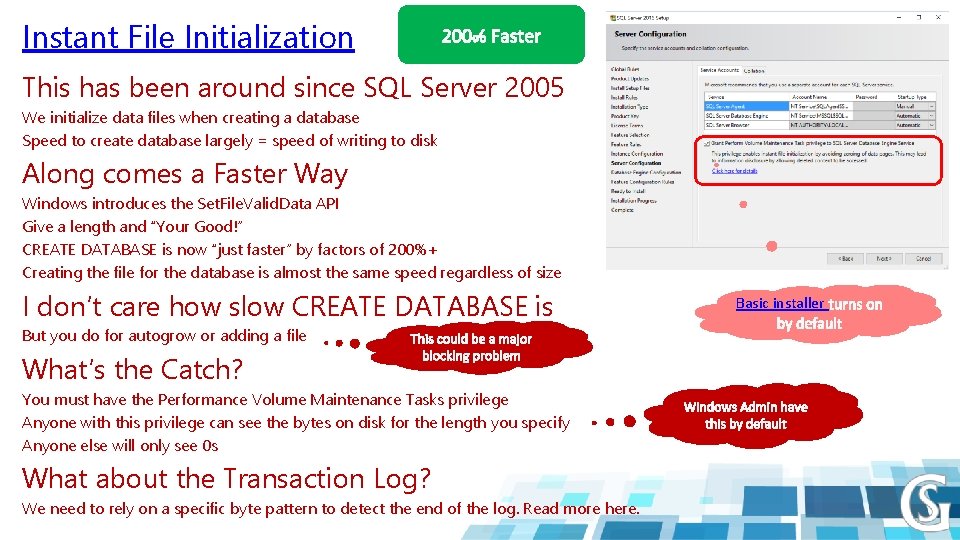
Instant File Initialization This has been around since SQL Server 2005 We initialize data files when creating a database Speed to create database largely = speed of writing to disk Along comes a Faster Way Windows introduces the Set. File. Valid. Data API Give a length and “Your Good!” CREATE DATABASE is now “just faster” by factors of 200%+ Creating the file for the database is almost the same speed regardless of size I don’t care how slow CREATE DATABASE is But you do for autogrow or adding a file What’s the Catch? You must have the Performance Volume Maintenance Tasks privilege Anyone with this privilege can see the bytes on disk for the length you specify Anyone else will only see 0 s What about the Transaction Log? We need to rely on a specific byte pattern to detect the end of the log. Read more here. Basic installer

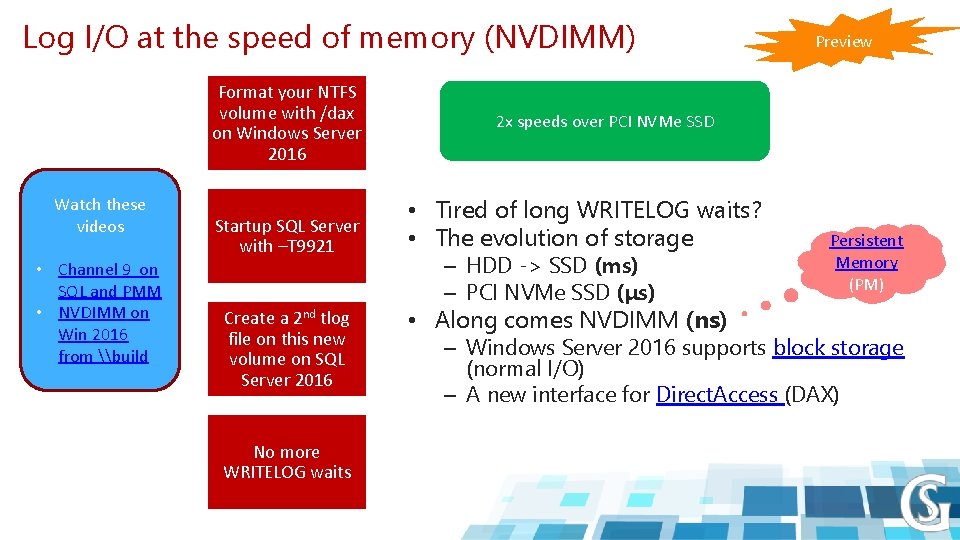
Log I/O at the speed of memory (NVDIMM) Format your NTFS volume with /dax on Windows Server 2016 Watch these videos • Channel 9 on SQL and PMM • NVDIMM on Win 2016 from \build Startup SQL Server with –T 9921 Create a 2 nd tlog file on this new volume on SQL Server 2016 No more WRITELOG waits Preview 2 x speeds over PCI NVMe SSD • Tired of long WRITELOG waits? • The evolution of storage – HDD -> SSD (ms) – PCI NVMe SSD (μs) • Along comes NVDIMM (ns) Persistent Memory (PM) – Windows Server 2016 supports block storage (normal I/O) – A new interface for Direct. Access (DAX)

IN-MEMORY OLTP IS JUST FASTER

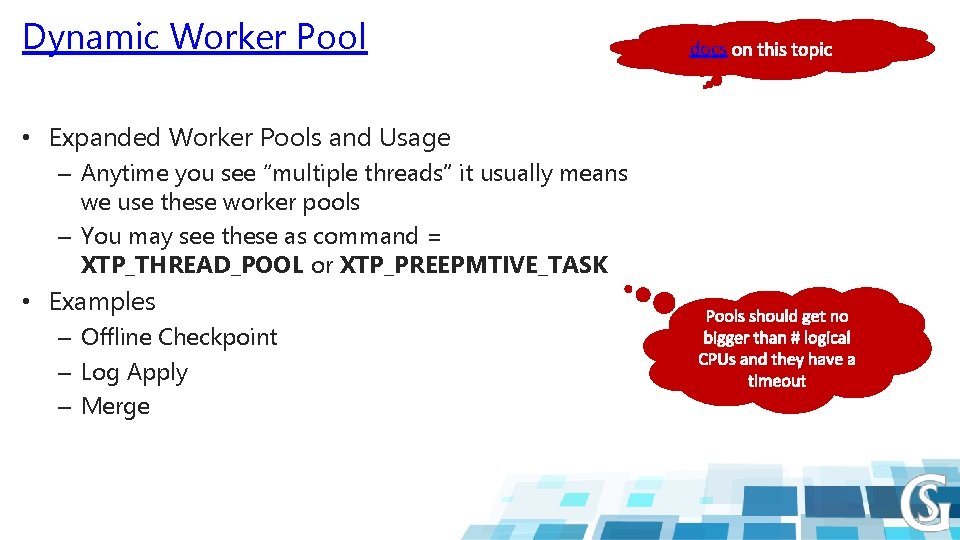
Dynamic Worker Pool • Expanded Worker Pools and Usage – Anytime you see “multiple threads” it usually means we use these worker pools – You may see these as command = XTP_THREAD_POOL or XTP_PREEPMTIVE_TASK • Examples – Offline Checkpoint – Log Apply – Merge docs

SPATIAL ENHANCEMENTS

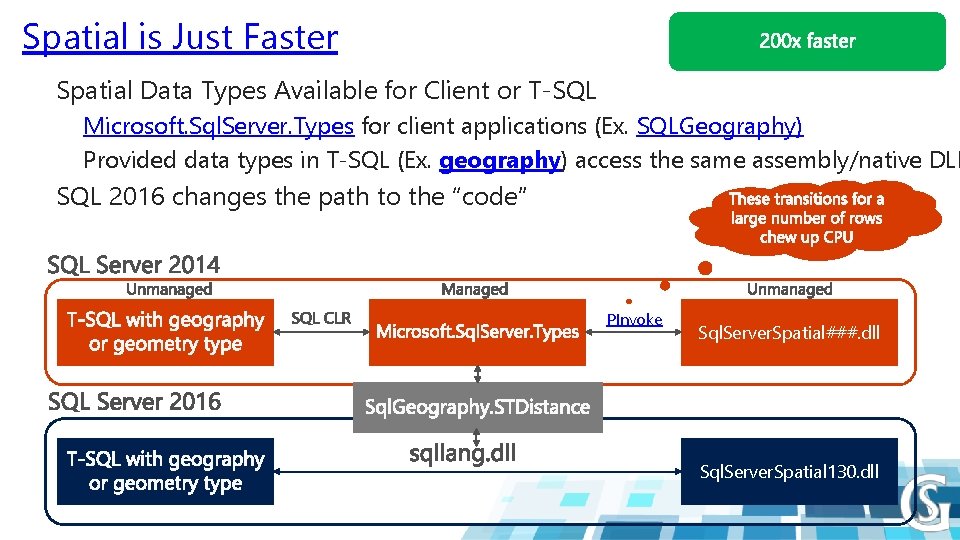
Spatial is Just Faster Spatial Data Types Available for Client or T-SQL Microsoft. Sql. Server. Types for client applications (Ex. SQLGeography) Provided data types in T-SQL (Ex. geography) access the same assembly/native DLL SQL 2016 changes the path to the “code” PInvoke Sql. Server. Spatial###. dll Sql. Server. Spatial 130. dll

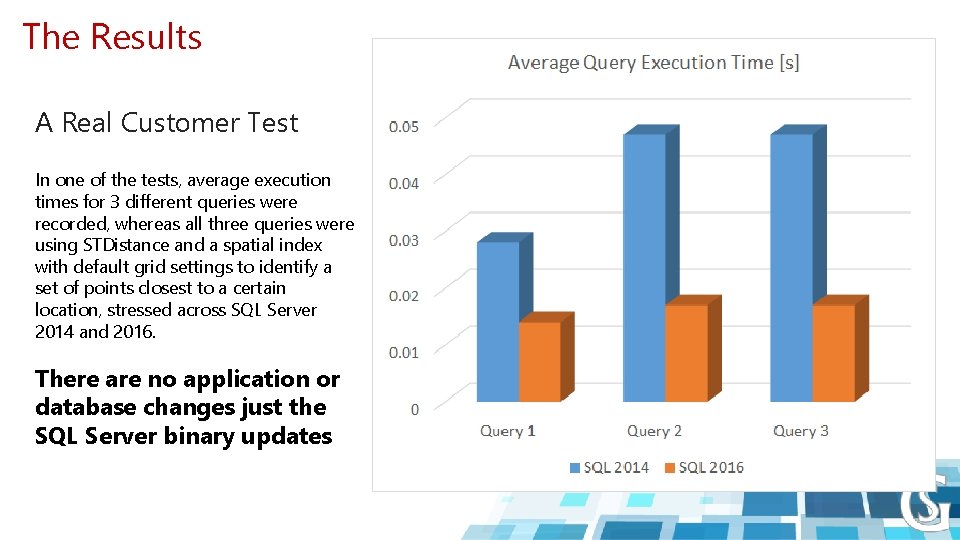
The Results A Real Customer Test In one of the tests, average execution times for 3 different queries were recorded, whereas all three queries were using STDistance and a spatial index with default grid settings to identify a set of points closest to a certain location, stressed across SQL Server 2014 and 2016. There are no application or database changes just the SQL Server binary updates

Spatial light years faster in SQL Server 2016 Demo

ALWAYS ON AVAILABILITY GROUPS ARE FASTER

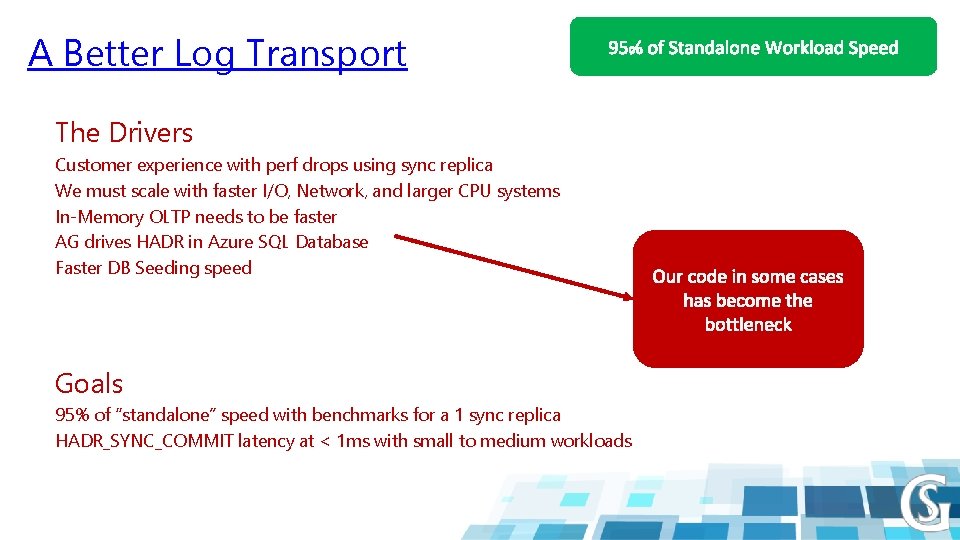
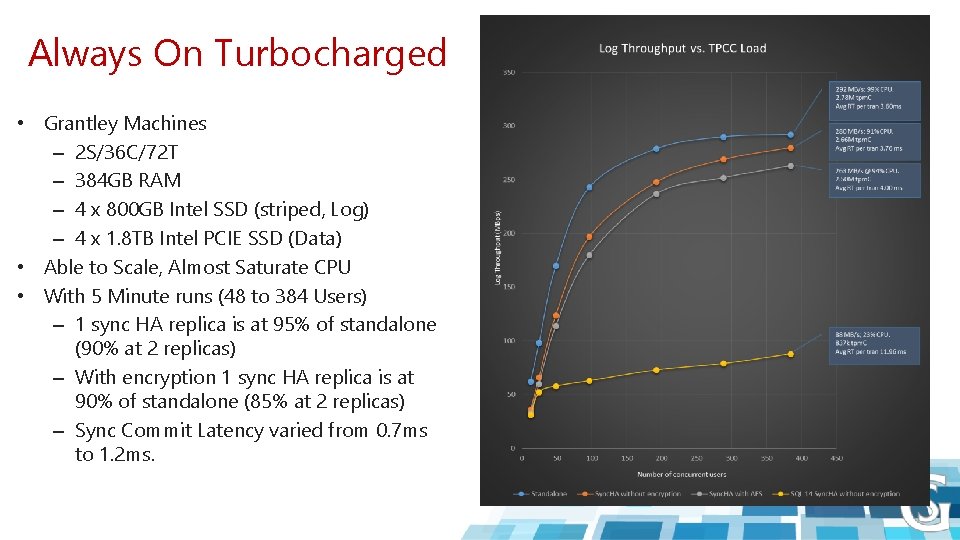
A Better Log Transport The Drivers Customer experience with perf drops using sync replica We must scale with faster I/O, Network, and larger CPU systems In-Memory OLTP needs to be faster AG drives HADR in Azure SQL Database Faster DB Seeding speed Goals 95% of “standalone” speed with benchmarks for a 1 sync replica HADR_SYNC_COMMIT latency at < 1 ms with small to medium workloads

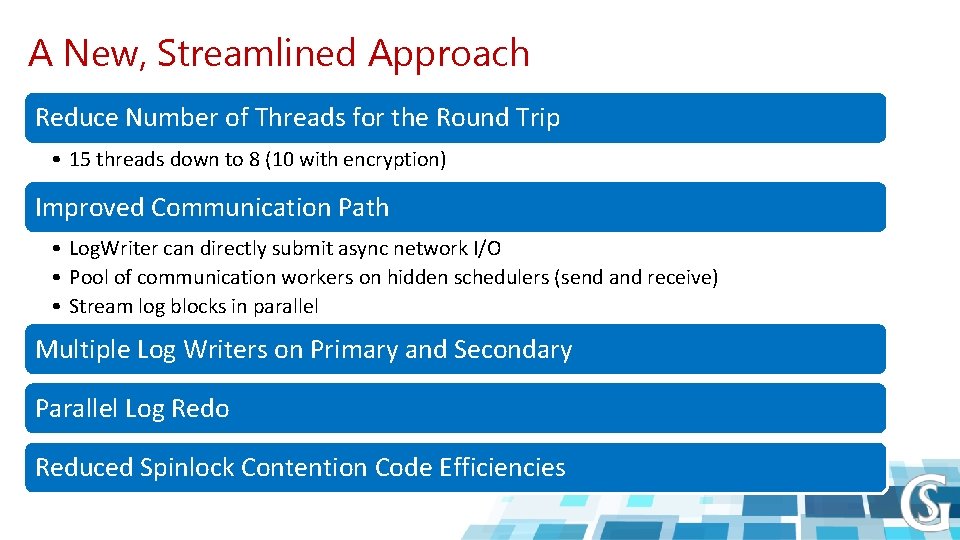
A New, Streamlined Approach Reduce Number of Threads for the Round Trip • 15 threads down to 8 (10 with encryption) Improved Communication Path • Log. Writer can directly submit async network I/O • Pool of communication workers on hidden schedulers (send and receive) • Stream log blocks in parallel Multiple Log Writers on Primary and Secondary Parallel Log Redo Reduced Spinlock Contention Code Efficiencies

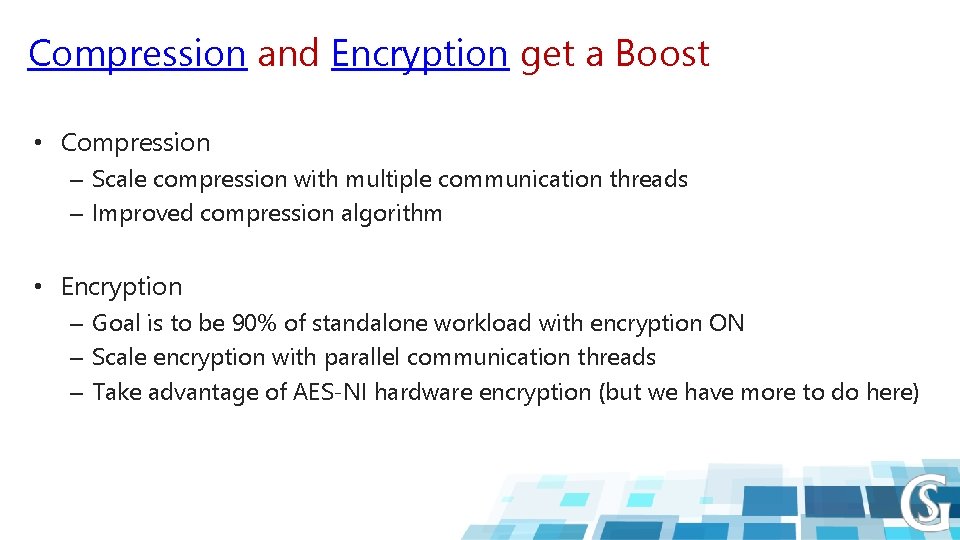
Compression and Encryption get a Boost • Compression – Scale compression with multiple communication threads – Improved compression algorithm • Encryption – Goal is to be 90% of standalone workload with encryption ON – Scale encryption with parallel communication threads – Take advantage of AES-NI hardware encryption (but we have more to do here)

Always On Turbocharged • Grantley Machines – 2 S/36 C/72 T – 384 GB RAM – 4 x 800 GB Intel SSD (striped, Log) – 4 x 1. 8 TB Intel PCIE SSD (Data) • Able to Scale, Almost Saturate CPU • With 5 Minute runs (48 to 384 Users) – 1 sync HA replica is at 95% of standalone (90% at 2 replicas) – With encryption 1 sync HA replica is at 90% of standalone (85% at 2 replicas) – Sync Commit Latency varied from 0. 7 ms to 1. 2 ms.

AND THERE IS MORE…

I forgot to mention these… • • Column Store uses Vector Instructions BULK INSERT uses Vector Instructions On Demand MSDTC Startup A Faster XEvent Reader

AND MORE IS TO BE REVEALED

We have more to brag blog about… • More Research and Blogging Coming… – – – Batch Mode Operators Parallel Redo Default database sizes 12 TB memory in Windows Server 2016 NVDIMM Parallel insert TDE uses AES-NI Reader/Writer Spinlock Sort Optimization Backup compression SMEP Query Compilation Gateways • Hekaton has a Bunch of Stuff Hekaton Inside – Individual files decoupled from FILESTREAM – ALTER TABLE runs in parallel and has reduced log requirements (metadata) – Statistics updated automatically

BONUS MATERIAL

Multiple Log Writers One Log. Writer for all Databases for Log Writes Multiple workers filling up log cache Log. Writer signaled via queue to write out log blocks Faster I/O Means Disk is no Longer a Bottleneck Disk is fast enough that Log. Writer could be the bottleneck If Log. Writer is processing the completion routine, then it can’t service the queue Seen in Hekaton and AG Secondary scenarios with fast disk systems For Scale, Just Add More of Them We will add one LW for each NUMA node up to 4 (point of diminishing returns) On hidden scheduler and all on NODE 0 slower

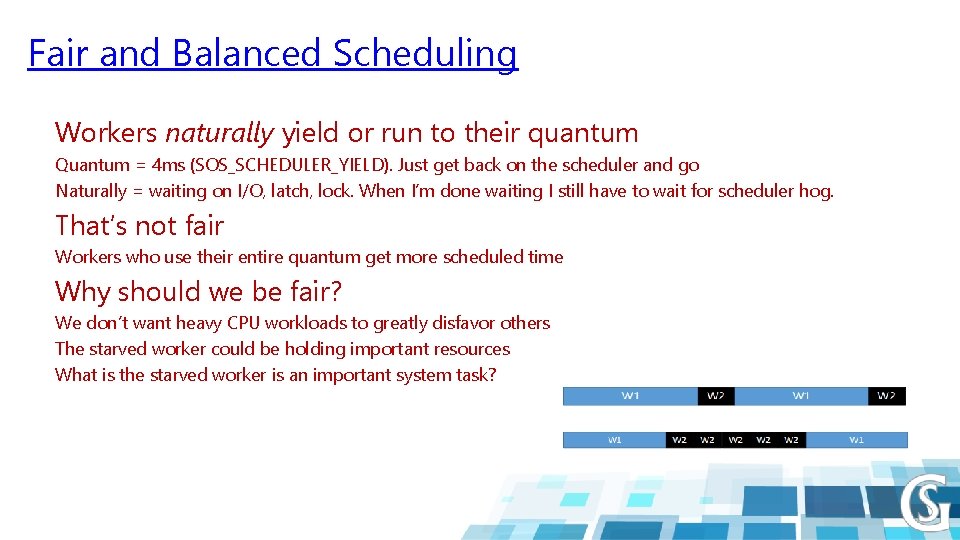
Fair and Balanced Scheduling Workers naturally yield or run to their quantum Quantum = 4 ms (SOS_SCHEDULER_YIELD). Just get back on the scheduler and go Naturally = waiting on I/O, latch, lock. When I’m done waiting I still have to wait for scheduler hog. That’s not fair Workers who use their entire quantum get more scheduled time Why should we be fair? We don’t want heavy CPU workloads to greatly disfavor others The starved worker could be holding important resources What is the starved worker is an important system task?

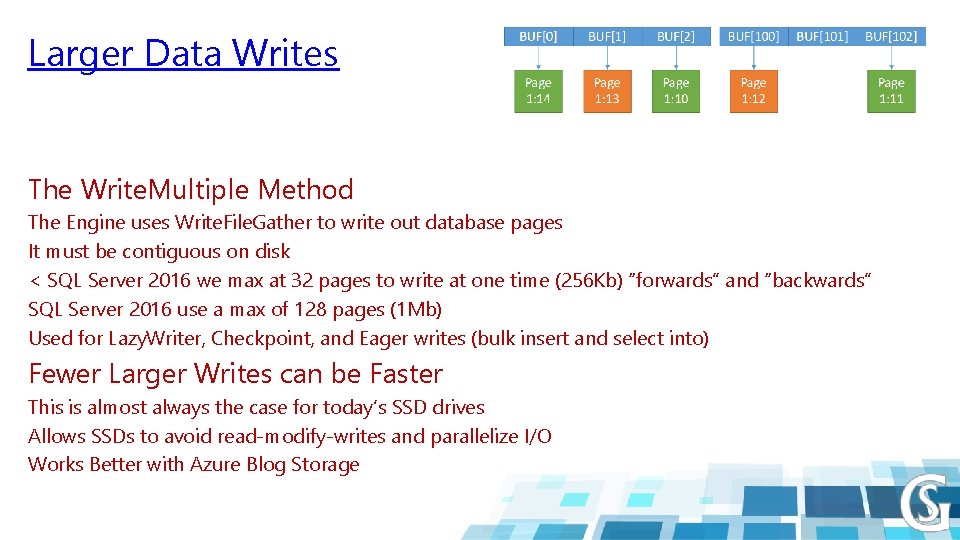
Larger Data Writes The Write. Multiple Method The Engine uses Write. File. Gather to write out database pages It must be contiguous on disk < SQL Server 2016 we max at 32 pages to write at one time (256 Kb) “forwards” and “backwards” SQL Server 2016 use a max of 128 pages (1 Mb) Used for Lazy. Writer, Checkpoint, and Eager writes (bulk insert and select into) Fewer Larger Writes can be Faster This is almost always the case for today’s SSD drives Allows SSDs to avoid read-modify-writes and parallelize I/O Works Better with Azure Blog Storage

DBCC CHECK* Extended Checks • Some Data Requires “Extended” Logical Checks – – Filtered indexes Persisted computed columns UDT columns based on CLR assemblies • This can Dramatically Slow Down CHECK* – These checks can be just as expensive as physical checks for a large database – PHYSICAL_ONLY was the only workaround • SQL Server 2016 by Default Skips these Checks – We have enhanced the EXTENDED_LOGICAL_CHECKS option if you want to check these – Filtered index checks are really “just faster” by skipping rows that don’t qualify for the index

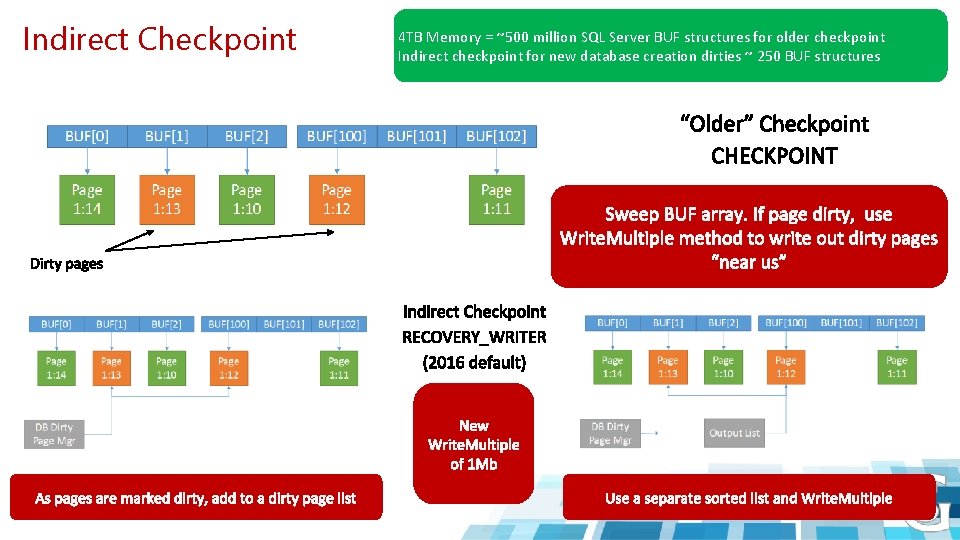
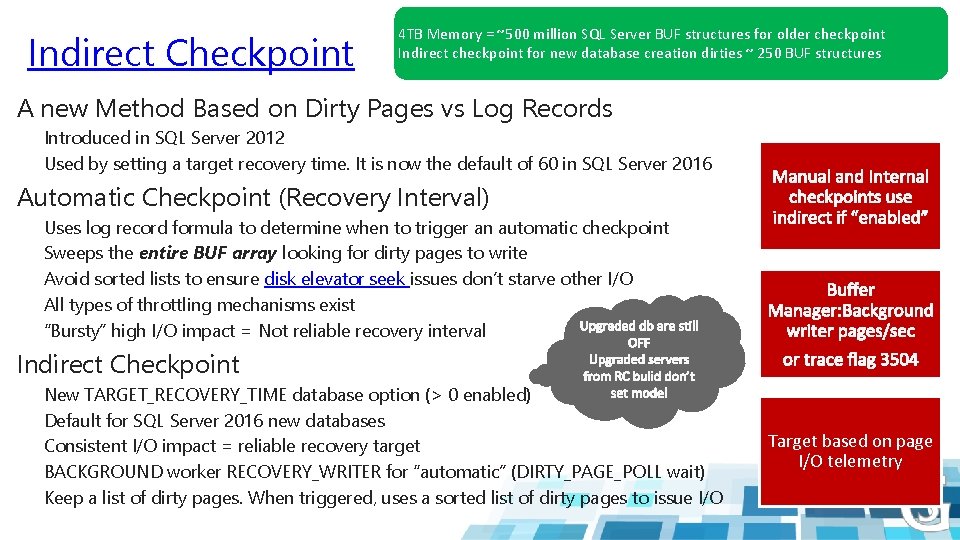
Indirect Checkpoint 4 TB Memory = ~500 million SQL Server BUF structures for older checkpoint Indirect checkpoint for new database creation dirties ~ 250 BUF structures

Indirect Checkpoint 4 TB Memory = ~500 million SQL Server BUF structures for older checkpoint Indirect checkpoint for new database creation dirties ~ 250 BUF structures A new Method Based on Dirty Pages vs Log Records Introduced in SQL Server 2012 Used by setting a target recovery time. It is now the default of 60 in SQL Server 2016 Automatic Checkpoint (Recovery Interval) Uses log record formula to determine when to trigger an automatic checkpoint Sweeps the entire BUF array looking for dirty pages to write Avoid sorted lists to ensure disk elevator seek issues don’t starve other I/O All types of throttling mechanisms exist “Bursty” high I/O impact = Not reliable recovery interval Indirect Checkpoint New TARGET_RECOVERY_TIME database option (> 0 enabled) Default for SQL Server 2016 new databases Consistent I/O impact = reliable recovery target BACKGROUND worker RECOVERY_WRITER for “automatic” (DIRTY_PAGE_POLL wait) Keep a list of dirty pages. When triggered, uses a sorted list of dirty pages to issue I/O Target based on page I/O telemetry

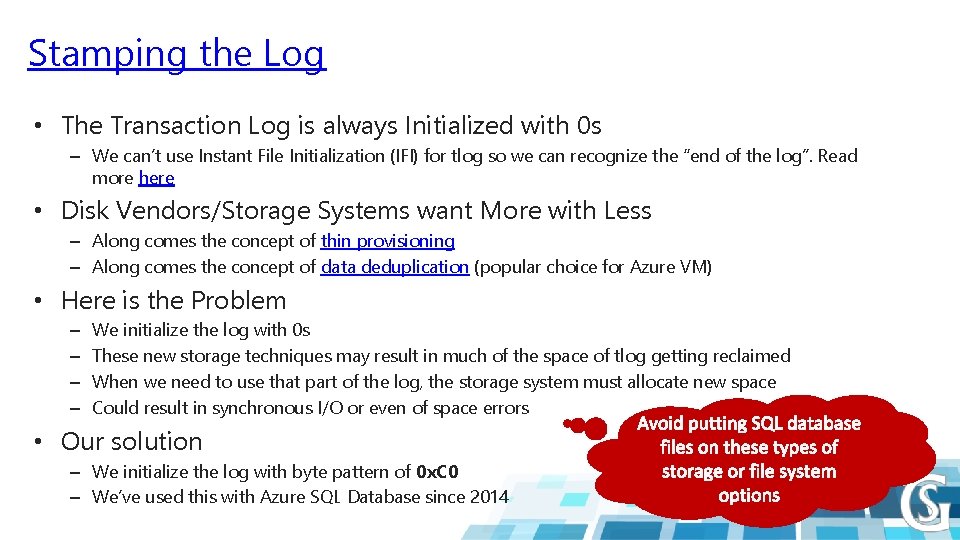
Stamping the Log • The Transaction Log is always Initialized with 0 s – We can’t use Instant File Initialization (IFI) for tlog so we can recognize the “end of the log”. Read more here • Disk Vendors/Storage Systems want More with Less – Along comes the concept of thin provisioning – Along comes the concept of data deduplication (popular choice for Azure VM) • Here is the Problem – – We initialize the log with 0 s These new storage techniques may result in much of the space of tlog getting reclaimed When we need to use that part of the log, the storage system must allocate new space Could result in synchronous I/O or even of space errors • Our solution – We initialize the log with byte pattern of 0 x. C 0 – We’ve used this with Azure SQL Database since 2014

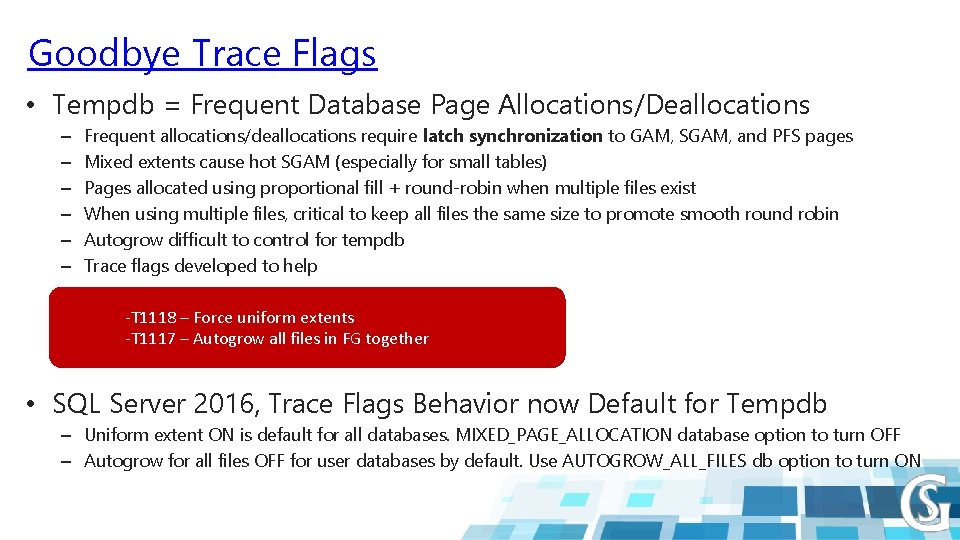
Goodbye Trace Flags • Tempdb = Frequent Database Page Allocations/Deallocations – – – Frequent allocations/deallocations require latch synchronization to GAM, SGAM, and PFS pages Mixed extents cause hot SGAM (especially for small tables) Pages allocated using proportional fill + round-robin when multiple files exist When using multiple files, critical to keep all files the same size to promote smooth round robin Autogrow difficult to control for tempdb Trace flags developed to help -T 1118 – Force uniform extents -T 1117 – Autogrow all files in FG together • SQL Server 2016, Trace Flags Behavior now Default for Tempdb – Uniform extent ON is default for all databases. MIXED_PAGE_ALLOCATION database option to turn OFF – Autogrow for all files OFF for user databases by default. Use AUTOGROW_ALL_FILES db option to turn ON

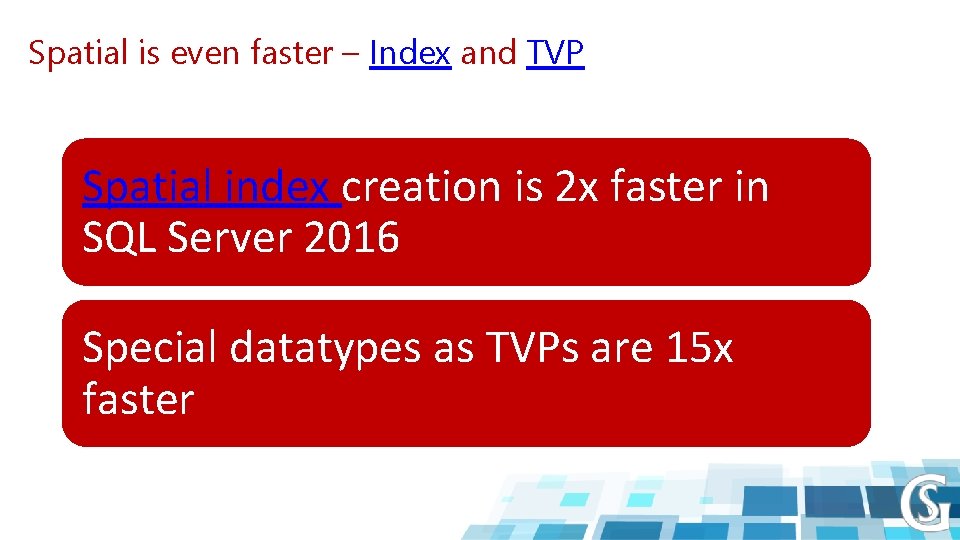
Spatial is even faster – Index and TVP Spatial index creation is 2 x faster in SQL Server 2016 Special datatypes as TVPs are 15 x faster

A Big Thanks to Our Sponsors

Thank you for your time! Share your selfie with hashtag #SSGAS 2016 and win cool prizes Connect us with us: @SQLServer. Geeks facebook. com/groups/the. SQLGeeks www. SQLServer. Geeks. com admin@SQLServer. Geeks. com