Spectrophotometer Continue Dr Fadhl Alakwaa 2013 2014 Third


 Filters Colored glass Interference filter Monochromator Prisms.")


 stable radiation")

 • Visible Spectrophotometer Glass • IR Spectrophotometer")


 • UV, visible, and IR radiation can be dispersed")


 cm long, or 2. 358")


- Slides: 39
Spectrophotometer –Continue Dr Fadhl Alakwaa 2013 -2014 Third Year Biomedical Engineering Department www. Fadhl-alakwa. weebly. com
AGENDA • • • Atomic Absorption Spectrometry Photometry: Atomic Emission Spectroscopy Fluorometer Configuration of the spectroscopy systems spectrophotometer components: 1 - Radiation source Continuum sources Line source
AGENDA- Continue 2 -Wavelength Selection Devices(Resolution Power) Filters Colored glass Interference filter Monochromator Prisms. Diffraction Gratings. 3 - Detectors Photovoltaic cell Phototube Photomultiplier tube (PMT)
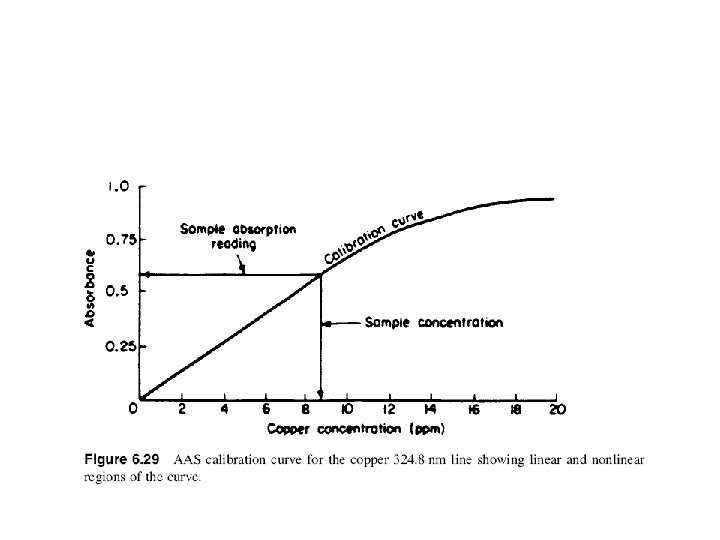
Atomic Absorption Spectrometry • AAS is an elemental analysis technique capable of providing quantitative information on 70 elements in almost any type of sample. • AAS are that no information is obtained on the chemical form of the analyte (no “speciation”) and that often only one element can be determined at a time. • This last disadvantage makes AAS of very limited use for qualitative analysis. • AAS is used almost exclusively for quantitative analysis of elements, hence the use of the term “spectrometry” in the name of the technique instead of “spectroscopy”.
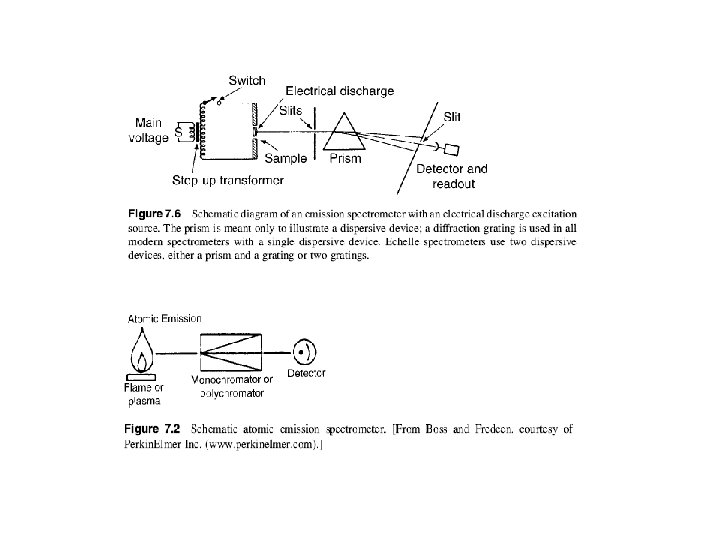
Atomic Emission Spectroscopy • Atomic emission spectroscopy has relied in the past on flames and electrical discharges as excitation sources, but these sources have been overtaken by plasma sources, such as the inductively coupled plasma (ICP) source. • Atomic emission spectroscopy is a multielement technique with the ability to determine metals, metalloids, and some nonmetal elements simultaneously. • The major difference between the various types of atomic emission spectroscopy techniques lies in the source of excitation and the amount of energy imparted to the atoms or ions (i. e. , the excitation efficiency of the source).
Photometry: Flame atomic emission spectroscopy • Flame atomic emission spectrometry is particularly useful for the determination of the elements in the first two groups of the periodic table, including sodium, potassium, lithium, calcium, magnesium, strontium, and barium. • The determination of these elements is often called for in medicine, agriculture, and animal science.
Photometry Application • Flame photometry is used for the quantitative determination of alkaline metals and alkalineearth metals in blood, serum, and urine in clinical laboratories. It provides much simpler spectra than those found in other types of atomic emission spectrometry, but its sensitivity is much reduced. • sodium, potassium, magnesium and calcium in blood
MOLECULAR EMISSION SPECTROMETRY
Fluorometer
Fluorometer Application • Fluorometry is used in the analysis of clinical samples, pharmaceuticals, natural products, and environmental samples. • There are fluorescence methods for steroids, lipids, proteins, amino acids, enzymes, drugs, inorganic electrolytes, chlorophylls, natural and synthetic pigments, vitamins, and many other types of analytes.
Spectroscopy components • • • Many optical instruments share similar design (1) stable radiation source (2) transparent sample holder (3) wavelength selector (dispersive) (4) radiation detector (5) signal processor and readout
Light Sources UV Spectrophotometer 1. Hydrogen Gas Lamp 2. Mercury Lamp Visible Spectrophotometer 1. Tungsten Lamp Infra. Red (IR) Spectrophotometer 1. Carborundum (SIC)
Cells • UV Spectrophotometer Quartz (crystalline silica) • Visible Spectrophotometer Glass • IR Spectrophotometer Na. Cl
Configuration of the spectroscopy systems
Radiation Source • An ideal radiation source for spectroscopy should have the following characteristics: 1. The source must emit radiation over the entire wavelength range to be studied. 2. The intensity of radiation over the entire wavelength range must be high enough so that extensive amplification of the signal from the detector can be avoided. 3. The intensity of the source should not vary significantly at different wavelengths. 4. The intensity of the source should not fluctuate over long time intervals. 5. The intensity of the source should not fluctuate over short time intervals. Short time fluctuation in source intensity is called “flicker”.
• Most sources will have their intensities change exponentially with changes in voltage, so in all cases a reliable, steady power supply to the radiation source is required. • Voltage regulators (also called line conditioners) are available to compensate for variations in incoming voltage.
Radiation Source And Detectors Fig 7. 3
Continuum sources • Continuum sources emit radiation over a wide range of wavelengths and the intensity of emission varies slowly as a function of wavelength. • Typical continuum sources include : • the tungsten filament lamp which produces visible radiation (white light), • the deuteriumlamp for the. UVregion, • high pressure mercury or xenon arc lamps for the UV region, • and heated solid ceramics or heated wires for the IR region of the spectrum. • Xenon arc lamps are also used for the visible region. • Continuum sources are used for most molecular absorption and fluorescence spectrometric instruments.
Line sources • Emit only a few discrete wavelengths of light, and the intensity is a strong function of the wavelength. • Typical line sources include: • hollow cathode lamps and • electrodeless discharge lamps, used in the UV and visible regions for AAS and atomic fluorescence spectrometry, • sodium or mercury vapor lamps (similar to the lamps now used in street lamps) for lines in the UV and visible regions, and lasers. • They are used as sources in Raman spectroscopy, molecular and atomic fluorescence spectroscopy.
Wavelength Selection Devices • Filters – absorption filters Colored glass – Interference filter • Monochromator – The entrance slit – Prisms. – Diffraction Gratings.
Wavelength selector Fig 7. 2
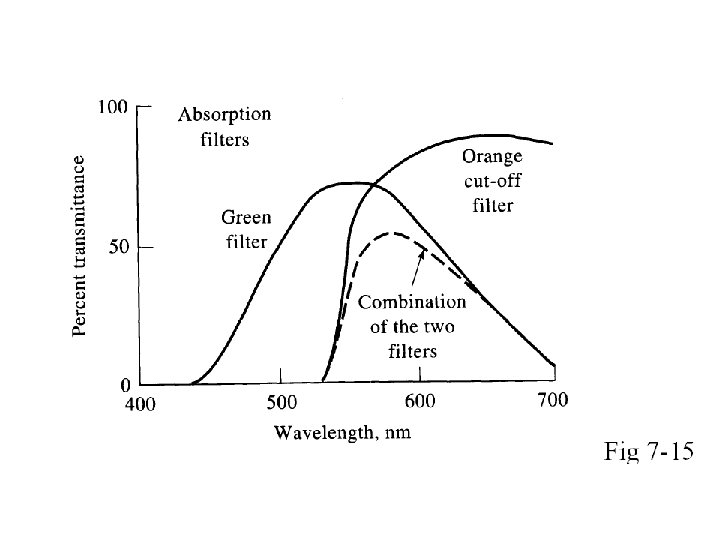
Colored glass • stable, simple, and cheap, • blue glass transmits blue wavelengths of the visible spectrum but absorbs red and yellow wavelengths. • The range of wavelengths transmitted is broad compared with prisms and gratings which are also devices used to select a narrow wavelength range from a broad band polychromatic source. The transmission range may be 50– 300 nm for typical absorption filters.
Interference Filter • two thin sheets of metal sandwiched between glass plates, separated by transparent material. • Interference filters can be constructed for transmission of light in the IR, visible, and UV regions of the spectrum. • The wavelength ranges transmitted are much smaller than for absorption filters, generally 1– 10 nm, and the amount of light transmitted is generally higher than for absorption filters.
Interference Filter • The filter operates on the principle of constructive interference to transmit selected wavelength ranges. The wavelengths transmitted are controlled by the thickness and refractive index of the center layer of material. • Interference for transmitted wave through 1 st layer and reflected from 2 nd layer
Prisms are used to disperse IR, visible, and UV radiation. The most common prisms are constructed of quartz for the UV region, silicate glass for the visible and near-IR region, and Na. Cl or KBr for the IR region.
Diffraction Grating (most modern instruments) • UV, visible, and IR radiation can be dispersed by a diffraction grating. • A diffraction grating consists of a series of closely spaced parallel grooves cut (or ruled) into a hard glass, metallic, or ceramic surface. • A grating for use in the UV and visible regions will contain between 500 and 5000 grooves/mm, • while a grating for the IR region will have between 50 and 200 grooves/mm. d, the distance between grooves n, the order of diffraction.
Resolution Power • Resolution Required to Separate Two Lines of Different Wavelength. • Ex: in order to observe an absorption band at 599. 9 nm without interference from an absorption band at 600. 1 nm, we must be able to resolve, or separate, the two bands. • The resolving power R of a monochromator is equal to λ/ dλ, where λ is the average of the wavelengths of the two lines to be resolved and dλ is the difference in wavelength between these lines.
Prism Resolution Power • refractive index of the prism material • t is the thickness of the base of the prism • glass prisms disperse visible light better than quartz prisms.
Resolution of a Grating. • where n is the order and N is the total number of grooves in the grating. • Ex: Suppose that we can obtain a grating with 500 lines/cm. How long a grating would be required to separate the sodium D lines at 589. 5 and 589. 0 nm in first order?
R=1179=n. N For first order n=1 N=1179 lines (1179/500) cm long, or 2. 358 cm. Ex 2: how many lines per centimeter must be cut on a grating 3. 00 cm long to resolve the same sodium D lines? • n. N =N =1179 • 1179 l 3: 00 cm= 393 lines/cm • •
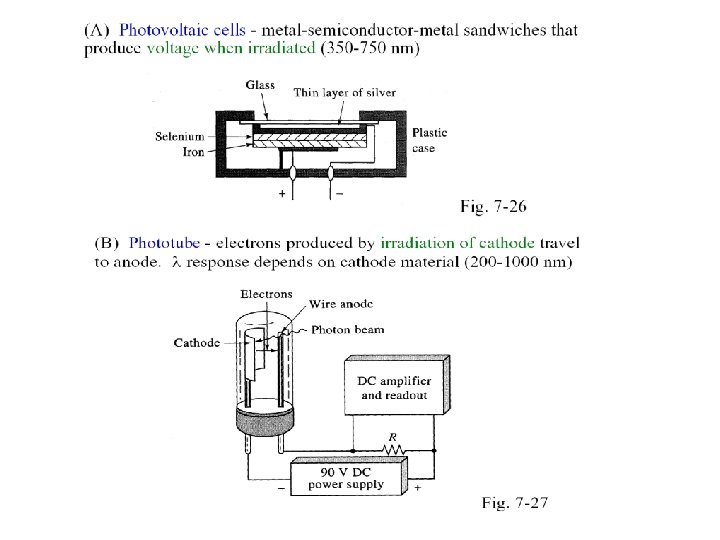
Detectors • There a number of different types of photon detectors, including the photomultiplier tube, the silicon photodiode, the photovoltaic cell, and a class of multichannel detectors called charge transfer devices. • Charge transfer detectors include photodiode arrays, charge-coupled devices (CCDs), and charge-injection devices (CIDs). • These detectors are used in the UV/VIS and IR regions for both atomic and molecular spectroscopy.
Photomultiplier tube PMT
PAGE 106 EXAMPLE 2 • A photomultiplier with 12 dynodes each of multiplication factors 4. its output feeds an operation of amplifier with a feedback resistor of 10 mega ohm find: • The minimum rate of incident photons • The minimum rate of quantum energy of UV radiation of wavelength 250 nm incident on the photomultiplier cathode to produce a potential difference of 2 volt across this feedback resistor?
Radiation Source And Detectors Fig 7. 3
INSERT LECTURE IS THE MIDTERM EXAM.