SPECTROPHOTOMETRY IN BIOTECHNOLOGY TOPICS n n n n

SPECTROPHOTOMETRY IN BIOTECHNOLOGY

TOPICS n n n n Spectrophotometers in Biotechnology Light and its Interactions with Matter Spectrophotometer Design Spectrophotometer Operation Qualitative Spectrophotometry Quantitative Spectrophotometry UV Spectrophotometry of DNA, RNA and Proteins Calibration of Spectrophotometers lseidman@matcmadison. edu

BIOTECHNOLOGY PROCESS Find gene that codes for useful protein Isolate gene Insert gene into vector Insert vector into cells (transform/transfect cells) Grow cells, cells manufacture protein product Purify product Sell product lseidman@matcmadison. edu

BIOTECHNOLOGY PROCESS Find gene that codes for useful protein Isolate gene Estimate DNA [ ] Insert gene into vector Check cell density Insert vector into cells (transform/transfect cells) Grow cells, cells manufacture protein product Purify product Sell product lseidman@matcmadison. edu Check protein activity Check protein concentration Check protein purity

n Spectrophotometers in Biotechnology n Light and its Interactions with Matter n Spectrophotometer Design Spectrophotometer Operation Qualitative Spectrophotometry Quantitative Spectrophotometry n UV Spectrophotometry of DNA, RNA and Proteins n Calibration of Spectrophotometers n n n lseidman@matcmadison. edu

LIGHT IS A TYPE OF ELECTROMAGNETIC RADIATION n Imagine electromagnetic radiation like waves on a pond q q But instead of water, electromagnetic radiation is energy moving through space Distance from one crest to the next is the wavelength lseidman@matcmadison. edu

WAVELENGTH AND COLOR n n Different wavelengths of light correspond to different colors All colors blended together is called white light The absence of all light is black Light of slightly shorter wavelengths is ultraviolet q Eyes do not perceive UV light lseidman@matcmadison. edu
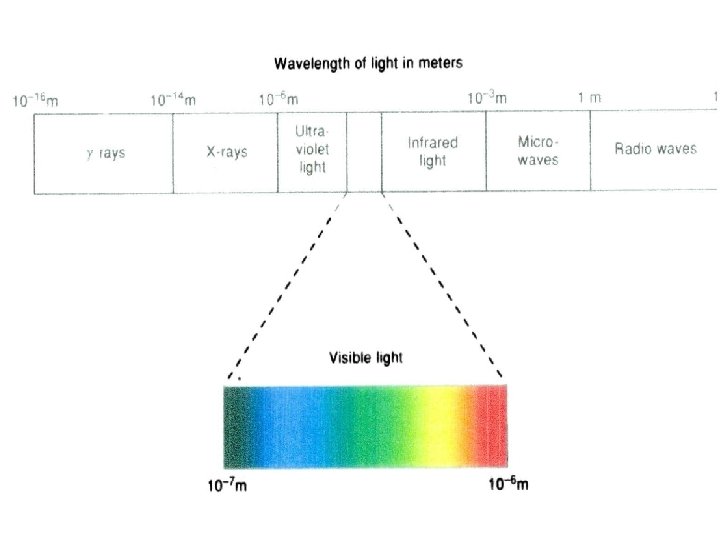

WAVELENGTH OF VISIBLE LIGHT AND COLOR WAVELENGTH COLOR PERCEIVED 380 -430 Violet 430 -475 Blue 475 -495 Greenish Blue 495 -505 Bluish Green 505 -555 Green 555 -575 Yellowish Green 575 -600 Yellow 600 -650 Orange 650 -780 Red

INTERACTION OF LIGHT WITH MATERIALS IN SOLUTION When light shines on a solution, it may pass through – be transmitted – or n Some or all of the light energy may be absorbed n lseidman@matcmadison. edu
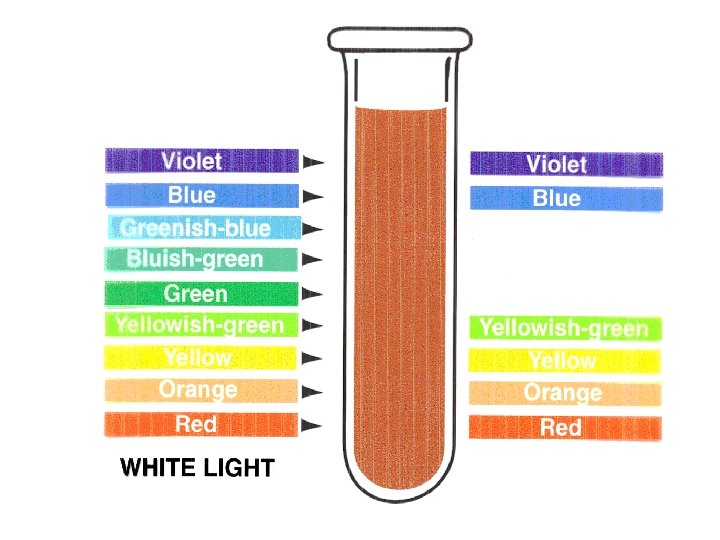

THE ABSORPTION OF LIGHT AND COLOR OF SOLUTIONS WAVELENGTH OF LIGHT ABSORBED COLOR OF SOLUTION 380 -430 Violet Yellow 430 -475 Blue Orange 475 -495 Greenish Blue Red-Orange 495 -505 Bluish Green Orange-Red 505 -555 Green Red 555 -575 Yellowish Green Violet-Red 575 -600 Yellow Violet 600 -650 Orange Blue 650 -780 Red Green lseidman@matcmadison. edu

BIOLOGICAL SOLUTIONS n n n Usually appear clear to our eyes – have no color DNA, RNA, most proteins do not absorb any visible light But they do absorb UV light, so UV spectrophotometers are useful to biologists q Example, can use a detector that measures absorbance at 280 nm, or 254 nm to detect proteins lseidman@matcmadison. edu

n n Spectrophotometers in Biotechnology Light and its Interactions with Matter n Spectrophotometer n n n Design Spectrophotometer Operation Qualitative Spectrophotometry Quantitative Spectrophotometry UV Spectrophotometry of DNA, RNA and Proteins Calibration of Spectrophotometers lseidman@matcmadison. edu

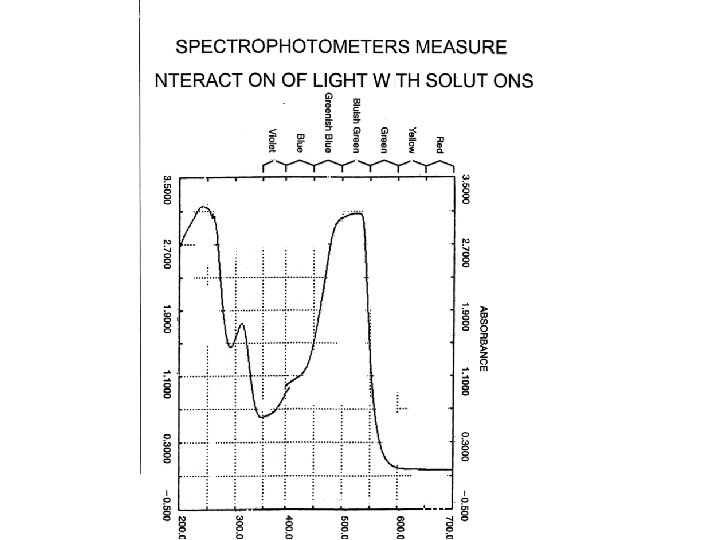
SPECTROPHOTOMETERS n Are instruments that measure the interaction of light with materials in solution lseidman@matcmadison. edu

Monochromator Separates Light into Its Component Wavelengths. Modern Specs Use Diffraction Gratings

n n n Spectrophotometers in Biotechnology Light and its Interactions with Matter Spectrophotometer Design n Spectrophotometer n n Operation Qualitative Spectrophotometry Quantitative Spectrophotometry UV Spectrophotometry of DNA, RNA and Proteins Calibration of Spectrophotometers lseidman@matcmadison. edu

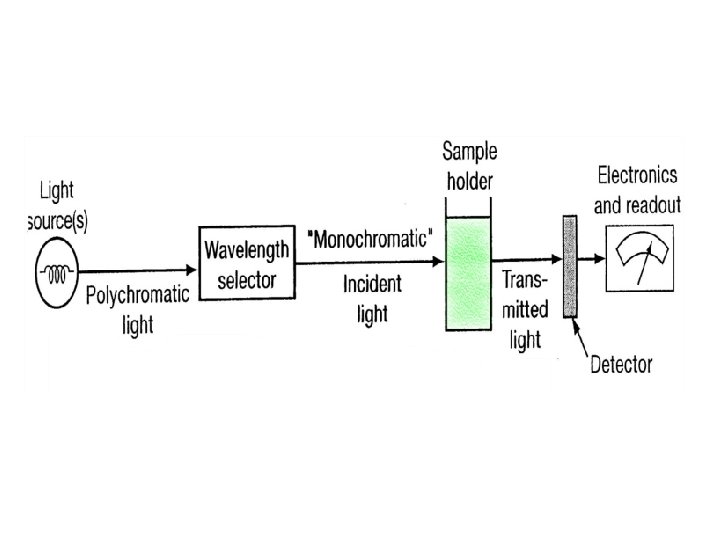
THE BLANK n n n Spectrophotometers compare the light transmitted through a sample to the light transmitted through a blank. The blank is treated just like the sample The blank contains everything except the analyte (the material of interest) q q Contains solvent Contains whatever reagents are added to the sample lseidman@matcmadison. edu
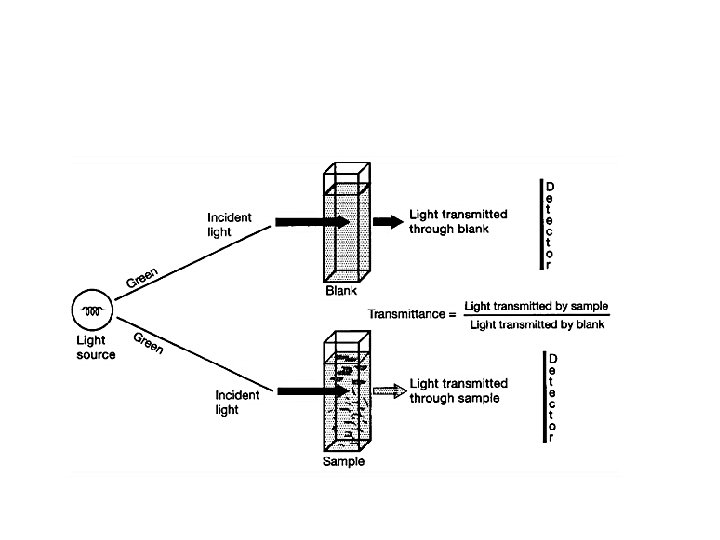

WHEN OPERATING SPEC n n Blank is inserted into the spectrophotometer Instrument is set to 100% transmittance or zero absorbance lseidman@matcmadison. edu

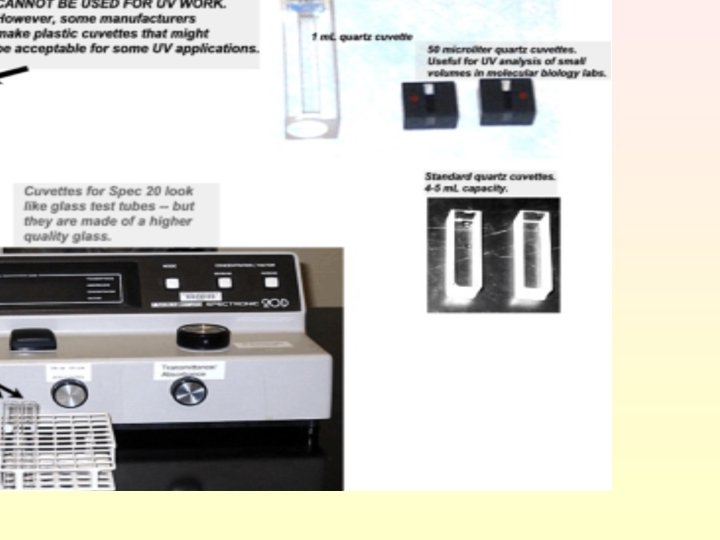
PROPER SELECTION, USE, AND CARE OF CUVETTES Cuvettes are made from plastic, glass, or quartz. 1. a. b. c. Use quartz cuvettes for UV work. Glass, plastic or quartz are acceptable visible work. There are inexpensive plastic cuvettes that may be suitable for some UV work. lseidman@matcmadison. edu
. Use them properly")
2. Cuvettes are expensive and fragile (except for “disposable” plastic ones). Use them properly and carefully. Do not scratch cuvettes; do not store them in wire racks or clean with brushes or abrasives. b. Do not allow samples to sit in a cuvette for a long period of time. c. Wash cuvettes immediately after use. a. lseidman@matcmadison. edu

3. Disposable cuvettes are often recommended for colorimetric protein assays, since dyes used for proteins tend to stain cuvettes and are difficult to remove. 4. Matched cuvettes are manufactured to absorb light identically so that one of the pair can be used for the sample and the other for the blank. lseidman@matcmadison. edu

5. Do not touch the base of a cuvette or the sides through which light is directed. 6. Make sure the cuvette is properly aligned in the spectrophotometer. 7. Be certain to only use clean cuvettes. lseidman@matcmadison. edu

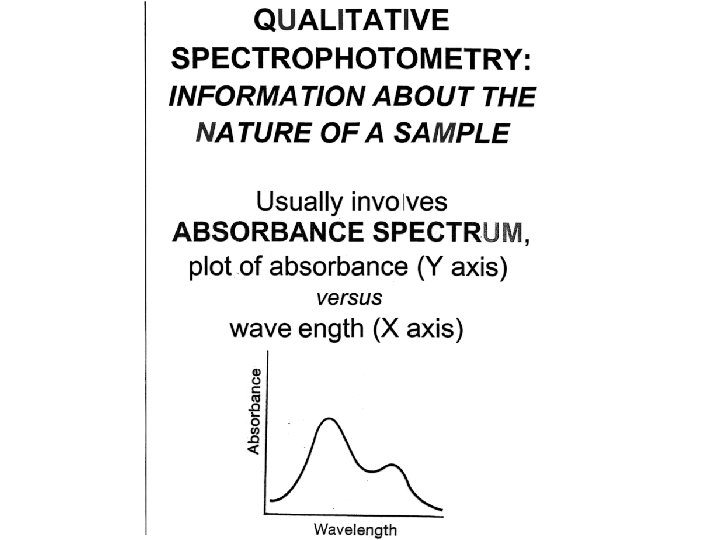
n n Spectrophotometers in Biotechnology Light and its Interactions with Matter Spectrophotometer Design Spectrophotometer Operation n Qualitative n n n Spectrophotometry Quantitative Spectrophotometry UV Spectrophotometry of DNA, RNA and Proteins Calibration of Spectrophotometers lseidman@matcmadison. edu

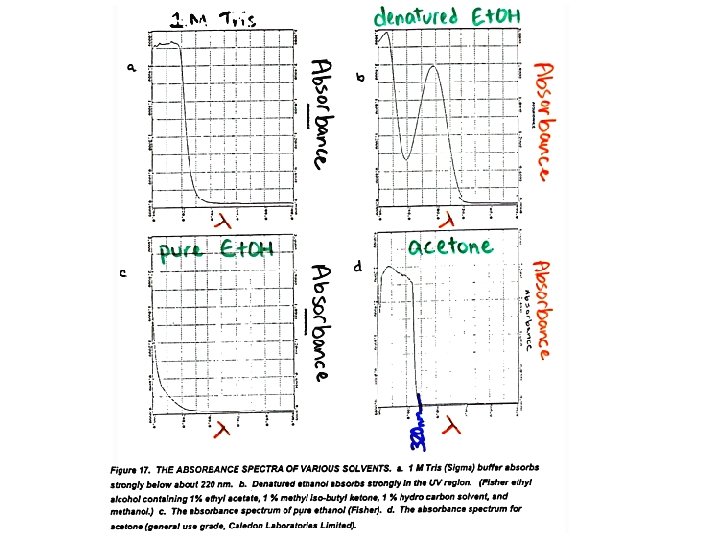
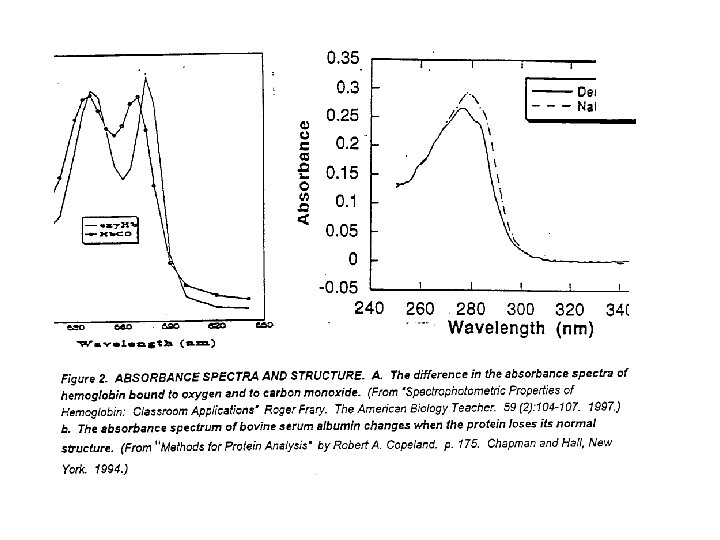
EXAMPLES n Some examples of qualitative spectrophotometry q q q The absorbance spectra of various common solvents. Note that some solvents absorb light at the same wavelengths as DNA, RNA, and proteins Hemoglobin bound to oxygen versus carbon monoxide Native versus denatured bovine serum albumin (a protein commonly used in the lab) lseidman@matcmadison. edu

n n n Spectrophotometers in Biotechnology Light and its Interactions with Matter Spectrophotometer Design Spectrophotometer Operation Qualitative Spectrophotometry n Quantitative n n Spectrophotometry UV Spectrophotometry of DNA, RNA and Proteins Calibration of Spectrophotometers lseidman@matcmadison. edu
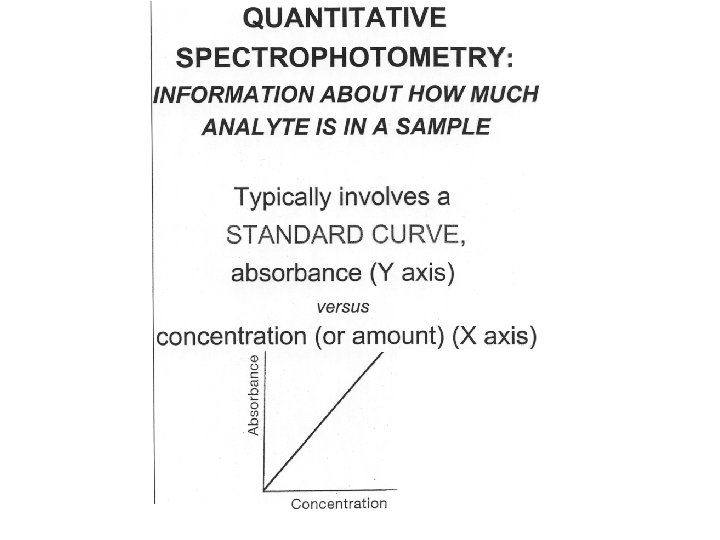

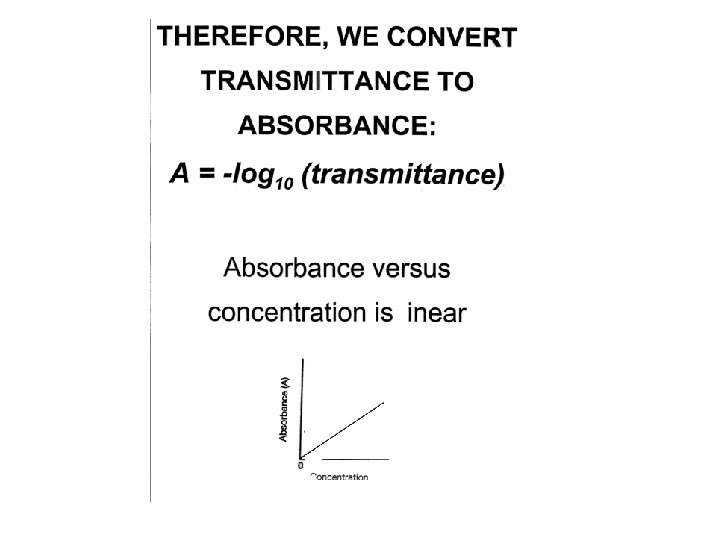
OVERVIEW OF QUANTITIVE SPECTROPHOTOMETRY A. Measure the absorbance of standards containing known concentrations of the analyte B. Plot a standard curve with absorbance on the X axis and analyte concentration on the Y axis C. Measure the absorbance of the unknown(s) D. Determine the concentration of material of interest in the unknowns based on the standard curve lseidman@matcmadison. edu

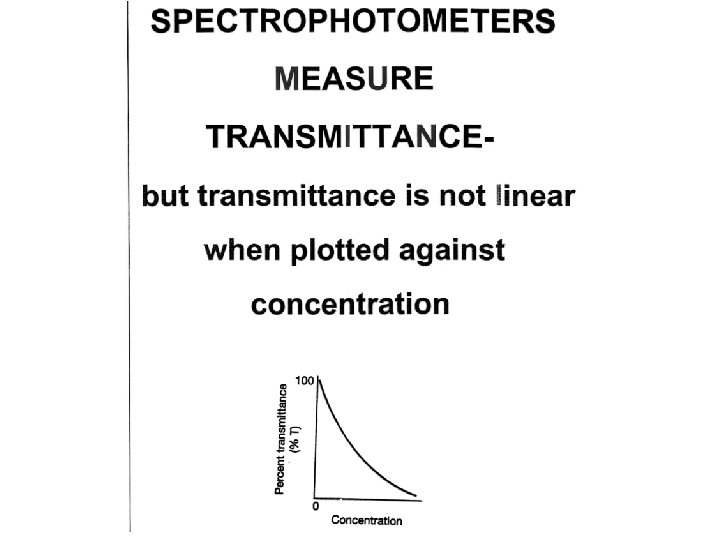
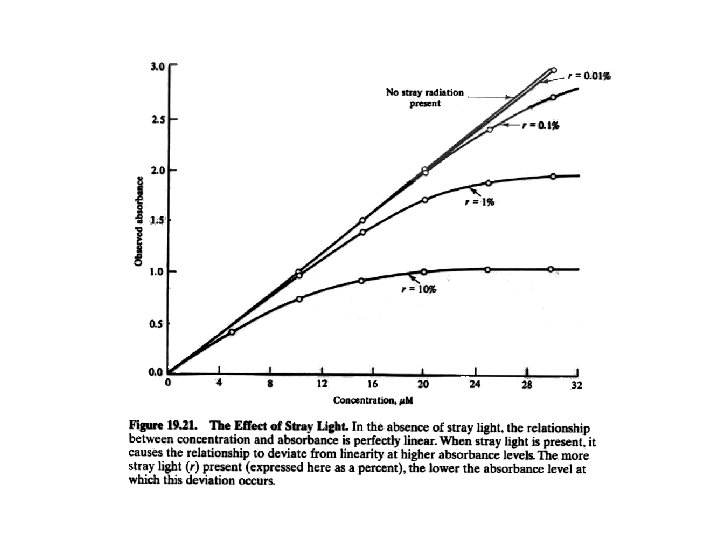
LINEAR RANGE n If there is too much or too little analyte, spectrophotometer cannot read the absorbance accurately lseidman@matcmadison. edu

COLORIMETRIC ASSAYS n n n Quantitative assays of materials that do not intrinsically absorb visible light Combine the sample with reagents that make the analyte colored The amount of color is proportional to the amount of analyte present lseidman@matcmadison. edu

BRADFORD PROTEIN ASSAY n n A quantitative colorimetric assay Used to determine the concentration, or amount, of protein in a sample lseidman@matcmadison. edu

n n Prepare standards with known protein concentrations Add Bradford Reagent to the samples and to standards q q n Read absorbances Create a standard curve Determine the concentration of protein in the samples based on the standard curve lseidman@matcmadison. edu

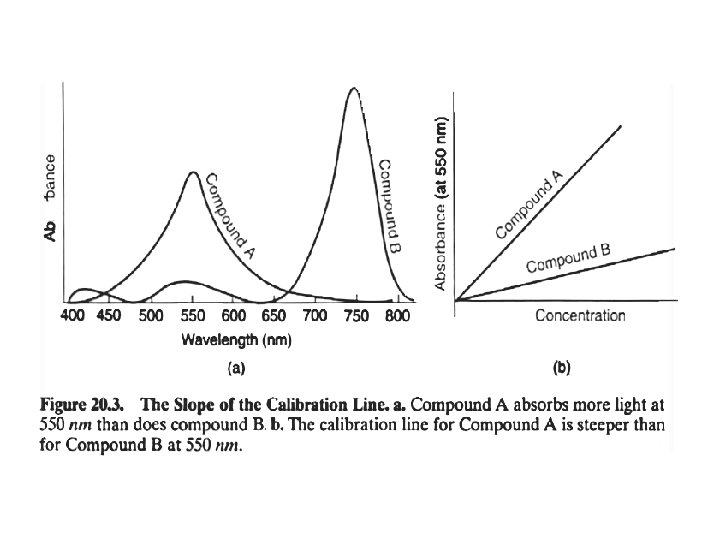
MORE ABOUT THE CALIBRATION LINE ON A STANDARD CURVE n Three things determine the absorbance of a sample: q q q The concentration of analyte in the sample The path length through the cuvette The intrinsic ability of the analyte to absorb light at the wavelength of interest lseidman@matcmadison. edu

BEER-LAMBERT LAW A = B C Where: A = absorbance at a particular wavelength = absorptivity constant – intrinsic ability of analyte to absorb light at a particular wavelength B = path length through cuvette C = concentration of analyte lseidman@matcmadison. edu

APPLYING THE EQUATION n Suppose you have a sample: q q n And you know the path length And you know the absorptivity constant for the analyte of interest at a particular wavelength Then, measure the sample’s absorbance at the specified wavelength lseidman@matcmadison. edu

n Can calculate the concentration of the analyte from the Beer-Lambert equation A = B C n But this is a shortcut that may give inaccurate results! lseidman@matcmadison. edu

EQUATION FOR A LINE A = B C y = m x +0 lseidman@matcmadison. edu

Y intercept should be zero because of the blank q Blank has no analyte (zero concentration) and is used to set transmittance to 100% = absorbance to zero lseidman@matcmadison. edu

SLOPE n Slope relates to the absorptivity constant A = y = B m C x +0 lseidman@matcmadison. edu

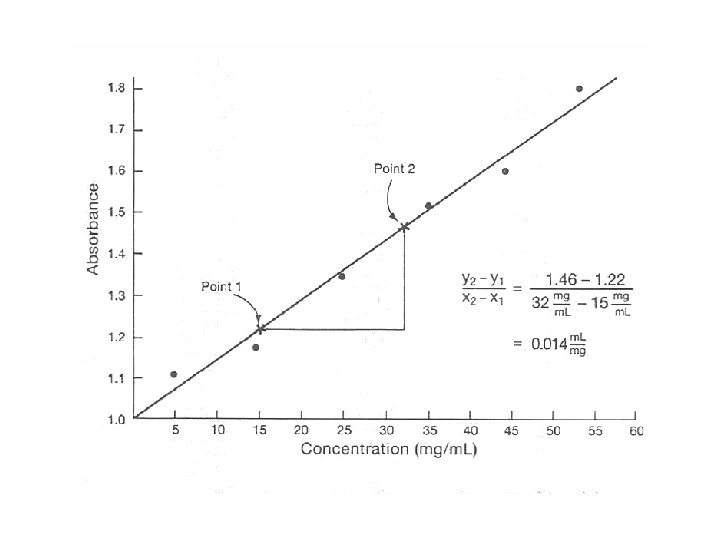
DETERMINATION OF THE ABSORPTIVITY CONSTANT 1. Prepare a calibration line based on a series of standards Plot concentration on the X axis and absorbance on the Y axis 2. Calculate the slope of the calibration line: Y 2 – Y 1 X 2 - X 1 lseidman@matcmadison. edu

3. Determine the path length for the system (assume 1 cm for a standard sample holder and cuvette) lseidman@matcmadison. edu

A = y = 3. B m C x +0 Slope = absorptivity constant X path length Absorptivity constant = slope path length (Observe that the constant has units that depend on how concentration was expressed in the standards) lseidman@matcmadison. edu

n n n Spectrophotometers in Biotechnology Light and its Interactions with Matter Spectrophotometer Design Spectrophotometer Operation Qualitative Spectrophotometry Quantitative Spectrophotometry n UV Spectrophotometry of DNA, RNA and Proteins n Calibration of Spectrophotometers lseidman@matcmadison. edu

UV SPECTROPHOTOMETRY n DNA, RNA and proteins are commonly analyzed with UV spectrophotometry because these molecules absorb UV light lseidman@matcmadison. edu

UV METHODS n n n Used to evaluate the quality of DNA or RNA in a sample Used to estimate the quantity of DNA or RNA in a sample Procedure: Take single wavelength readings of samples at 260 and 280 nm lseidman@matcmadison. edu

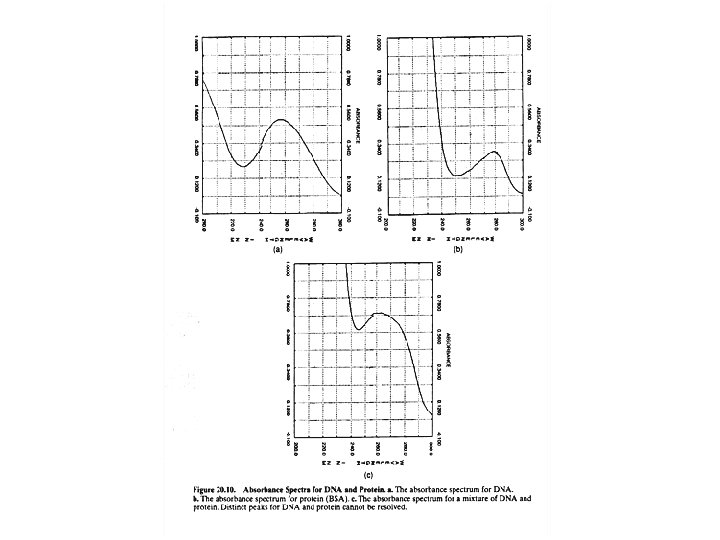
CONCENTRATION n The absorbance at 260 nm is related to the concentration of DNA or RNA in the sample q q q Pure, double-stranded DNA has an absorbance of about 1 at 260 nm when it is at a concentration of about 50 micrograms/m. L Pure, single-stranded DNA has an absorbance of about 1 at 260 nm when it is at a concentration of about 33 micrograms/m. L Values for proteins vary considerably from protein to protein lseidman@matcmadison. edu

PURITY n The ratio of the absorbance at 260 and 280 nm is related to the purity of the sample q q q An A 260/A 280 ratio of 2. 0 is characteristic of pure RNA An A 260/A 280 ratio of 1. 8 is characteristic of pure DNA An A 260/A 280 ratio of 0. 6 is characteristic of pure protein lseidman@matcmadison. edu

UV METHODS n n These UV methods for estimating concentration and purity of DNA, RNA, and proteins are very commonly used, are very quick, and easy to perform However, they values obtained are not very accurate – they are rough estimates lseidman@matcmadison. edu

n n n n Spectrophotometers in Biotechnology Light and its Interactions with Matter Spectrophotometer Design Spectrophotometer Operation Qualitative Spectrophotometry Quantitative Spectrophotometry UV Spectrophotometry of DNA, RNA and Proteins n Calibration of Spectrophotometers lseidman@matcmadison. edu

CALIBRATION OF A SPECTROPHOTOMETER n n Brings the readings of the spectrophotometer into accordance with nationally accepted values Part of routine quality control/maintenance lseidman@matcmadison. edu

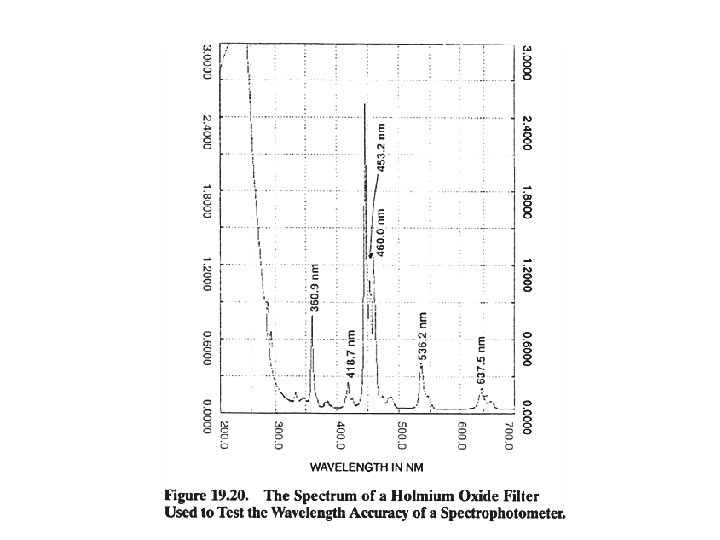
CALIBRATION Two parts: 1. Wavelength accuracy, the agreement between the wavelength selected by the operator and the actual wavelength of light that shines on sample 2. Photometric accuracy, or absorbance scale accuracy, the extent to which a measured absorbance or transmittance value agrees with an accepted reference value lseidman@matcmadison. edu
 available from NIST")
n Wavelength accuracy is determined using certified standard reference materials (SRMs) available from NIST or traceable to NIST q q An absorbance spectrum for the reference material is prepared The absorbance peaks for reference standards are known, so the wavelengths of the peaks generated by the instrument can be checked lseidman@matcmadison. edu

n Manufacturers specify the wavelength accuracy of a given instrument q q For example, a high performance instrument may be specified to have a wavelength accuracy with a tolerance of + 0. 5 nm A less expensive instrument may be specified to have a wavelength accuracy of + 3 nm lseidman@matcmadison. edu

PHOTOMETRIC ACCURACY n Assures that: q If the absorbance of a given sample is measured in two spectrophotometers at the same wavelength and under identical conditions n n the readings will be the same and the readings will correspond to nationally accepted values lseidman@matcmadison. edu

n n Photometric accuracy is difficult to achieve due to different instrument designs and optics Usually photometric accuracy is not critical if the same instrument is used consistently and if its readings are linear and reproducible lseidman@matcmadison. edu

n n n Photometric accuracy is required where values from different labs and instruments are compared Required if rely on published absorptivity constants Likely required in a GMP-compliant facility lseidman@matcmadison. edu

PROBLEM n Assume that a spectrophotometer is able to read accurately in the range from 0. 1 to 1. 8 AU. The molar absorptivity constant for NADH is 15, 000 L/mole-cm at 260 nm. Using Beer's Law, calculate the concentration range of NADH that can be accurately quantitated at 260 nm based on the limits of the spectrophotometer. lseidman@matcmadison. edu

ANSWER n This involves calculation of the molar concentrations which will produce absorbances of 0. 1 and 1. 8. From Beer's Law: C = A ε b Substituting 0. 1 and 1. 8 into the equation: lseidman@matcmadison. edu
(1 cm) Mole-cm 1. 8 (15, 000 L)(1")
C = 0. 1 (15, 000 L)(1 cm) Mole-cm 1. 8 (15, 000 L)(1 cm) mole-cm = 6. 7 X 10 -6 mole/L = 120. 0 X 10 -6 mole/L lseidman@matcmadison. edu

Thus, the range of NADH concentrations that can be detected at this wavelength with this spectrophotometer is from 6. 7 X 10 -6 mole/L to 120. 0 X 10 -6 mole/L. These are very dilute solutions of NADH. lseidman@matcmadison. edu
- Slides: 74