Si PM Silicon Photon Multipliers Chiara Cappellini Ph



- Slides: 29
Si. PM: Silicon Photon Multipliers Chiara Cappellini, Ph. D On behalf of The University of Insubria team
The RAPSODI project n n Founded by the EC under the FP 6 COOP program Sensor development and optimization for three well defined applications dosimetry in mammography, Radon monitoring, isotope detection n 4 SME + 3 R&D performers Sens. L (IE) PTW (DE) Plch SMM (CZ) Forim. Tech (CH) UNICO (IT) AGH (PL) ITEP (RU)
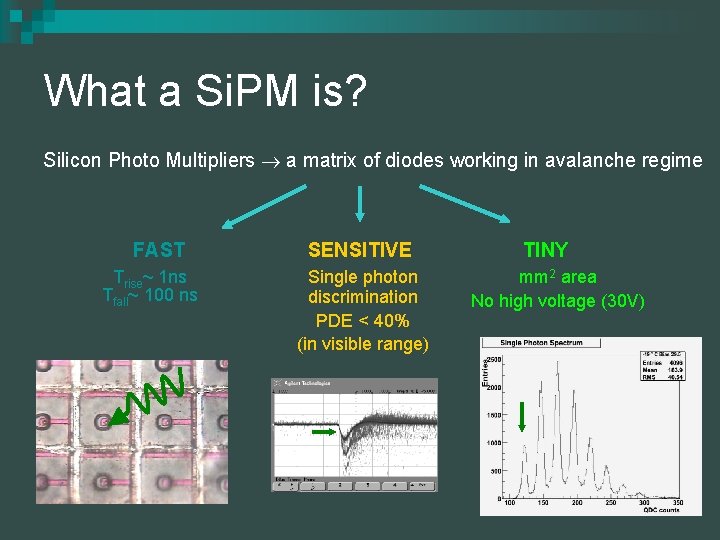
What a Si. PM is? Silicon Photo Multipliers a matrix of diodes working in avalanche regime FAST Trise~ 1 ns Tfall~ 100 ns SENSITIVE Single photon discrimination PDE < 40% (in visible range) TINY mm 2 area No high voltage (30 V)
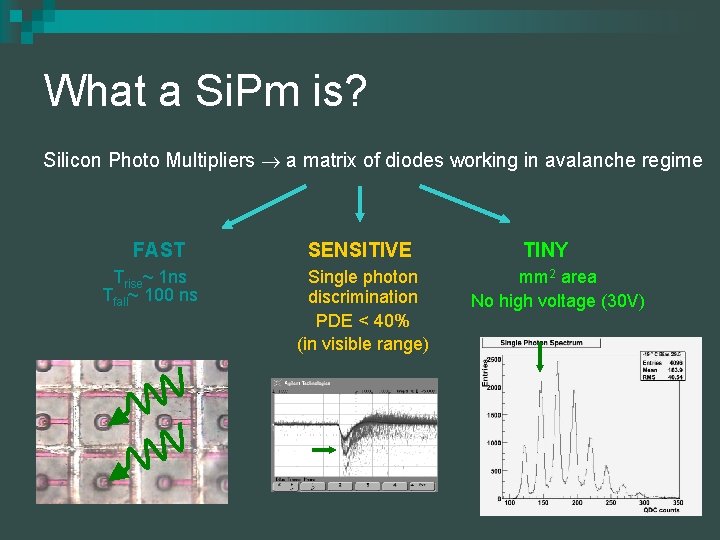
What a Si. Pm is? Silicon Photo Multipliers a matrix of diodes working in avalanche regime FAST Trise~ 1 ns Tfall~ 100 ns SENSITIVE Single photon discrimination PDE < 40% (in visible range) TINY mm 2 area No high voltage (30 V)
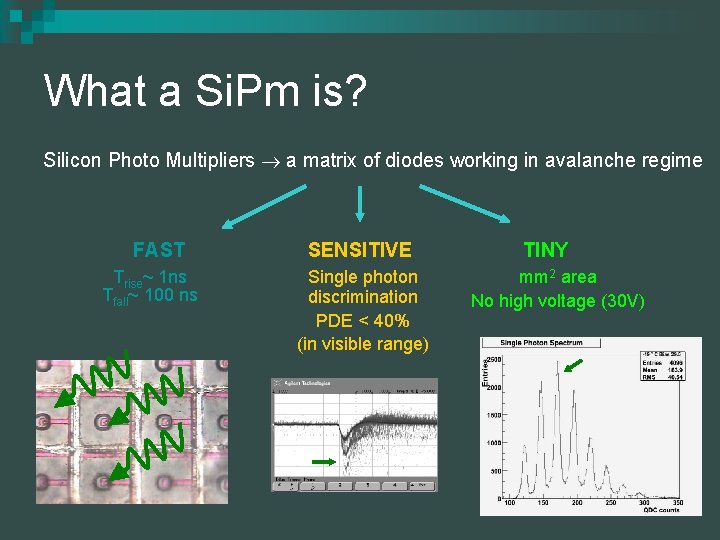
What a Si. Pm is? Silicon Photo Multipliers a matrix of diodes working in avalanche regime FAST Trise~ 1 ns Tfall~ 100 ns SENSITIVE Single photon discrimination PDE < 40% (in visible range) TINY mm 2 area No high voltage (30 V)
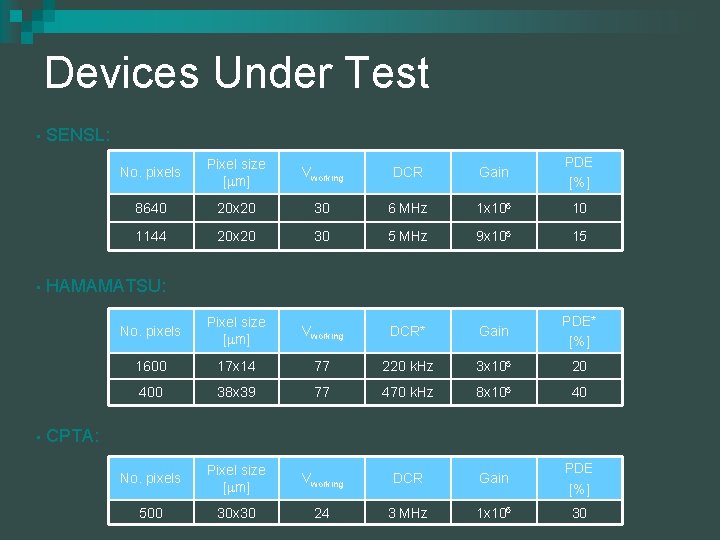
Devices Under Test • • • SENSL: No. pixels Pixel size [ m] Vworking DCR Gain PDE [%] 8640 20 x 20 30 6 MHz 1 x 10⁶ 10 1144 20 x 20 30 5 MHz 9 x 10⁵ 15 No. pixels Pixel size [ m] Vworking DCR* Gain PDE* [%] 1600 17 x 14 77 220 k. Hz 3 x 10⁵ 20 400 38 x 39 77 470 k. Hz 8 x 10⁵ 40 No. pixels Pixel size [ m] Vworking DCR Gain PDE [%] 500 30 x 30 24 3 MHz 1 x 10⁶ 30 HAMAMATSU: CPTA:
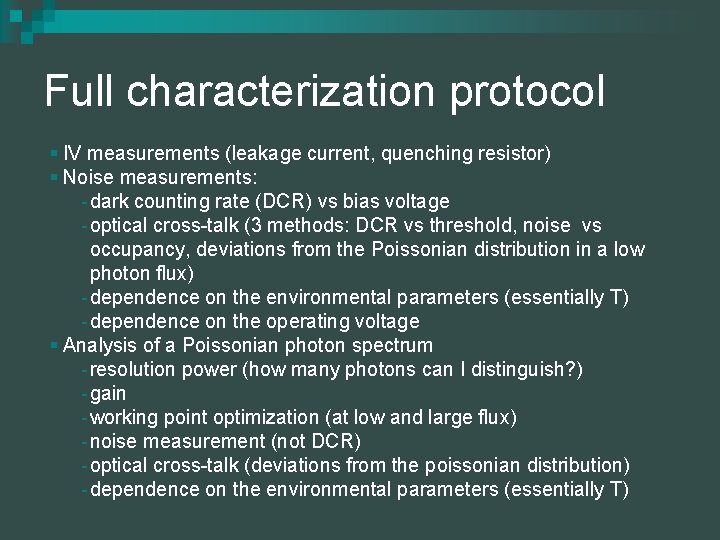
Full characterization protocol § IV measurements (leakage current, quenching resistor) § Noise measurements: - dark counting rate (DCR) vs bias voltage - optical cross-talk (3 methods: DCR vs threshold, noise vs occupancy, deviations from the Poissonian distribution in a low photon flux) - dependence on the environmental parameters (essentially T) - dependence on the operating voltage § Analysis of a Poissonian photon spectrum - resolution power (how many photons can I distinguish? ) - gain - working point optimization (at low and large flux) - noise measurement (not DCR) - optical cross-talk (deviations from the poissonian distribution) - dependence on the environmental parameters (essentially T)
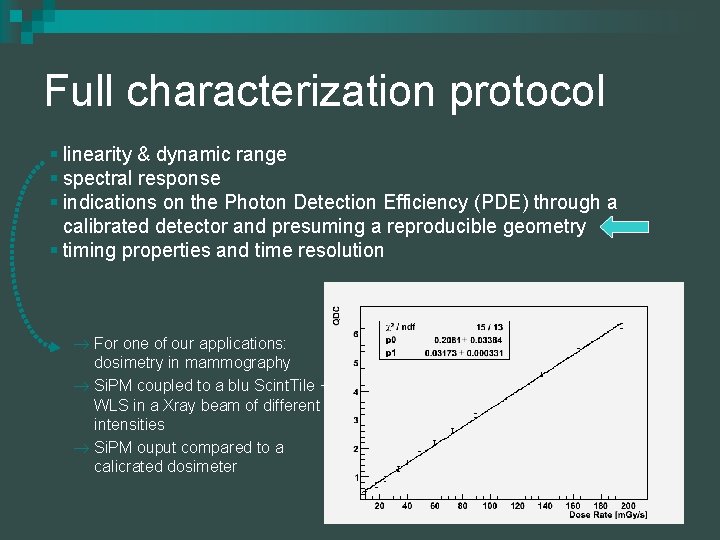
Full characterization protocol § linearity & dynamic range § spectral response § indications on the Photon Detection Efficiency (PDE) through a calibrated detector and presuming a reproducible geometry § timing properties and time resolution For one of our applications: dosimetry in mammography Si. PM coupled to a blu Scint. Tile + WLS in a Xray beam of different intensities Si. PM ouput compared to a calicrated dosimeter
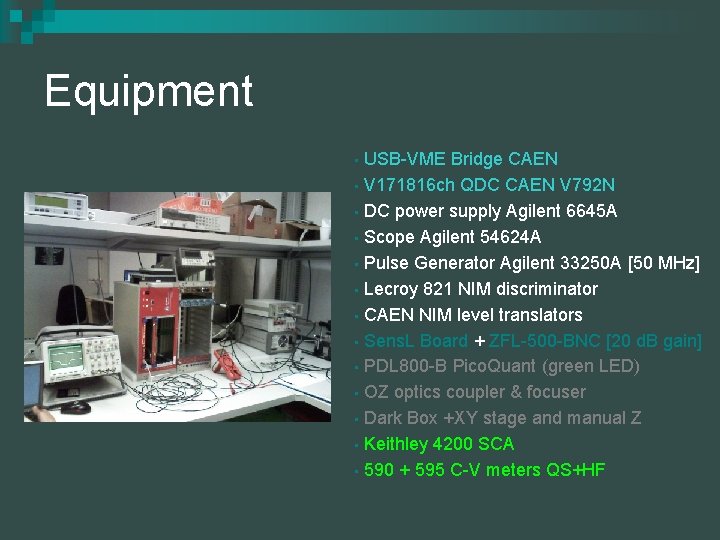
Equipment USB-VME Bridge CAEN • V 171816 ch QDC CAEN V 792 N • DC power supply Agilent 6645 A • Scope Agilent 54624 A • Pulse Generator Agilent 33250 A [50 MHz] • Lecroy 821 NIM discriminator • CAEN NIM level translators • Sens. L Board + ZFL-500 -BNC [20 d. B gain] • PDL 800 -B Pico. Quant (green LED) • OZ optics coupler & focuser • Dark Box +XY stage and manual Z • Keithley 4200 SCA • 590 + 595 C-V meters QS+HF •
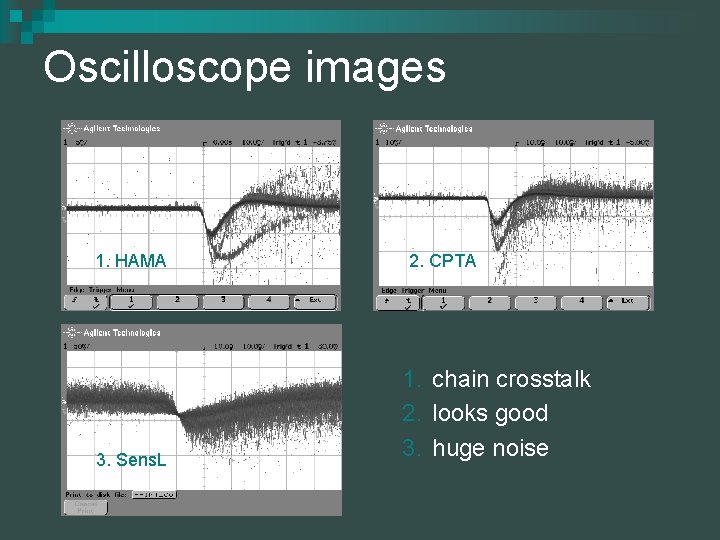
Oscilloscope images 1. HAMA 3. Sens. L 2. CPTA 1. chain crosstalk 2. looks good 3. huge noise
I-V characteristics Remarks: § quenching resistor § breakdown voltage § leakage current § DCR
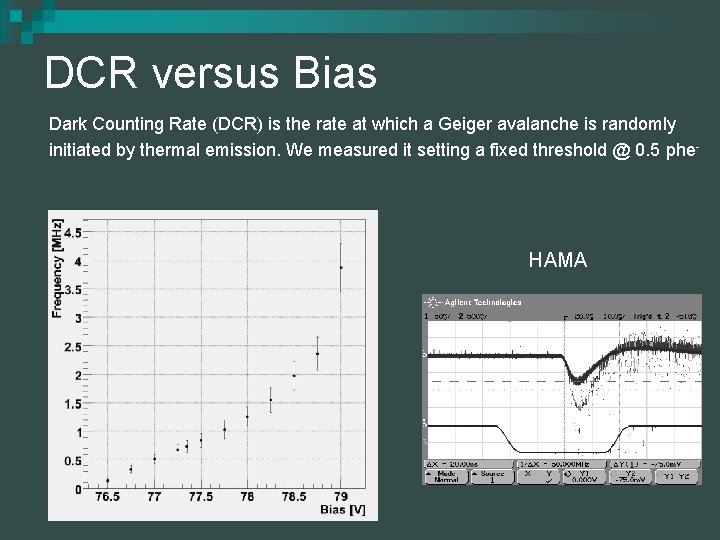
DCR versus Bias Dark Counting Rate (DCR) is the rate at which a Geiger avalanche is randomly initiated by thermal emission. We measured it setting a fixed threshold @ 0. 5 phe- HAMA
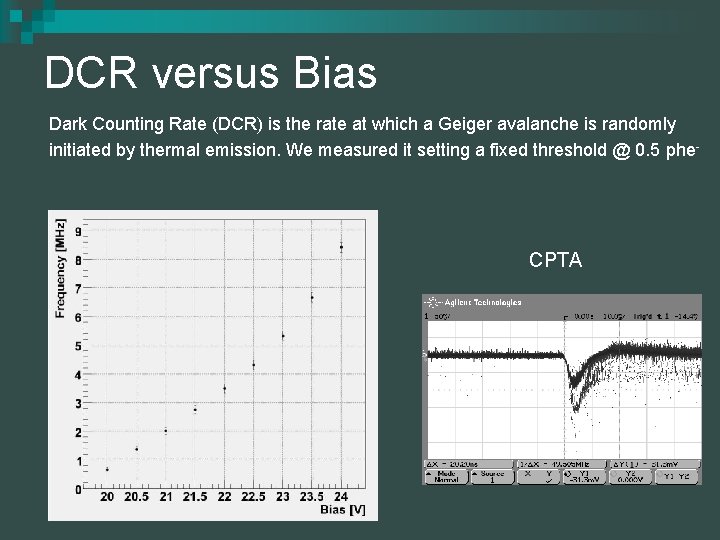
DCR versus Bias Dark Counting Rate (DCR) is the rate at which a Geiger avalanche is randomly initiated by thermal emission. We measured it setting a fixed threshold @ 0. 5 phe- CPTA
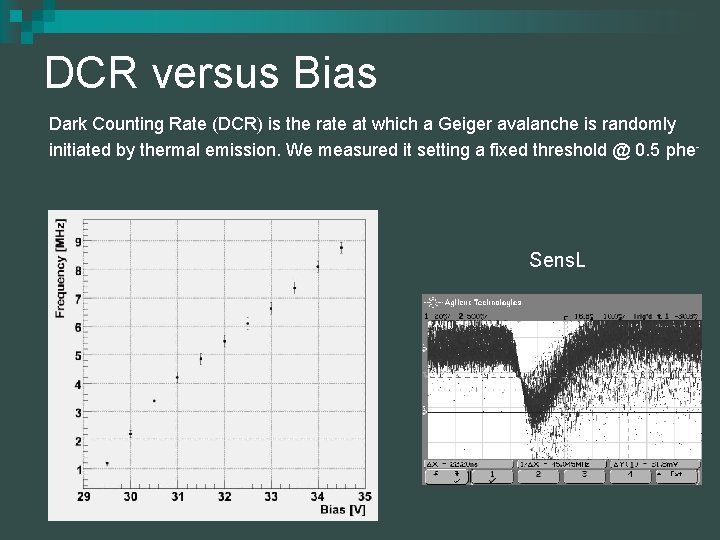
DCR versus Bias Dark Counting Rate (DCR) is the rate at which a Geiger avalanche is randomly initiated by thermal emission. We measured it setting a fixed threshold @ 0. 5 phe- Sens. L
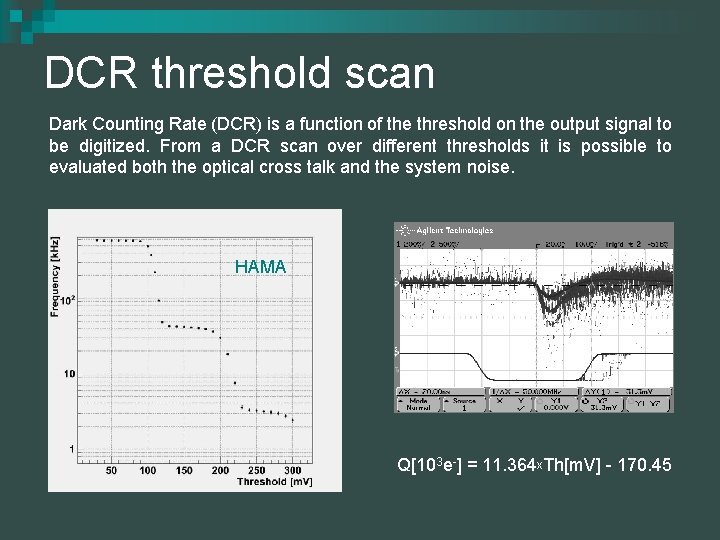
DCR threshold scan Dark Counting Rate (DCR) is a function of the threshold on the output signal to be digitized. From a DCR scan over different thresholds it is possible to evaluated both the optical cross talk and the system noise. HAMA Q[103 e-] = 11. 364 x. Th[m. V] - 170. 45
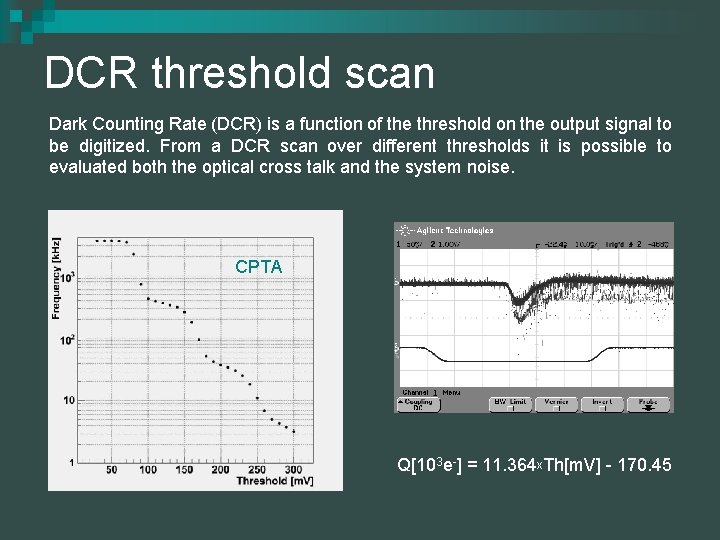
DCR threshold scan Dark Counting Rate (DCR) is a function of the threshold on the output signal to be digitized. From a DCR scan over different thresholds it is possible to evaluated both the optical cross talk and the system noise. CPTA Q[103 e-] = 11. 364 x. Th[m. V] - 170. 45
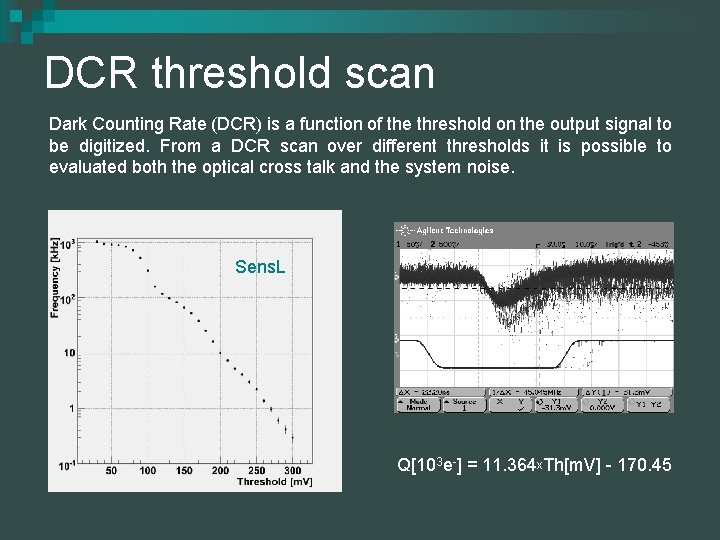
DCR threshold scan Dark Counting Rate (DCR) is a function of the threshold on the output signal to be digitized. From a DCR scan over different thresholds it is possible to evaluated both the optical cross talk and the system noise. Sens. L Q[103 e-] = 11. 364 x. Th[m. V] - 170. 45
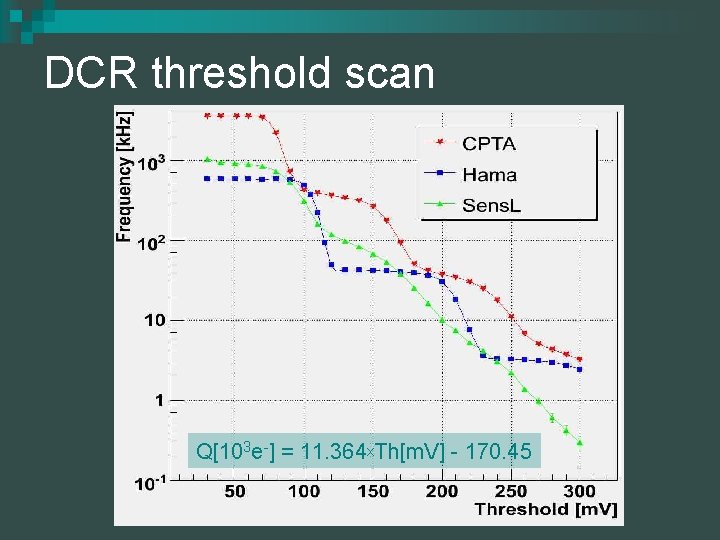
DCR threshold scan Q[103 e-] = 11. 364 x. Th[m. V] - 170. 45
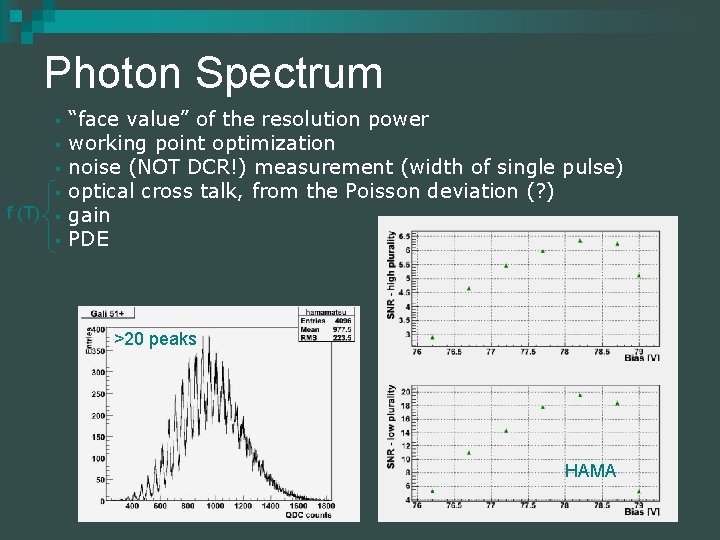
Photon Spectrum § § f (T) § § “face value” of the resolution power working point optimization noise (NOT DCR!) measurement (width of single pulse) optical cross talk, from the Poisson deviation (? ) gain PDE >20 peaks HAMA
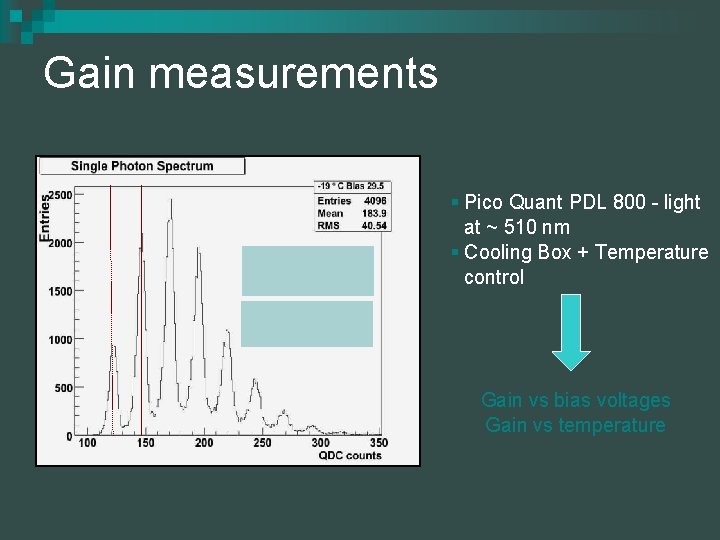
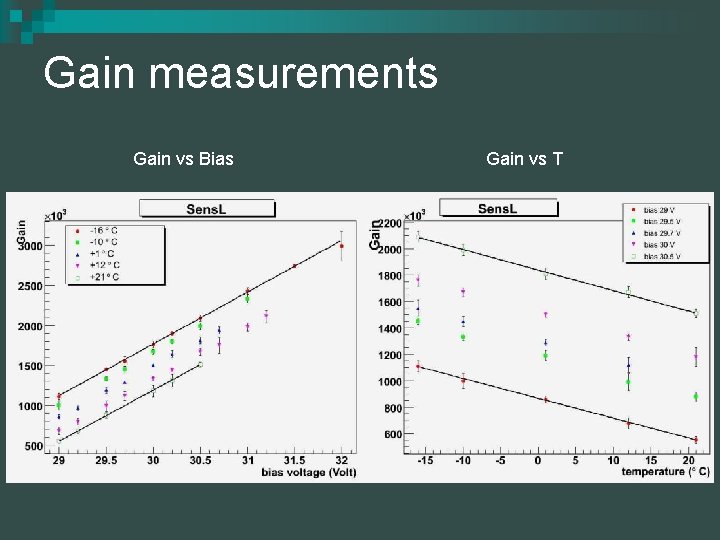
Gain measurements § Pico Quant PDL 800 - light at ~ 510 nm § Cooling Box + Temperature control Gain vs bias voltages Gain vs temperature
Gain measurements Gain vs Bias Gain vs T
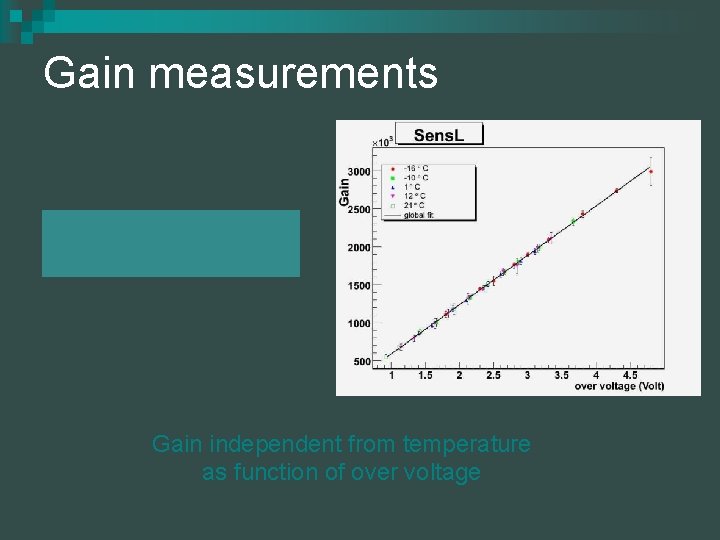
Gain measurements Gain independent from temperature as function of over voltage
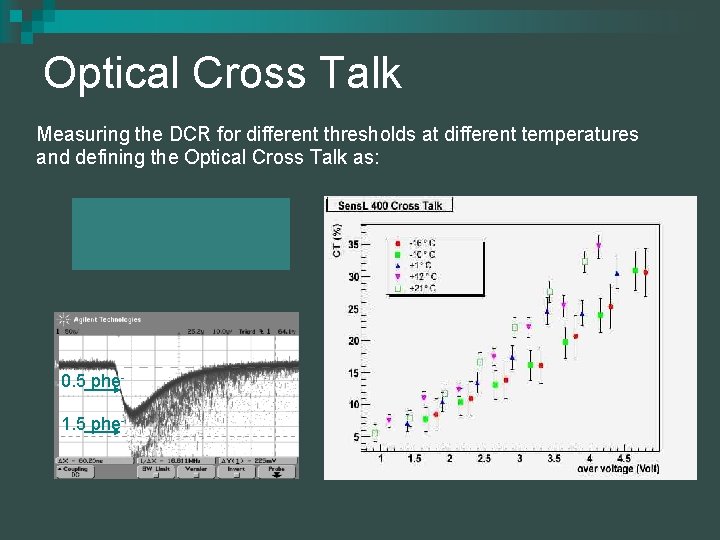
Optical Cross Talk Measuring the DCR for different thresholds at different temperatures and defining the Optical Cross Talk as: Cross Talk 0. 5 phe 1. 5 phe-
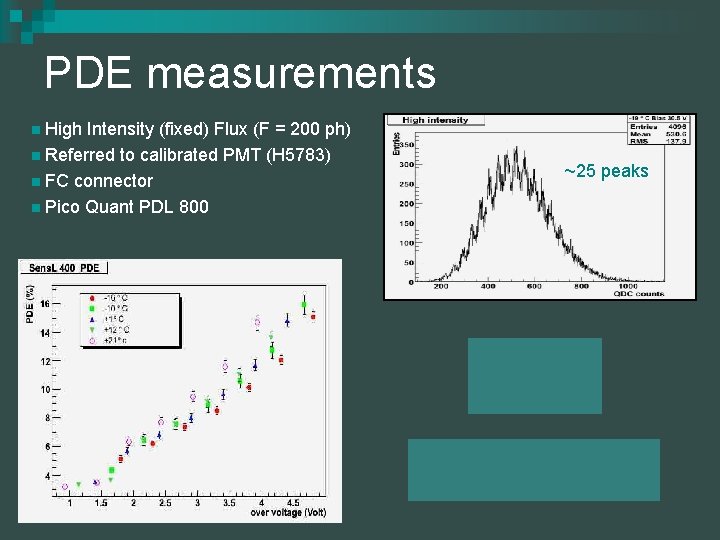
PDE measurements n High Intensity (fixed) Flux (F = 200 ph) n Referred to calibrated PMT (H 5783) n FC connector n Pico Quant PDL 800 ~25 peaks
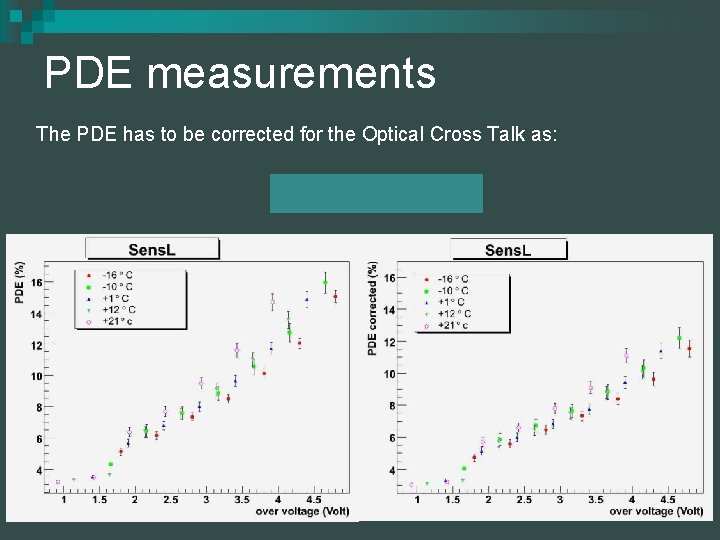
PDE measurements The PDE has to be corrected for the Optical Cross Talk as:
Spectrum 137 Cs YAP crystal (1 x 1 x 5 mm 3) directly connected to Si. PM by optic grease 32 ke. V 662 ke. V ~460 ke. V ~200 ke. V The 137 Cs spectrum shows the Ba-Ka-double line at 32 ke. V, The back scatter peak at around 200 ke. V, Compton continuum end around 460 ke. V and the 662 ke. V line from the long-lived ( T 1/2 = 2. 2 min) excited Ba-nucleus created by the 137 Cs decay.
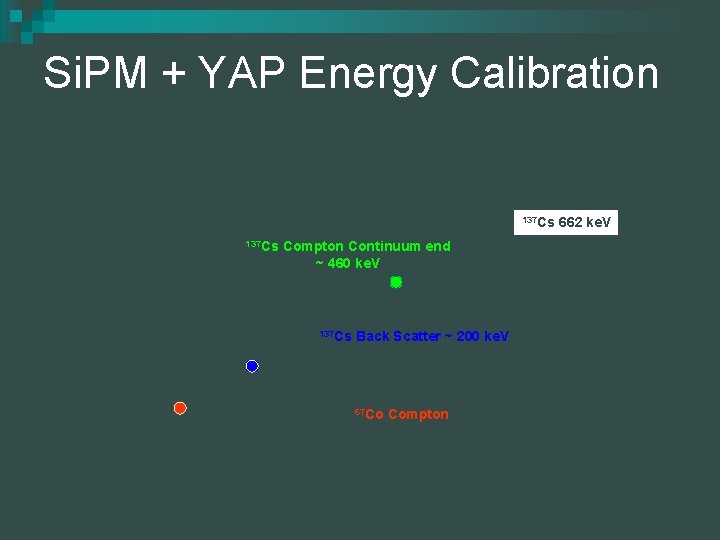
Si. PM + YAP Energy Calibration 137 Cs Compton Continuum end ~ 460 ke. V 137 Cs Back Scatter ~ 200 ke. V 241 Am 59. 5 ke. V 137 Cs 67 Co 122 ke. V Ba k-line 32 ke. V 67 Co Compton 662 ke. V
Conclusions The characterization procedure is well developed and new generation sensor have been produced: § with dedicated trenches to reduce the optical Xtalk § reduced DCR § blue sensitivity Next step is time characterization: Hints: § signal time development well known (rising few ns + falling 100 ns) § time resolution guess: ~ 100 ps -> 20 ps with double threshold discrimination
… this is what we can offer Thanks for your attention hope to start a fruitful collaboration