Risk and Rates of Return n Standalone risk

- Slides: 28
Risk and Rates of Return n Stand-alone risk Portfolio risk Risk & return: CAPM / SML 5 -1
What are Investment Returns n n n Investment returns measure the financial results of an investment. Returns may be historical or prospective (anticipated). Returns can be expressed in: Taka Percentage Terms 5 -2
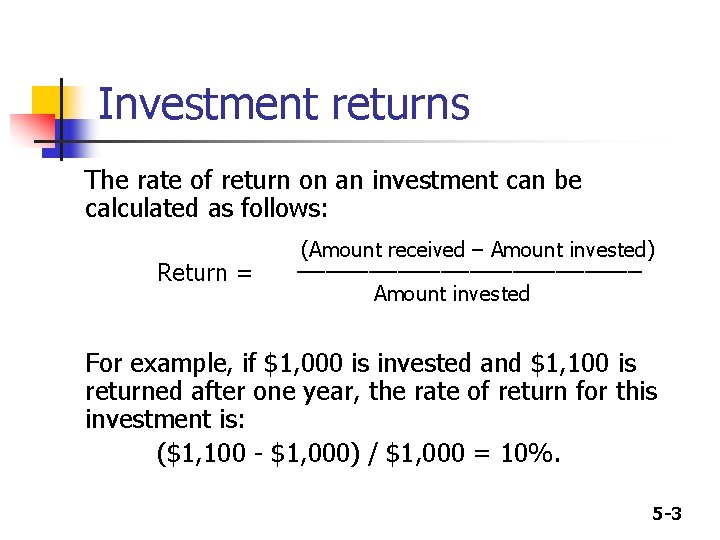
Investment returns The rate of return on an investment can be calculated as follows: Return = (Amount received – Amount invested) ____________ Amount invested For example, if $1, 000 is invested and $1, 100 is returned after one year, the rate of return for this investment is: ($1, 100 - $1, 000) / $1, 000 = 10%. 5 -3
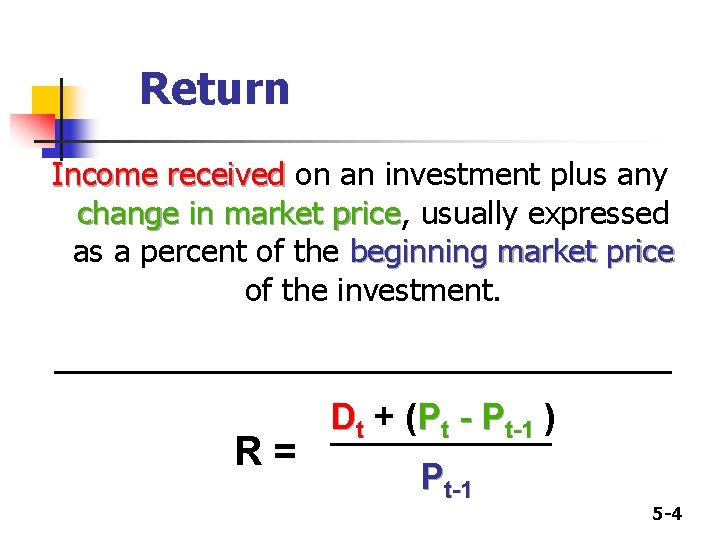
Return Income received on an investment plus any change in market price, price usually expressed as a percent of the beginning market price of the investment. R= Dt + (Pt - Pt-1 ) Pt-1 5 -4
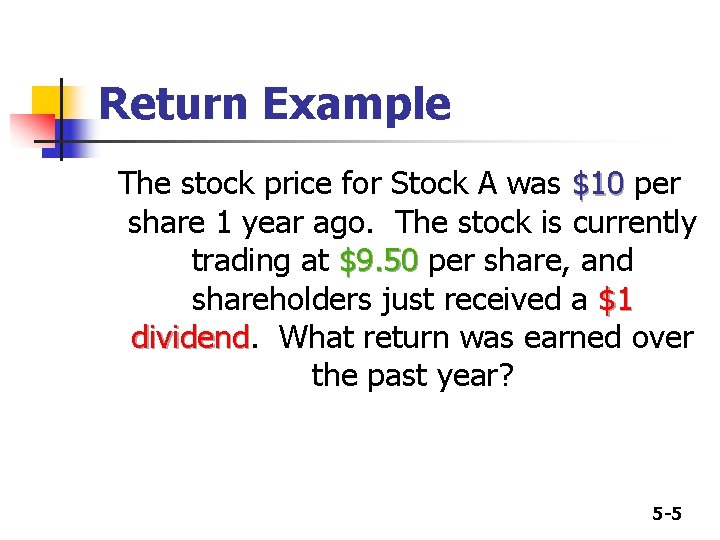
Return Example The stock price for Stock A was $10 per share 1 year ago. The stock is currently trading at $9. 50 per share, and shareholders just received a $1 dividend What return was earned over the past year? 5 -5
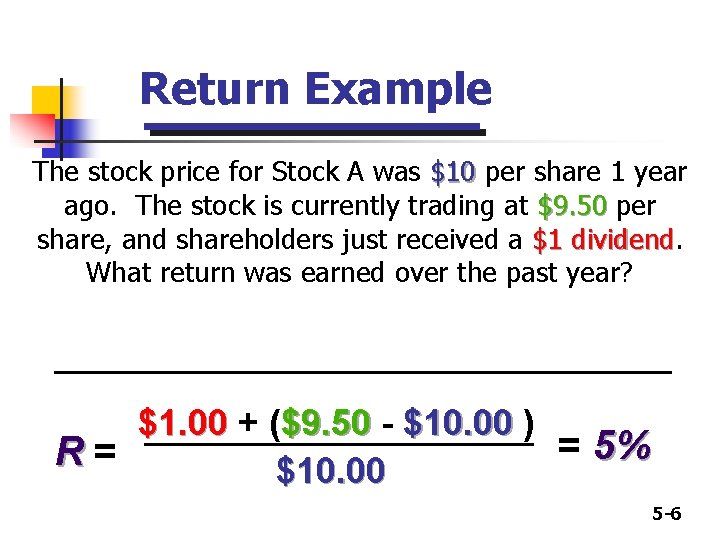
Return Example The stock price for Stock A was $10 per share 1 year ago. The stock is currently trading at $9. 50 per share, and shareholders just received a $1 dividend What return was earned over the past year? $1. 00 + ($9. 50 - $10. 00 ) = 5% R= $10. 00 5 -6
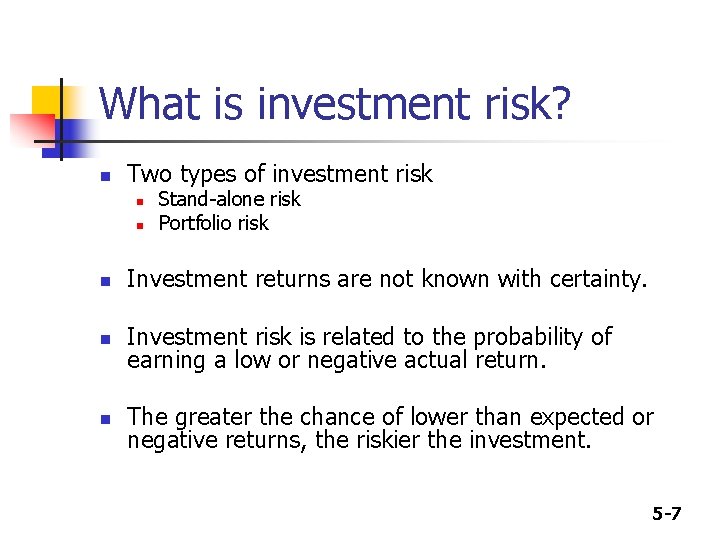
What is investment risk? n Two types of investment risk n n Stand-alone risk Portfolio risk n Investment returns are not known with certainty. n Investment risk is related to the probability of earning a low or negative actual return. n The greater the chance of lower than expected or negative returns, the riskier the investment. 5 -7
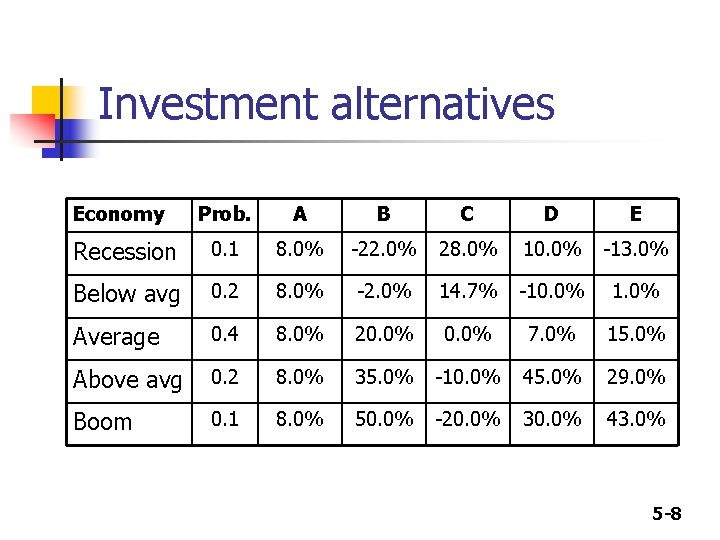
Investment alternatives Economy Prob. A B C D E Recession 0. 1 8. 0% -22. 0% 28. 0% 10. 0% -13. 0% Below avg 0. 2 8. 0% -2. 0% 14. 7% -10. 0% 1. 0% Average 0. 4 8. 0% 20. 0% 7. 0% 15. 0% Above avg 0. 2 8. 0% 35. 0% -10. 0% 45. 0% 29. 0% Boom 0. 1 8. 0% 50. 0% -20. 0% 30. 0% 43. 0% 5 -8
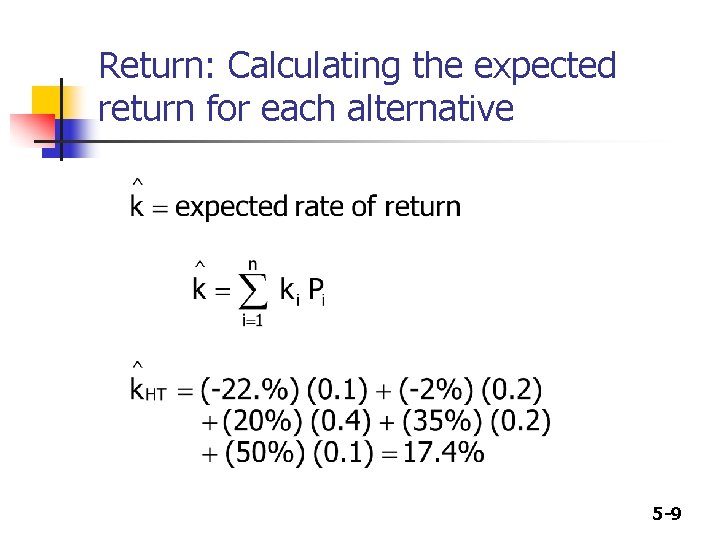
Return: Calculating the expected return for each alternative 5 -9
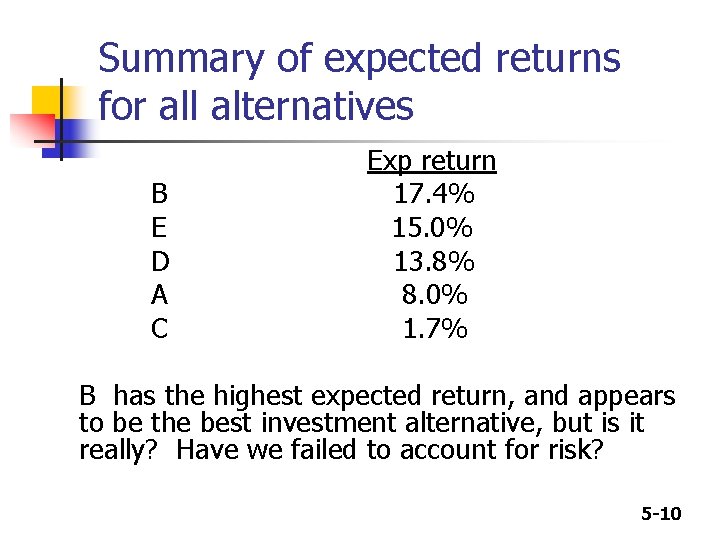
Summary of expected returns for all alternatives B E D A C Exp return 17. 4% 15. 0% 13. 8% 8. 0% 1. 7% B has the highest expected return, and appears to be the best investment alternative, but is it really? Have we failed to account for risk? 5 -10
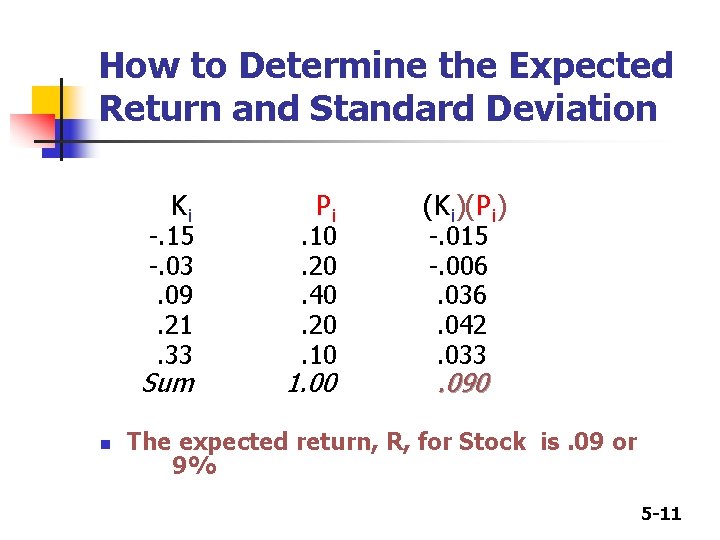
How to Determine the Expected Return and Standard Deviation Ki -. 15 -. 03. 09. 21. 33 Sum n Pi . 10. 20. 40. 20. 10 1. 00 (Ki)(Pi) -. 015 -. 006. 036. 042. 033 . 090 The expected return, R, for Stock is. 09 or 9% 5 -11
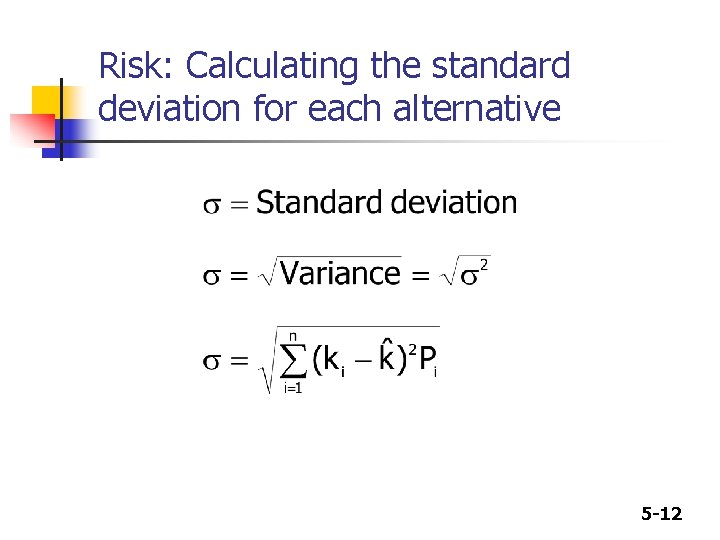
Risk: Calculating the standard deviation for each alternative 5 -12
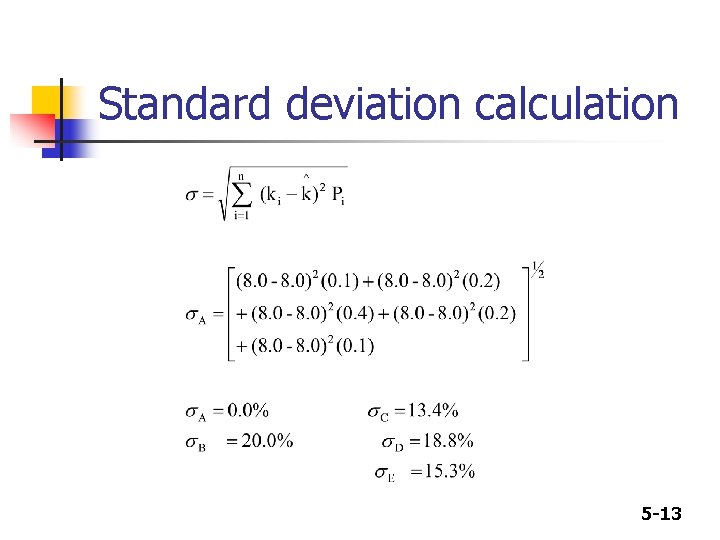
Standard deviation calculation 5 -13
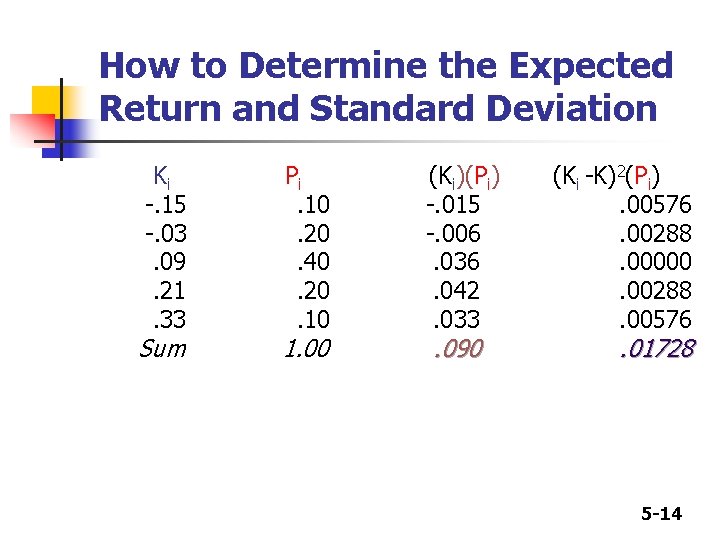
How to Determine the Expected Return and Standard Deviation Ki -. 15 -. 03. 09. 21. 33 Sum Pi. 10. 20. 40. 20. 10 1. 00 (Ki)(Pi) -. 015 -. 006. 036. 042. 033 . 090 (Ki -K)2(Pi). 00576. 00288. 00000. 00288. 00576 . 01728 5 -14
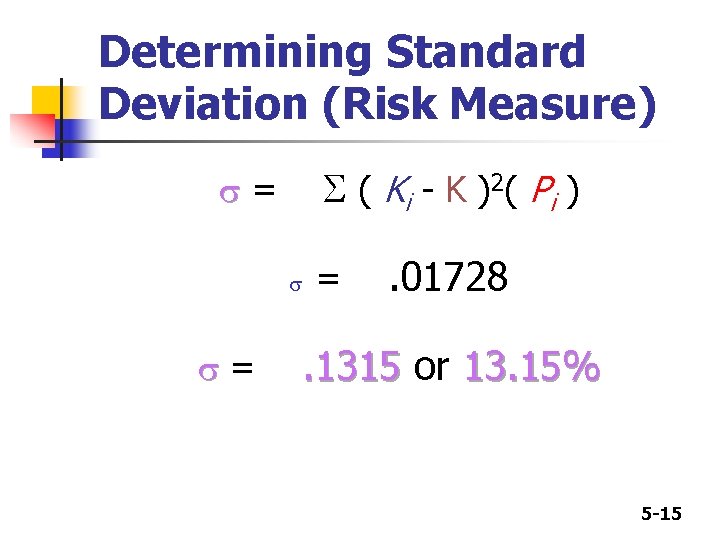
Determining Standard Deviation (Risk Measure) S ( K i - K ) 2 ( Pi ) s= s s= = . 01728 . 1315 or 13. 15% 5 -15
Comments on standard deviation as a measure of risk n n n Standard deviation (σi) measures total, or stand-alone, risk. The larger σi is, the lower the probability that actual returns will be closer to expected returns. Difficult to compare standard deviations, because return has not been accounted for. 5 -16
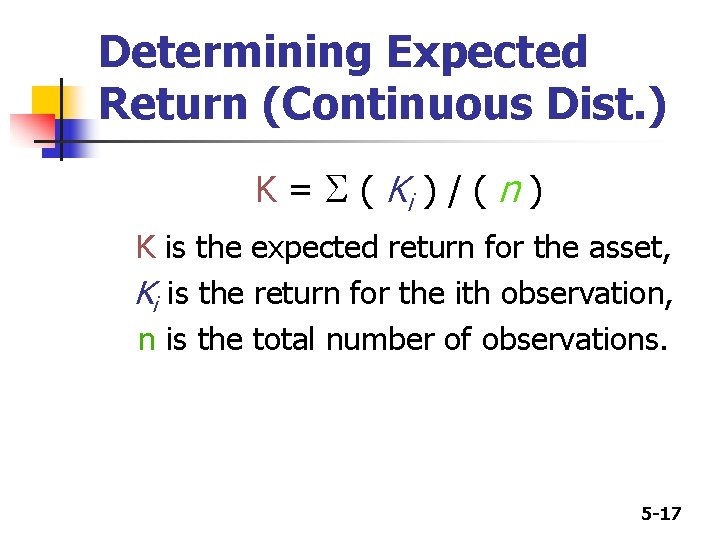
Determining Expected Return (Continuous Dist. ) K = S ( Ki ) / ( n ) K is the expected return for the asset, Ki is the return for the ith observation, n is the total number of observations. 5 -17
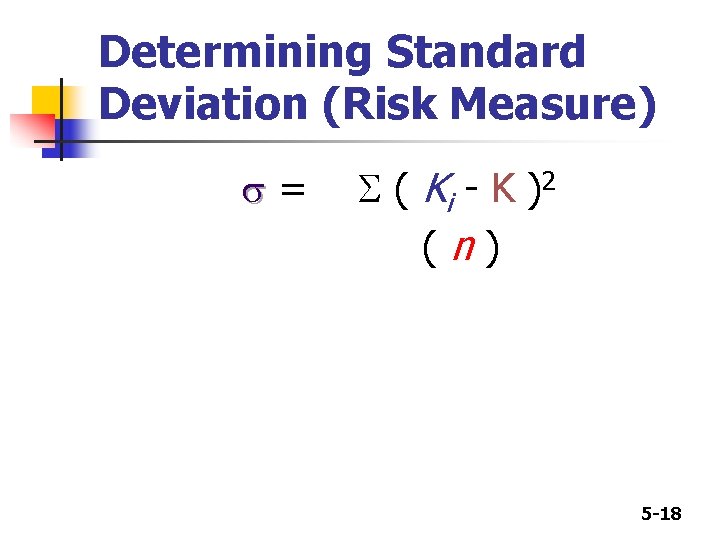
Determining Standard Deviation (Risk Measure) s= S ( Ki - K ) 2 (n) 5 -18
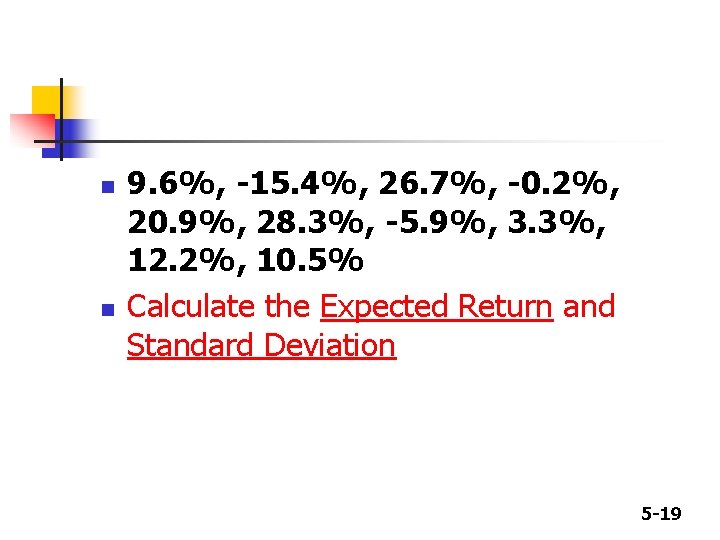
n n 9. 6%, -15. 4%, 26. 7%, -0. 2%, 20. 9%, 28. 3%, -5. 9%, 3. 3%, 12. 2%, 10. 5% Calculate the Expected Return and Standard Deviation 5 -19
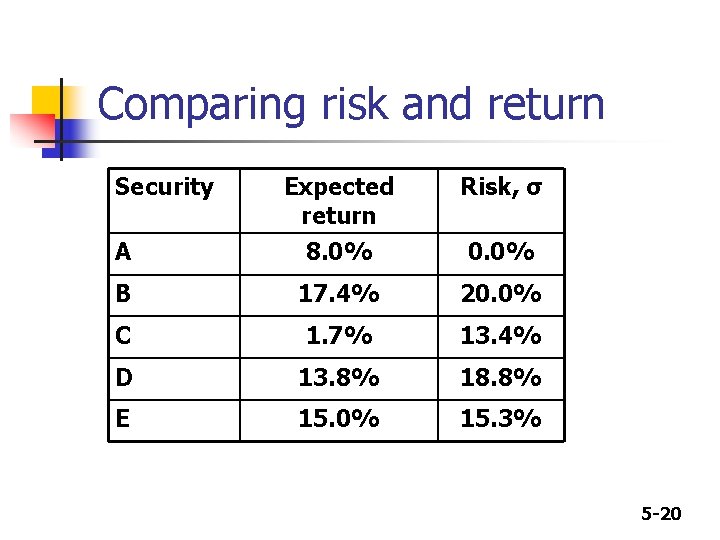
Comparing risk and return Security Expected return Risk, σ A 8. 0% 0. 0% B 17. 4% 20. 0% C 1. 7% 13. 4% D 13. 8% 18. 8% E 15. 0% 15. 3% 5 -20
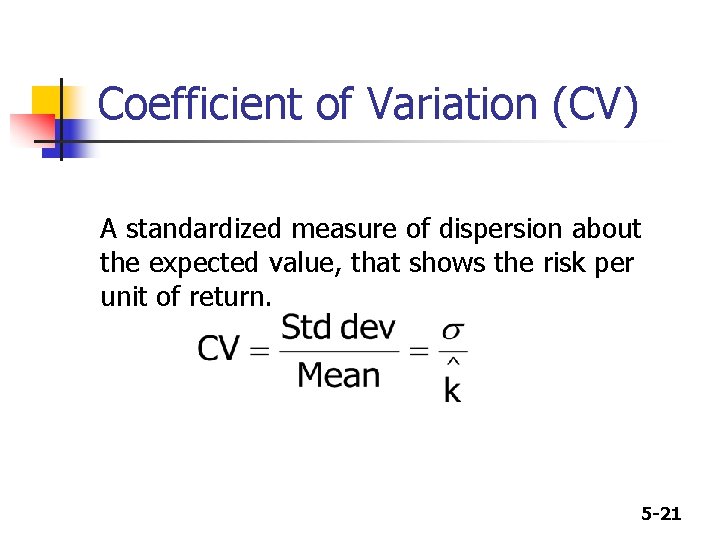
Coefficient of Variation (CV) A standardized measure of dispersion about the expected value, that shows the risk per unit of return. 5 -21
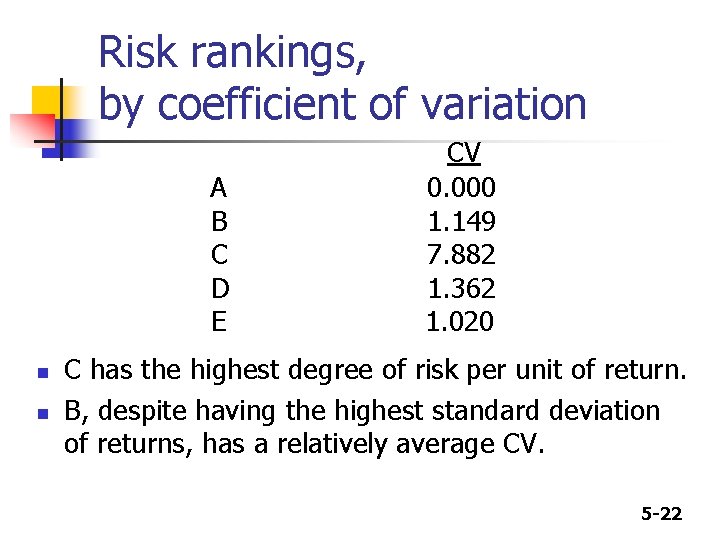
Risk rankings, by coefficient of variation A B C D E n n CV 0. 000 1. 149 7. 882 1. 362 1. 020 C has the highest degree of risk per unit of return. B, despite having the highest standard deviation of returns, has a relatively average CV. 5 -22
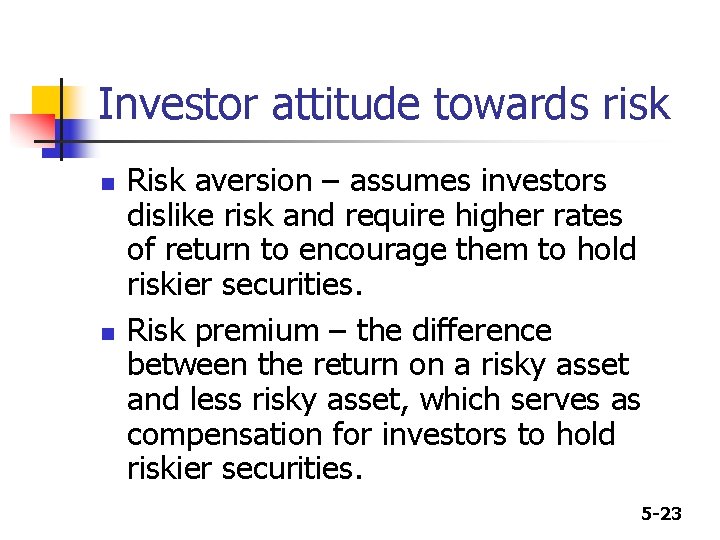
Investor attitude towards risk n n Risk aversion – assumes investors dislike risk and require higher rates of return to encourage them to hold riskier securities. Risk premium – the difference between the return on a risky asset and less risky asset, which serves as compensation for investors to hold riskier securities. 5 -23
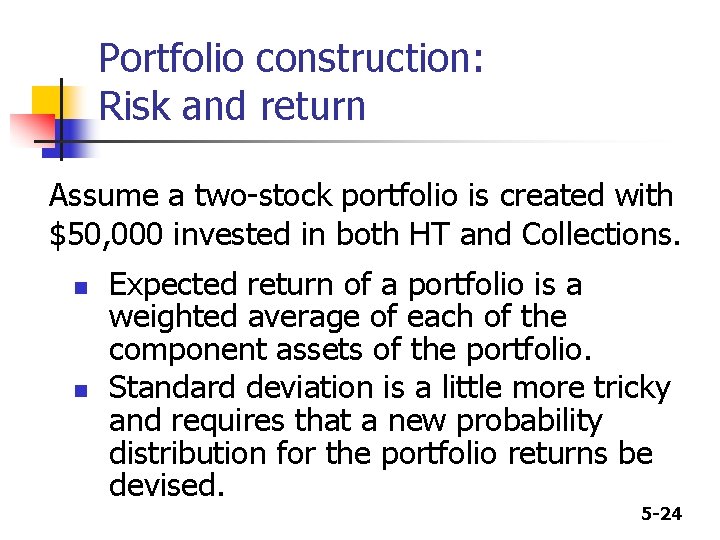
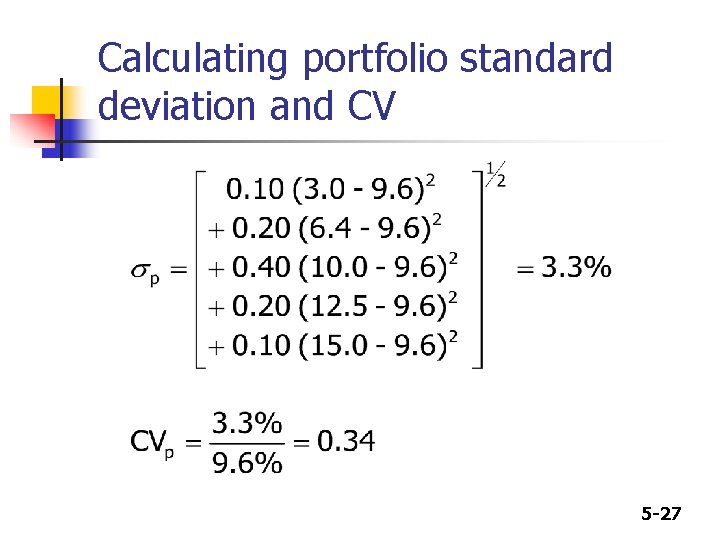
Portfolio construction: Risk and return Assume a two-stock portfolio is created with $50, 000 invested in both HT and Collections. n n Expected return of a portfolio is a weighted average of each of the component assets of the portfolio. Standard deviation is a little more tricky and requires that a new probability distribution for the portfolio returns be devised. 5 -24
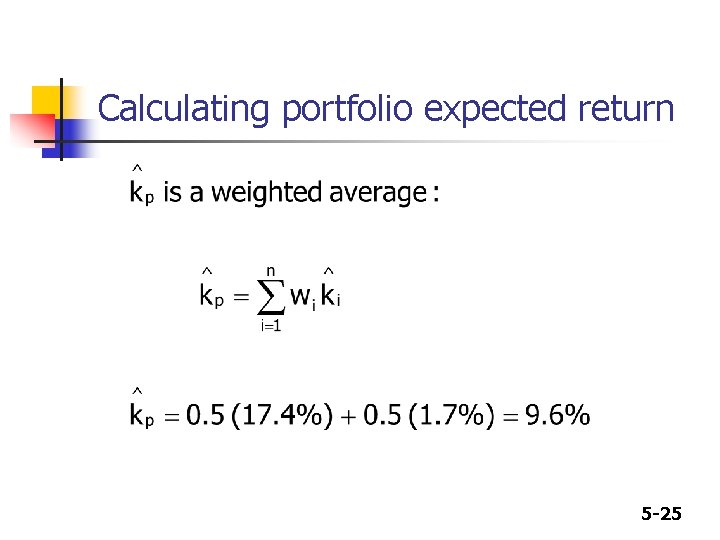
Calculating portfolio expected return 5 -25
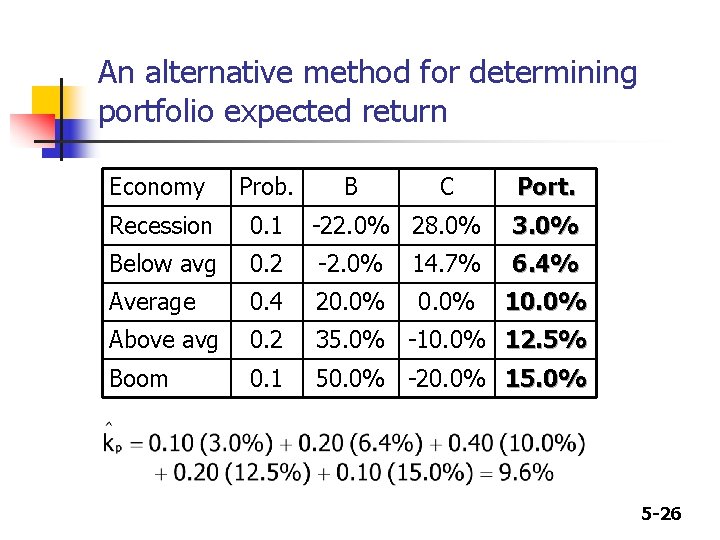
An alternative method for determining portfolio expected return Economy Prob. B C Port. Recession 0. 1 -22. 0% 28. 0% 3. 0% Below avg 0. 2 -2. 0% 14. 7% 6. 4% Average 0. 4 20. 0% 10. 0% Above avg 0. 2 35. 0% -10. 0% 12. 5% Boom 0. 1 50. 0% -20. 0% 15. 0% 5 -26
Calculating portfolio standard deviation and CV 5 -27
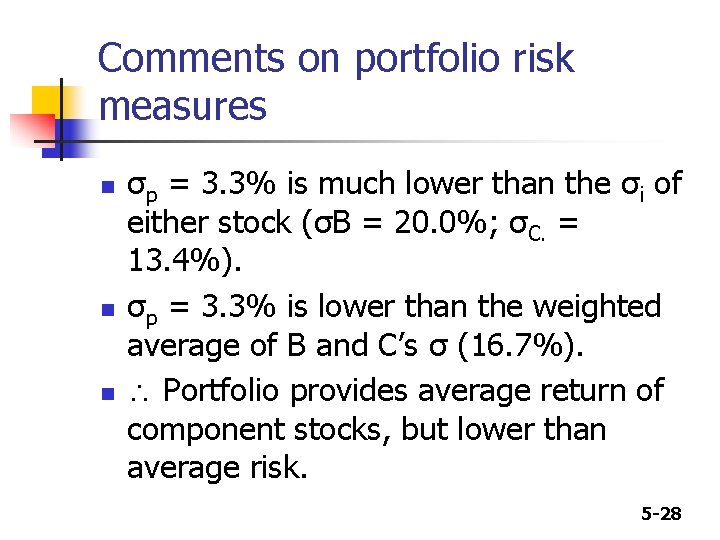
Comments on portfolio risk measures n n n σp = 3. 3% is much lower than the σi of either stock (σB = 20. 0%; σC. = 13. 4%). σp = 3. 3% is lower than the weighted average of B and C’s σ (16. 7%). Portfolio provides average return of component stocks, but lower than average risk. 5 -28