RESEARCH METHODOLOGY LECTURE 32 ND Research purpose and

 Figure 10. 1")


- Slides: 28
RESEARCH METHODOLOGY LECTURE 32 ND
Research purpose and strategy Forms of interview Saunders et al. (2009) Figure 10. 1 Forms of interview
Types of interview Structured interviews: use questionnaire based on a predetermined and ‘standardized’ or identical set of questions and we refer to them as interviewer administered questionnaires. Semi-structure interviews: the researcher will have a list of themes and questions to be covered, although these may vary from interview to interview. This means that you may omit some questions in particular interviews, given a specific organizational context that is encountered in relation to the research topic. The order of questions also be varied depending on the flow of conversation. On the other hand, additional questions may be required to explore your research question and objectives given the nature of events within particular organizations.
Types of interview Unstructured interviews: Unstructured interviews are informal. You would use these to explore in-depth a general area in which you are interested. We therefore, refer to these as in-depth interviews. There is no predetermined list of questions to work through in this situation, although you need to have a clear idea about the aspect or aspects that you want to explore. The interviewee is given the opportunity to talk freely about events behavior and beliefs in relation to topic area.
What is questionnaire? Techniques of data collection in which each person is asked to respond to the same set of questions in a predetermined order Adapted from de. Vaus (2002)
Use of questionnaires When to use questionnaires • For explanatory or descriptive research. • Linked with other methods in a multiple-methods research design. • To collect responses from a large sample prior to quantitative analysis.
Types of Questionnaire These are the types of questionnaire given in tabular form below; Saunders et al. (2009) Figure 11. 1 Types of questionnaire
Preparing, inputting and checking data If you intend to undertake quantitative analysis consider the following: • type of data (scale of measurement); • format in which your data will be input to the analysis software; SPSS, EVIEWS, STATA, NVIVO. • impact of data coding on subsequent analyses (for different data types); • methods you intend to use to check data for errors.
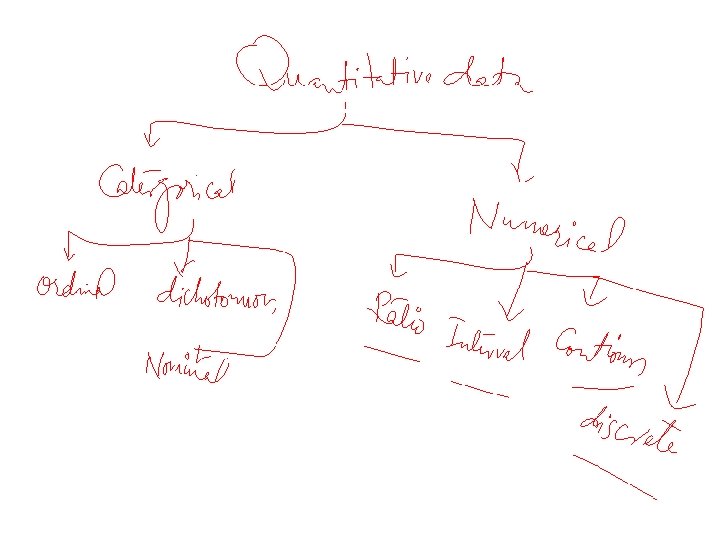
Quantitative Data • Quantitative data can be divided into two distinct groups: categorical and numerical. • Categorical data refer to data whose values cannot be measured numerically but can be either classified into sets (categories) according to the characteristics that identify or describe the variable or placed in rank order (Berman Brown and Saunders 2008).
Quantitative Data • They can be further sub-divided into descriptive and ranked. • A car manufacturer might categorise the types of cars it produces as hatchback, saloon and estate. These are known as descriptive data or nominal data as it is impossible to define the category numerically or to rank it. • Rather these data simply count the number of occurrences in each category of a variable. • For virtually all analyses the categories should be unambiguous and discrete; in other words, having one particular feature, such as a car being a hatchback, excludes all other features for that variable. This prevents questions arising as to which category an individual case belongs.
Quantitative Data • Although, these data are purely descriptive, you can count them to establish which category has the most and whether cases are spread evenly between categories (Morris 2003). • Some statisticians (and statistics) also separate descriptive data where there are only two categories. These are known as dichotomous data, as the variable is divided into two categories, such as the variable gender being divided into female and male. • Ranked (or ordinal) data are a more precise form of categorical data.
Quantitative Data
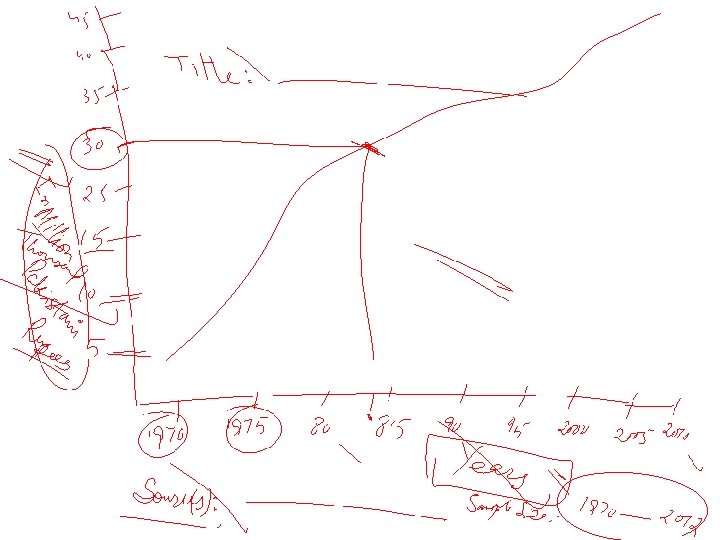
Designing Diagrams and Tables For both diagrams and tables • Does it have a brief but clear and descriptive title? • Are the units of measurement used stated clearly? • Are the sources of data used stated clearly? • Are there notes to explain abbreviations and unusual terminology? • Does it state the size of the sample on which the values in the table are based?
Designing Diagrams and Tables For diagrams • Does it have clear axis labels? • Are bars and their components in the same logical sequence? • Is more dense shading used for smaller areas? • Have you avoided misrepresenting or distorting the data Is a key or legend included (where necessary)?
Designing Diagrams and Tables For tables • Does it have clear column and row headings? • Are columns and rows in a logical sequence?
Designing Diagrams and Tables • It best to begin exploratory analysis by looking at individual variables and their components. • The key aspects you may need to consider will be guided by your research question(s) and objectives, and are likely to include (Sparrow 1989): • specific values; highest and lowest values; trends over time; proportions; distributions.
Designing Diagrams and Tables • Once you have explored these, you can then begin to compare and look for relationships between variables, considering in addition (Sparrow 1989): • conjunctions (the point where values for two or more variables intersect); • totals; • interdependence and relationships.
Difference 21
Qualitative analysis process • There is no standardized procedure for analysing qualitative data. Despite this, it is still possible to group data into three main types of processes: Summarising (condensation) of meanings; Summarising, therefore, involves condensing the meaning of large amounts of text into fewer words. Categorization (grouping) of meanings; Involves two activities: developing categories and, subsequently, attaching these categories to meaningful chunks of data. Through doing this you will begin to recognize relationships and further develop the categories you are using to facilitate this. Structuring (ordering) of meanings using narrative. Narrative structuring ensures that the data are organised both temporally and with regard to the social or organizational contexts of the research participant (Kvale 1996). This form of analysis focuses upon the stories told during the interviews
Getting started with writing Practical hints • • Create time for your writing Write when your mind is fresh Find a regular writing place Set goals and achieve them Use word processing Generate a plan for the report Finish each writing session on a high point Get friends to read and comment on your work
Structuring your research report Suggested structure • • • Abstract Introduction Literature review Method Results Discussion Conclusions References Appendices
PRESENTATION • Know your work • Focus of your work • Related work • Objectives, methodology and main results and their linkages
PRESENTATION • Know your audiences • Have something for every one. Where possible be simple rather than using jargons or technical terms. • Be clear and careful with your words. • Confidence is mandatory.
The nature of research “There is no one best way for undertaking all research”.
Thank You very much and Good Luck