SCIENTIFIC RESEARCH METHODOLOGY QUANTITATIVE METHODOLOGY DATA COLLECTION DATA
")


 that involved in the study) §")


 Simple Systematic Non-Probability (Non Random) Stratified Cluster Convenience Proportional 1")


 Sources - where you will get the information; and 2)")


. Example:")


- Slides: 42
SCIENTIFIC RESEARCH METHODOLOGY: QUANTITATIVE METHODOLOGY (DATA COLLECTION, DATA ANALYSIS, DATA VISUALIZATION)
• Quantitative methodology stands for systematic empirical investigation of quantitative phenomenon and properties; • Numeric analysis and measurement are the key parts of quantitative method that state the fundamental connection between observation and analytical statement; • Statistics, tables and graphs, are often used to present the results of these methods. • Unit of analysis in quantitative methodology quantity: § § § Amounts Frequencies Degrees Values Intensity
QUALITATIVE QUANTITATIVE § Understand interpret human § Comparison or correlations of § Less generalizable to populations § Generalization to a populations § Rich description § Numerical summaries § Depth § Breadth § Small sample § Large sample § Selection of procedures to establish § Prescribe process to establish perspective trust in the findings population attributes reliability and validity
QUESTIONS: § DESCRIPTIVE § Describe what currently exists What is happening? How is something happening? Why is something happening? § E. g: How common is e-learning and e-portfolio use amongst university students? § RELATIONAL § Addresses a relationship between the two variables or more § E. g: What is the relationship between student’s study habits to student’s achievements? § CAUSAL § Allow the researcher to draw causal inference (drawing a conclusion about a causal connection based on the conditions of the occurrence of an effect) § E. g: What fraction of past crimes could have been avoided by a given policy? Check it out!!! § How does the patient profile can exhibit the cost effective on patient’s treatment? § What is the effectiveness of analyzing disease patterns and tracking disease outbreaks to improve public health surveillance and speed response?
Descriptive Normative Correlation/Association Impact
DESCRIPTIVE § Summarize data (describing something (people, program) that involved in the study) § Statistics: histograms, means, percentages § E. g Research questions: How common is e-learning and e-portfolio use amongst university students? § can involve a one-time interaction with groups of people ( cross-sectional study ) or a study which might follow individuals over time ( longitudinal study ).
NORMATIVE § Normative expresses a value judgment about whether a situation is subjectively desirable or undesirable § Analysis of decision situation § How serious is the social media abuse amongst teenager students § Score value for each of the decision
CORRELATION/ASSOCIATIONAL � Only to relate variables � Predictions only made to show that a relationship exists � This is where test statistics (t, F, Chi. Square, Pearson coefficient) become important, along with the p-value (essentially the probability associated with the statistic) � Statistics: Correlation Coefficient, Single/ Multiple Regression
IMPACT/COMPARATIVE § Experimental design § Compares two or more groups § Looking for difference between groups § Has the drug awareness campaign had any impact on the level of university student drug use? § Common Statistics: t-tests, ANOVA (inferential statistics)
Variable § Element that is identified in the hypothesis or research question § Must be identified as independent or dependent § Independent Variable § Manipulation or variation of this variable is the cause of change in other variables § Technically, independent variable is the term reserved for experimental studies § Also called antecedent variable, experimental variable, treatment variable, causal variable, predictor variable § Dependent Variable § The variable of primary interest § Research question/hypothesis describes, explains, or predicts changes in it § The variable that is influenced or changed by the independent variable § In non-experimental research, also called criterion variable, outcome variable 10
§Correlation §Experimental §Survey §Meta-Analysis §Quantitative Case Study
§ To find if the data has an observable relationship that can be further specified in terms of magnitude and/or an increase or decrease § Correlation indicates the strength and direction of a linear relationship between variables § Looking for: These relationships may § Is there a relationship between two variables/data? show any tendency for the § What is the direction of the relationship? variables to vary consistently. § What is the magnitude? Pearson’s product moment coefficient correlation: -1. 0 to +1. 0
§ Research in which the investigator deliberately controls and manipulates the independent variable to observe the effect of that change on another the dependent variable. § Compare two or more groups that are similar except for one factor or variable § Statistical analysis of data § Conditions are highly controlled; variables are manipulated by the researcher: “The effects of” “The influence of…”
§ Use set of predetermined questions § Collect answers from representative sample § Surveys are not the same thing as Questionnaires! § That is, in-depth interviews, observation, content analysis could also be used in survey research. § Questionnaires are a specific method for obtaining a structured set of survey data.
§ Also called single case design § Describes numerically a specific case (can be group or individual) § May test or generate hypotheses § Results often presented with tables and graphs
Commonly used terms… “She has a valid point” “My car is unreliable” …in science… “The conclusion of the study was not valid” “The findings of the study were not reliable”.
§ Validity: whether the instrument is measuring what it is intended to measure. Does the test measure theoretical construct which is intended to measure - Factor analysis approach - Hypothesis method - Convergent and divergent Does the test appear at face value where it is suppose to measure Face Validity Construct Validity Content Validity Whether the individual items of a test represent what you actually want to assess VALIDITY The extent to which a procedure allows accurate predictions about a subject’s future behavior - the test provides a valid reflection of future performance using a similar test Predictive Validity Concurrent Validity The extent to which a procedure correlates with the current behavior of subjects - The test produces similar results to a previously validated test
RELIABILITY - The consistency of measurements RELIABLE TEST - Produces similar scores across various conditions and situations, including different evaluators and testing environments TEST-RETEST 1 ALTERNATE FORM TEST 1 SPLIT HALF TEST 1 TEST 2 INTERNAL CONSISTENCY TEST 1 Calculated using Cronbach’s alpha Strategies for establishing instrument reliability
two different version of instrument Instrument: IQ test/survey correlate scores administer of the same test TEST-RETEST 1 ALTERNATE FORM TEST 1 SPLIT HALF treat each half as a one test or different administer of a survey the correlation between these two total scores TEST 1 TEST 2 correlate scores administer of two different form of the same test INTERNAL CONSISTENCY several of the split-half -> lists them as SH with a subscript -> calculate α use the Cronbach’s alpha to calculate the consistency of the split half
SAMPLING STRATEGIES Probability (Random) Simple Systematic Non-Probability (Non Random) Stratified Cluster Convenience Proportional 1 stage Quota Dis-proportional multistage Judgmental Snowball
plan a detailed of procedures that aims to gather data for the purpose of answering a research question process of gathering and measuring information on targeted variables in an established systematic fashion, which then enables one to answer relevant questions and evaluate outcomes. systematic approach to gather information from a variety of sources to get a complete and accurate picture of an area of interest.
COLLECTING DATA INVOLVES: 1) Sources - where you will get the information; and 2) Methods - how you will collect /gather the information
SOURCE From where or from whom will you get the information? § Existing information – records, reports, program documents, logs, journals § People – participants, parents, volunteers, teachers
SOURCE Secondary and Primary Data: § Secondary Data – data which someone else has collected § Example of sources: County health departments, Vital Statistics – birth, death, Hospital, clinic, school nurse records, Private and foundation databases, City and county governments, Surveillance data from state government programs § Limitation: what you are looking for is not there. When it is been collected? How long? Is the data set complete? Data consistent? Exists sample selection bias? Data reliable? § Advantage: No need to reinvent the wheel (if someone found the data, take advantage of it), save time, save money, it may accurate § Primary Data – data which you collected § Example of sources: surveys, experiment, simulation § Limitation: Do you have time and money for? , uniqueness (only subject to population studies), researcher error
§ Quantitative nature: § produce numbers § more structured and allow for aggregation and generalization. § Harder to develop § Easier to analyze § Quantitative data analysis o making sense of numbers o Using numbers to inform decision-making
NOMINAL - Ordering of the value has no meaning. - categories(number as label). Example: Gender -> 1. Female, 2. Male - Analysis: frequencies, mean, median, mode ORDINAL - Ranked - Number allocated to a quantitative scale. Example: examination result - Can be used to code answer in questionnaire. Example: 1. Strongly Disagree - Analysis: ranked categories (example: satisfaction) frequencies INTERVAL - Include intervals between numbers. Example: year number RATIO - Interval data with a true zero point
DATA ANALYSIS: STAGES IN QUANTITATIVE DATA ANALYSIS Preparing Tables Organizing Verifying Collecting Summary …………… Checking Consistency across tables Analyzing Each Table Performance - Trends Profile - Compare with Norms Summary ……………
§ Common mistake!!! – not everything can be quantified § Descriptive Statistics – describe about group § Sum – total § How? : add all numbers § Mean – the average of all numbers § How? : Add up all of the numbers and divide by total sample size § Median - The middle number, when all of the numbers are arranged in increasing order § How? : Put numbers in order from least to greatest, and find the middle number. If you have an even-sized sample the median is the mean of the two middle numbers.
§ Range - The spread between the smallest and largest number in the sample. § How? : Find the smallest and largest numbers. Subtract the smallest from the largest. § Standard Deviation - A commonly used measure of how spread out individual numbers are from the median § How? : Take the square root of the variance § Variance - A measure of the variation in the sample, or how spread out it is. How far does each number vary from the mean? § Inferential Statistics: Used to show relationships between variables. Can be used to explain or predict these relationships
1. Univariate - simplest form, describe a case in terms of a single variable. 2. Bivariate - subgroup comparisons, describe a case in terms of two variables simultaneously. 3. Multivariate - analysis of two or more variables simultaneously.
§ Describing a case in terms of the § Frequency distributions Example: § Gender - number of women, number of men. § Measures of central tendency § Mean, Median, Mode distribution of attributes that comprise it. § You should always begin your analysis by running the basic univariate frequencies and checking to be sure data were entered properly Goals: § Provide reader with the fullest degree of detail regarding the data. § Present data in a manageable from. § Simple and straightforward
§ Describe a case in terms of two variables simultaneously. § (e. g. , the relation between gender and college graduation) § Presentation: Cross Tabulation or Correlation Coefficient § It allows to: § Look at associations/relationships among two variables. (is there a line? ) § Look at measures of the strength of the relationship between two variables. (how strong is the line? ) § Test hypotheses about relationships between two nominal or ordinal level variables.
§ Analysis of more than two variables simultaneously. § (e. g. , the relationship between gender, race, and college graduation) § Can be used to understand the relationship between multiple variables more fully. § Most typical: Multiple Regression analysis and many other methods (Clustering, Principal, Discriminant Analysis etc. )
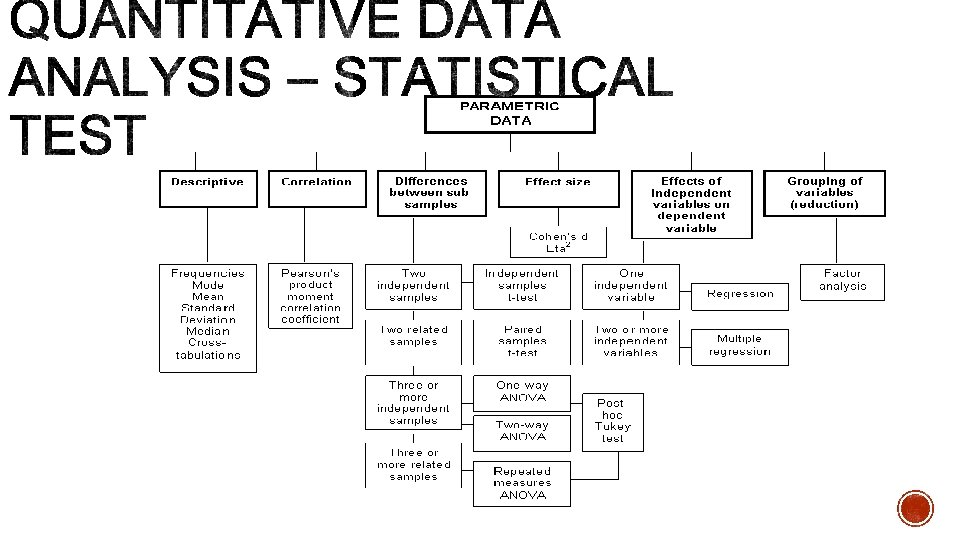
§ Statistical Test: Variety of statistical test – Chi Square test, T-test, z- test, Regression, ANOVA and etc. § Significance - a concept that measures the degree to which your results can be obtained due to chance. § Level of Significance • expressed in percentage and indicate as p value • if we had a result of p =1. 00, then there would be a 100% possibility that the results were all completely by chance. • we want our results to be as accurate as possible, so we set our significance levels as low as possible - usually at 5% (p = 0. 05), or better still, at 1% (p = 0. 01)
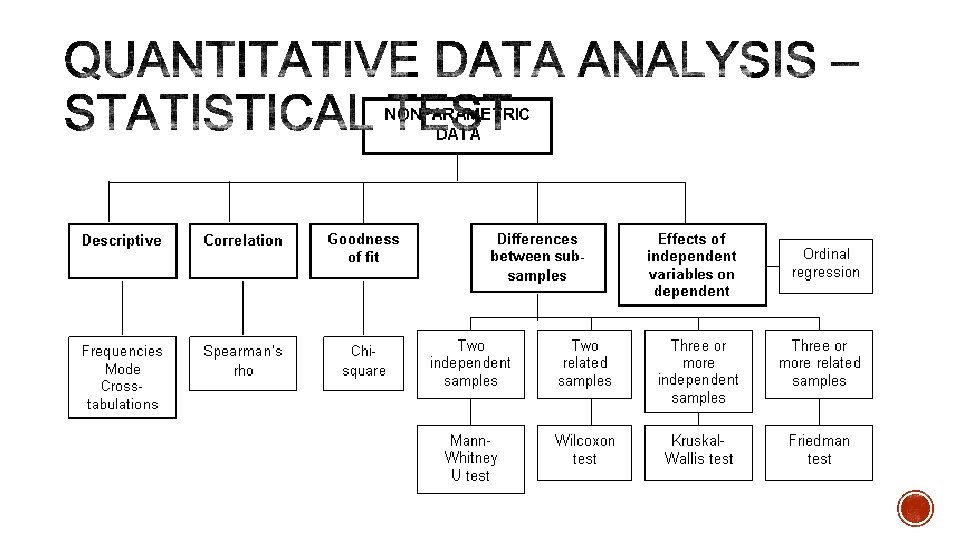
§ Non Parametric Statistical Test: § Mann-Whitney U Test: used to test for differences between 2 independent groups on a continuous measure, e. g. do males and females differ in terms of their levels of self-esteem. § Spearman Rank Correlation Test: used to demonstrate the relationship between two ranked variables. Frequently used to compare judgements by a group of judges on two objects, or the scores of a group of subjects on two measures.
§ Tables § Simplest way to summarize data § Data are presented as absolute numbers or percentages § Charts and graphs § Visual representation of numerical data and, if well designed, will convey the general patterns of the data § Data are presented as absolute numbers or percentages
§ Ensure graphic has a title § Label the components of your graphic § Indicate source of data with date § Provide number of observations (n=xx) as a reference point § Add footnote if more information is needed
§ Charts and graphs are used to portray: § Trends, relationships, and comparisons § Represent many different types of data. § The most informative are simple and self-explanatory § Use the right chart!!!!! § Bar chart: comparisons, categories of data § Line graph: display trends over time § Pie chart: show percentages or proportional share