Repurposing raw monitoring data for VM anomalies detection




- Slides: 25


Re-purposing raw monitoring data for VM anomalies detection, with ESPER Data Analytics from Monitoring, for Alarming M. Adam, C. Cordeiro, D. Giordano IT-CM-RPS 24/02/2016 - Analytics WG meeting

“To monitor or monitoring generally means to be aware of the state of a system, to observe a situation for any changes which may occur over time”

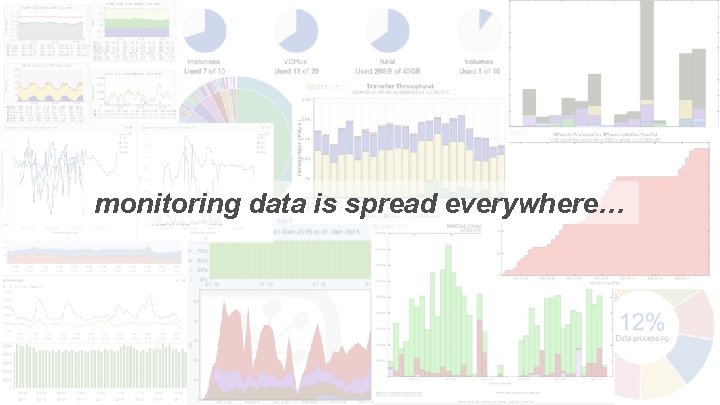
monitoring data is spread everywhere…

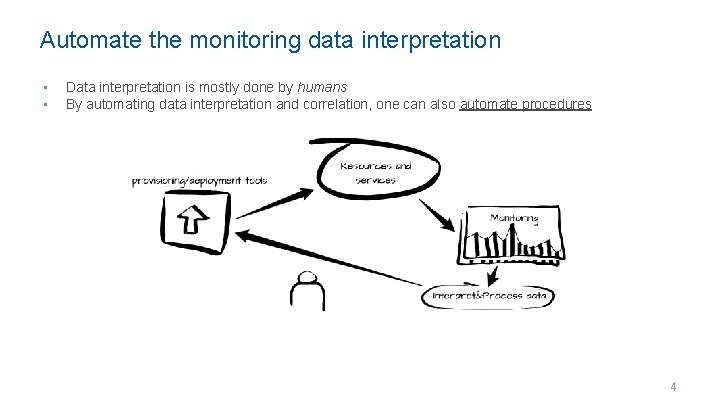
Automate the monitoring data interpretation • • Data interpretation is mostly done by humans By automating data interpretation and correlation, one can also automate procedures 4

So… can we use monitoring data to spot dark resources and other anomalies? Sure! It would also be cool if I could do that automatically… You can… …in real-time? ? Yep Well, what about some alarms and data analysis as well? 5

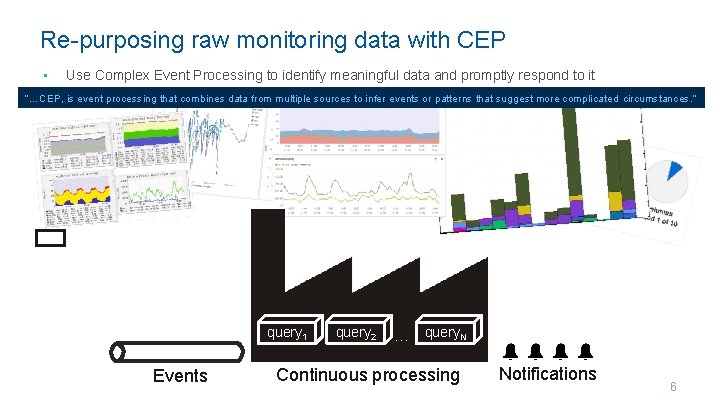
Re-purposing raw monitoring data with CEP • Use Complex Event Processing to identify meaningful data and promptly respond to it “…CEP, is event processing that combines data from multiple sources to infer events or patterns that suggest more complicated circumstances. ” query 1 Events query 2 … query. N Continuous processing Notifications 6

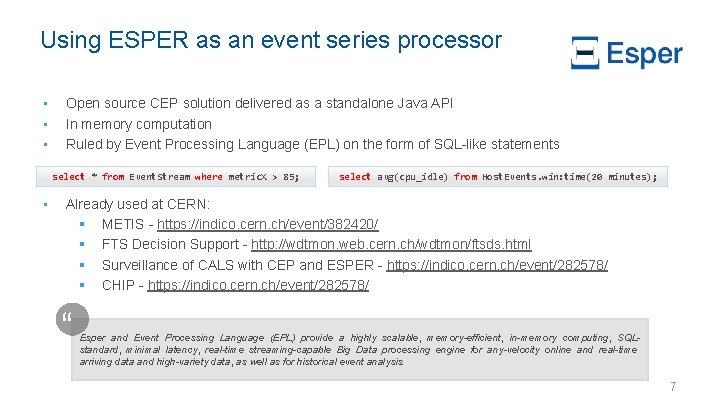
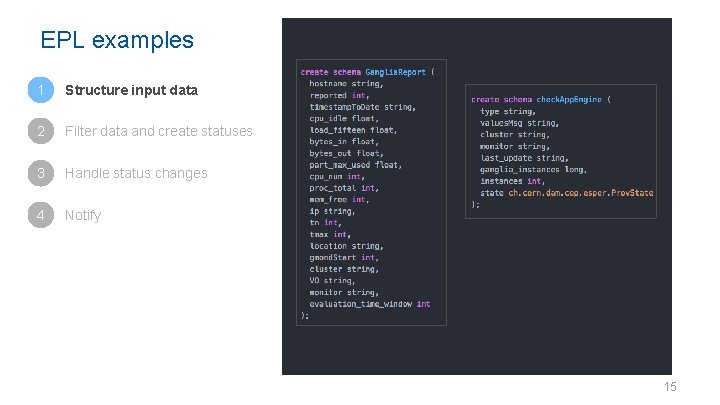
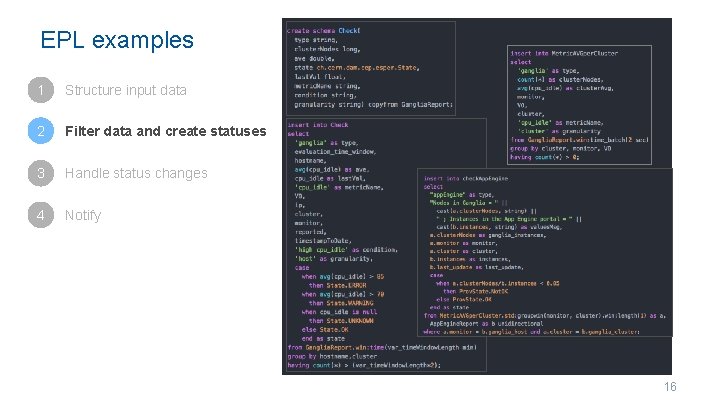
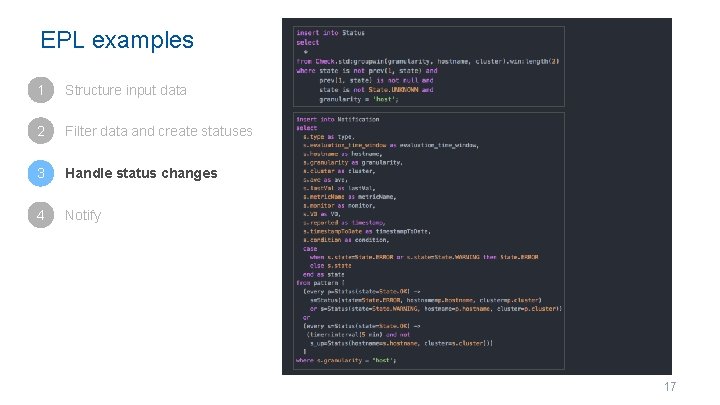
Using ESPER as an event series processor • • • Open source CEP solution delivered as a standalone Java API In memory computation Ruled by Event Processing Language (EPL) on the form of SQL-like statements select * from Event. Stream where metric. X > 85; • select avg(cpu_idle) from Host. Events. win: time(20 minutes); Already used at CERN: § METIS - https: //indico. cern. ch/event/382420/ § FTS Decision Support - http: //wdtmon. web. cern. ch/wdtmon/ftsds. html § Surveillance of CALS with CEP and ESPER - https: //indico. cern. ch/event/282578/ § CHIP - https: //indico. cern. ch/event/282578/ “ Esper and Event Processing Language (EPL) provide a highly scalable, memory-efficient, in-memory computing, SQLstandard, minimal latency, real-time streaming-capable Big Data processing engine for any-velocity online and real-time arriving data and high-variety data, as well as for historical event analysis. 7

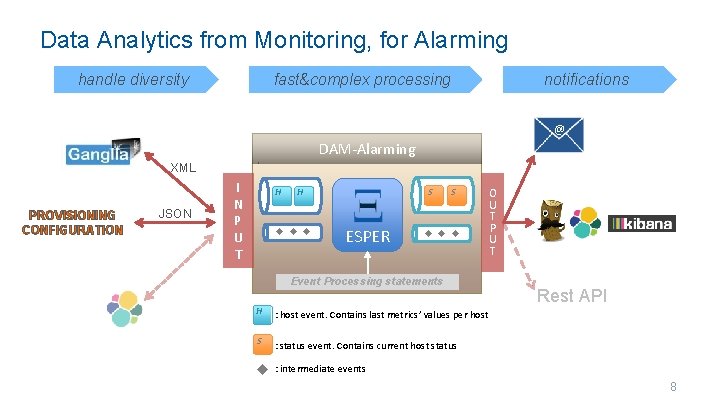
Data Analytics from Monitoring, for Alarming handle diversity fast&complex processing notifications @ DAM-Alarming XML PROVISIONING CONFIGURATION JSON I N P U T H H S ESPER S Event Processing statements H : host event. Contains last metrics’ values per host S : status event. Contains current host status O U T P U T Rest API : intermediate events 8

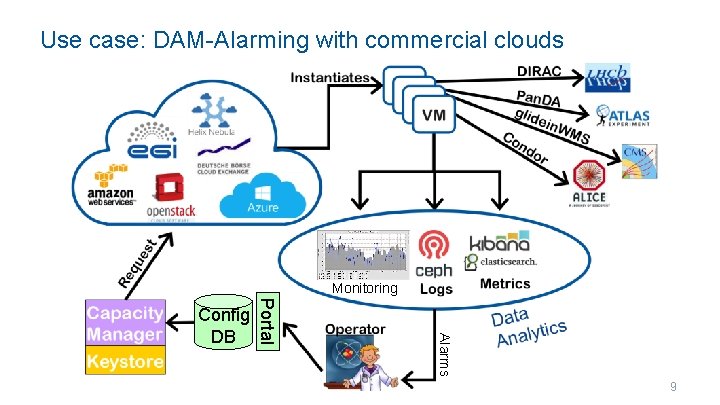
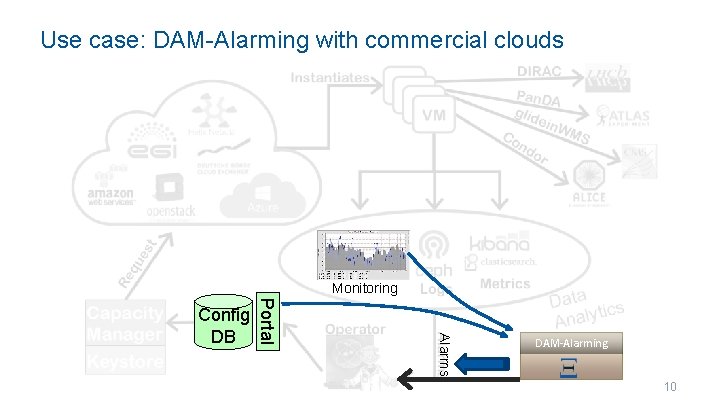
Use case: DAM-Alarming with commercial clouds Monitoring Alarms Portal Config DB 9

Use case: DAM-Alarming with commercial clouds Monitoring Alarms Portal Config DB DAM-Alarming 10

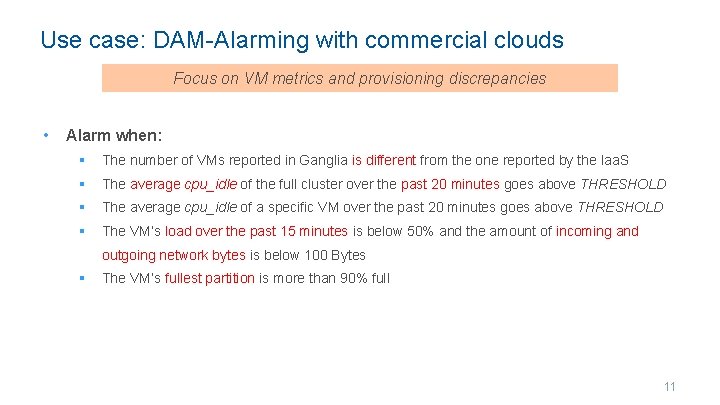
Use case: DAM-Alarming with commercial clouds Focus on VM metrics and provisioning discrepancies • Alarm when: § The number of VMs reported in Ganglia is different from the one reported by the Iaa. S § The average cpu_idle of the full cluster over the past 20 minutes goes above THRESHOLD § The average cpu_idle of a specific VM over the past 20 minutes goes above THRESHOLD § The VM’s load over the past 15 minutes is below 50% and the amount of incoming and outgoing network bytes is below 100 Bytes § The VM’s fullest partition is more than 90% full 11

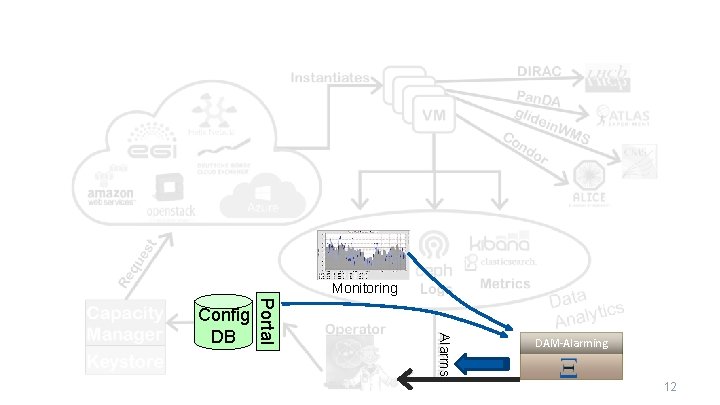
Monitoring Alarms Portal Config DB DAM-Alarming 12

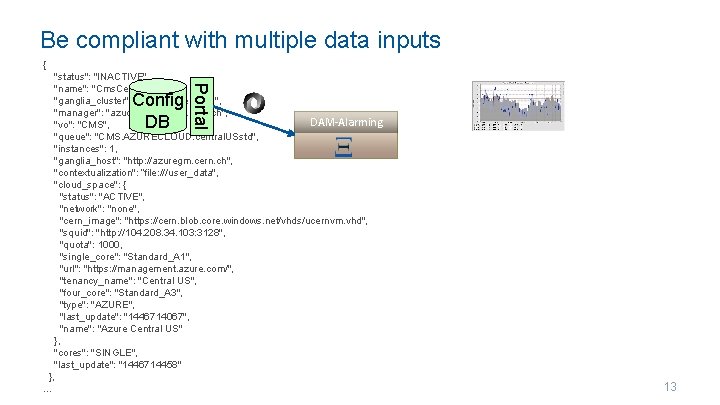
Be compliant with multiple data inputs { Config DB Portal "status": "INACTIVE", "name": "Cms. Central. US", "ganglia_cluster": "CMS. Azure. Cloud", "manager": "azucern-operator. cern. ch", DAM-Alarming "vo": "CMS", "queue": "CMS. AZURECLOUD. central. USstd", "instances": 1, "ganglia_host": "http: //azuregm. cern. ch", "contextualization": ”file: ///user_data", "cloud_space": { "status": "ACTIVE", "network": "none", "cern_image": "https: //cern. blob. core. windows. net/vhds/ucernvm. vhd", "squid": "http: //104. 208. 34. 103: 3128", "quota": 1000, "single_core": "Standard_A 1", "url": "https: //management. azure. com/", "tenancy_name": "Central US", "four_core": "Standard_A 3", "type": "AZURE", "last_update": "1446714067", "name": "Azure Central US" }, "cores": "SINGLE", "last_update": "1446714458" }, … 13

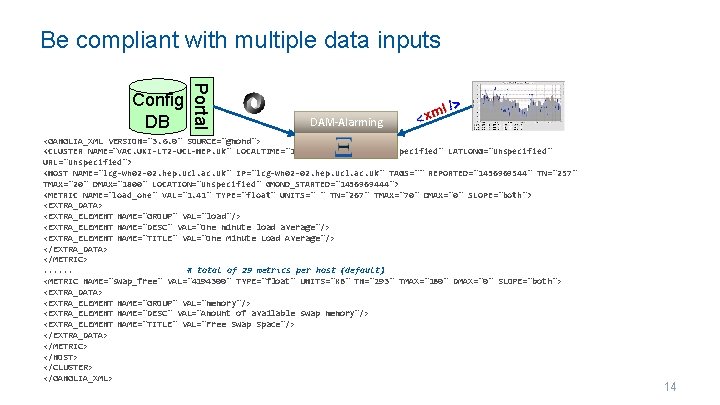
Be compliant with multiple data inputs Portal Config DB DAM-Alarming <GANGLIA_XML VERSION="3. 6. 0" SOURCE="gmond"> <CLUSTER NAME="VAC. UKI-LT 2 -UCL-HEP. uk" LOCALTIME="1436969801" OWNER="unspecified" LATLONG="unspecified" URL="unspecified"> <HOST NAME="lcg-wn 02 -02. hep. ucl. ac. uk" IP="lcg-wn 02 -02. hep. ucl. ac. uk" TAGS="" REPORTED="1436969544" TN="257" TMAX="20" DMAX="1800" LOCATION="unspecified" GMOND_STARTED="1436969444"> <METRIC NAME="load_one" VAL="1. 41" TYPE="float" UNITS=" " TN="267" TMAX="70" DMAX="0" SLOPE="both"> <EXTRA_DATA> <EXTRA_ELEMENT NAME="GROUP" VAL="load"/> <EXTRA_ELEMENT NAME="DESC" VAL="One minute load average"/> <EXTRA_ELEMENT NAME="TITLE" VAL="One Minute Load Average"/> </EXTRA_DATA> </METRIC>. . . # total of 29 metrics per host (default) <METRIC NAME="swap_free" VAL="4194300" TYPE="float" UNITS="KB" TN="293" TMAX="180" DMAX="0" SLOPE="both"> <EXTRA_DATA> <EXTRA_ELEMENT NAME="GROUP" VAL="memory"/> <EXTRA_ELEMENT NAME="DESC" VAL="Amount of available swap memory"/> <EXTRA_ELEMENT NAME="TITLE" VAL="Free Swap Space"/> </EXTRA_DATA> </METRIC> </HOST> </CLUSTER> </GANGLIA_XML> 14

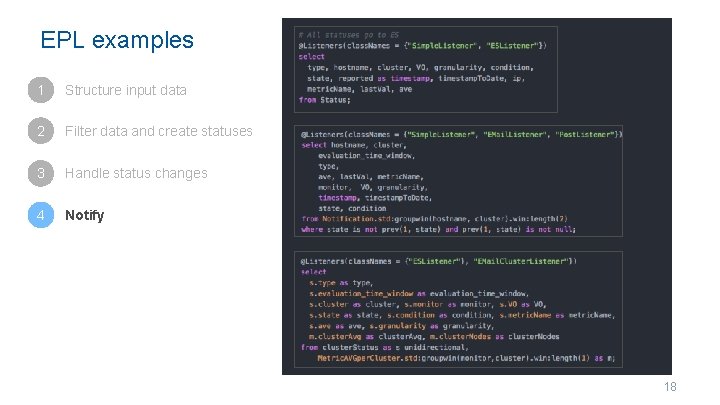
EPL examples 1 Structure input data 2 Filter data and create statuses 3 Handle status changes 4 Notify 15

EPL examples 1 Structure input data 2 Filter data and create statuses 3 Handle status changes 4 Notify 16

EPL examples 1 Structure input data 2 Filter data and create statuses 3 Handle status changes 4 Notify 17

EPL examples 1 Structure input data 2 Filter data and create statuses 3 Handle status changes 4 Notify 18

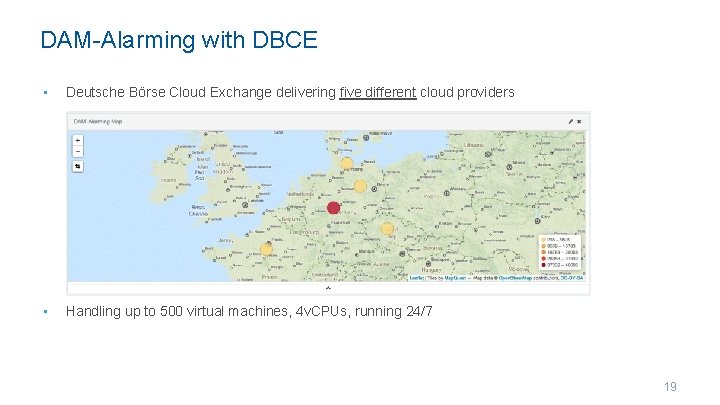
DAM-Alarming with DBCE • Deutsche Börse Cloud Exchange delivering five different cloud providers • Handling up to 500 virtual machines, 4 v. CPUs, running 24/7 19

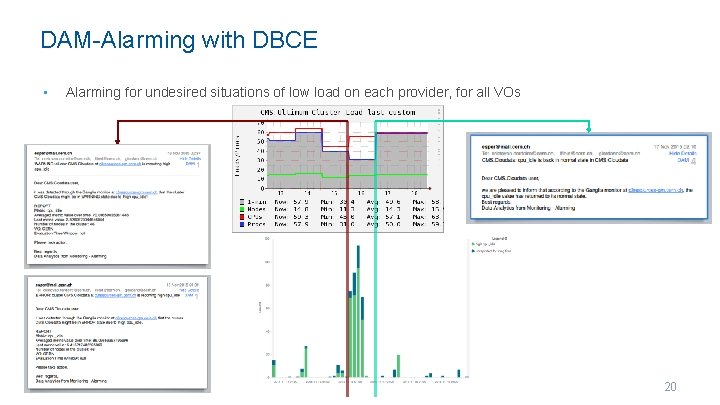
DAM-Alarming with DBCE • Alarming for undesired situations of low load on each provider, for all VOs 20

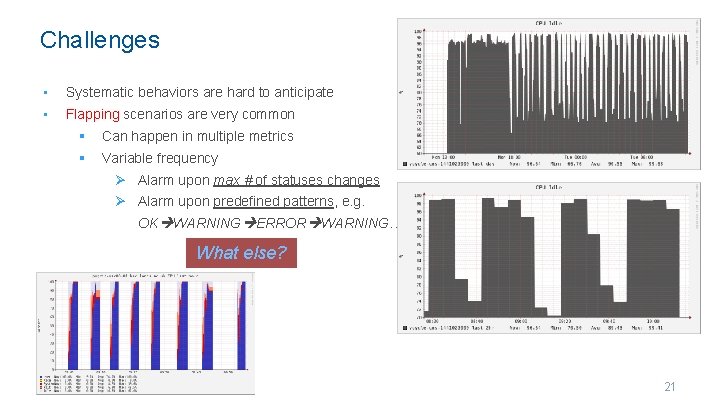
Challenges • Systematic behaviors are hard to anticipate • Flapping scenarios are very common § Can happen in multiple metrics § Variable frequency Ø Alarm upon max # of statuses changes Ø Alarm upon predefined patterns, e. g. OK WARNING ERROR WARNING… What else? 21

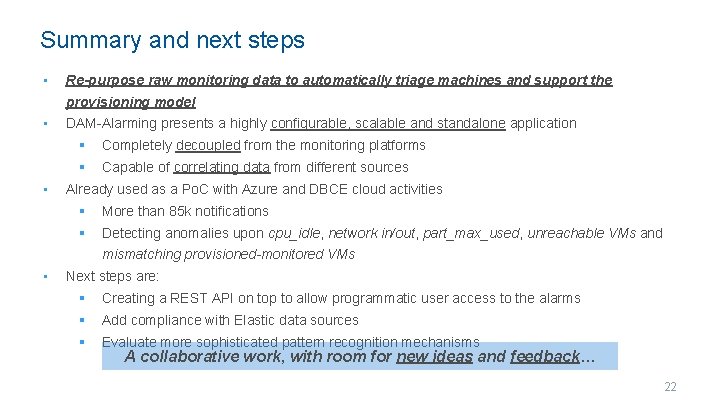
Summary and next steps • Re-purpose raw monitoring data to automatically triage machines and support the provisioning model • • DAM-Alarming presents a highly configurable, scalable and standalone application § Completely decoupled from the monitoring platforms § Capable of correlating data from different sources Already used as a Po. C with Azure and DBCE cloud activities § More than 85 k notifications § Detecting anomalies upon cpu_idle, network in/out, part_max_used, unreachable VMs and mismatching provisioned-monitored VMs • Next steps are: § Creating a REST API on top to allow programmatic user access to the alarms § Add compliance with Elastic data sources § Evaluate more sophisticated pattern recognition mechanisms A collaborative work, with room for new ideas and feedback… 22

https: //dashb-es-dev. cern. ch: 444/#/dashboard/DAM-Alarming http: //sdccloud. web. cern. ch/sdccloud/DAM-Alarming/index. html 23

Copyrights • Wikipedia logo, traced from https: //en. wikipedia. org/wiki/History_of_Wikipedia#/media/File: Wikipedia-logo-v 2. svg is licensed under the CC BY-SA 3. 0 license. • XML logo is licensed under the Creative Commons Attribution-Share Alike 3. 0 Unported, 2. 5 Generic, 2. 0 Generic and 1. 0 Generic license.