
Trading Costs of Asset Pricing Anomalies Andrea Frazzini




- Slides: 43
Trading Costs of Asset Pricing Anomalies Andrea Frazzini AQR Capital Management Ronen Israel AQR Capital Management Tobias J. Moskowitz University of Chicago and NBER Copyright 2012 © by Andrea Frazzini, Ronen Israel, and Tobias J. Moskowitz. The views and opinions expressed herein are those of the author and do not necessarily reflect the views of AQR Capital Management, LLC its affiliates, or its employees. The information set forth herein has been obtained or derived from sources believed by author to be reliable. However, the author does not make any representation or warranty, express or implied, as to the information’s accuracy or completeness, nor does the author recommend that the attached information serve as the basis of any investment decision. This document is intended exclusively for the use of the person to whom it has been delivered by the author, and it is not to be reproduced or redistributed to any other person. This presentation is strictly for AQR Capital Management, LLC | Two Greenwich Plaza, Third Floor | Greenwich, CT 06830 | T: 203. 742. 3600 | F: 203. 742. 3100 | www. aqr. com educational purposes only.
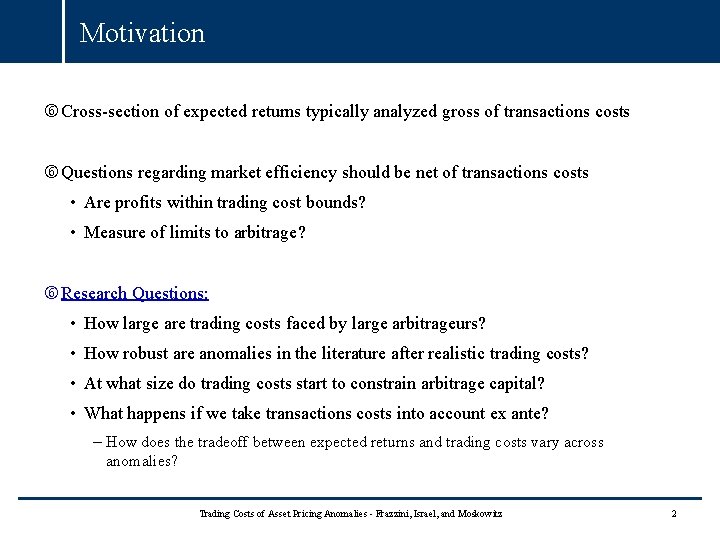
Motivation Cross-section of expected returns typically analyzed gross of transactions costs Questions regarding market efficiency should be net of transactions costs • Are profits within trading cost bounds? • Measure of limits to arbitrage? Research Questions: • How large are trading costs faced by large arbitrageurs? • How robust are anomalies in the literature after realistic trading costs? • At what size do trading costs start to constrain arbitrage capital? • What happens if we take transactions costs into account ex ante? – How does the tradeoff between expected returns and trading costs vary across anomalies? Trading Costs of Asset Pricing Anomalies - Frazzini, Israel, and Moskowitz 2
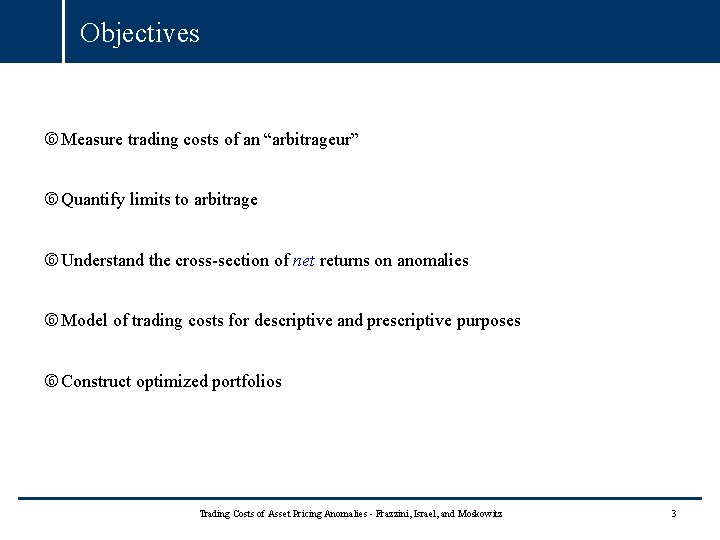
Objectives Measure trading costs of an “arbitrageur” Quantify limits to arbitrage Understand the cross-section of net returns on anomalies Model of trading costs for descriptive and prescriptive purposes Construct optimized portfolios Trading Costs of Asset Pricing Anomalies - Frazzini, Israel, and Moskowitz 3
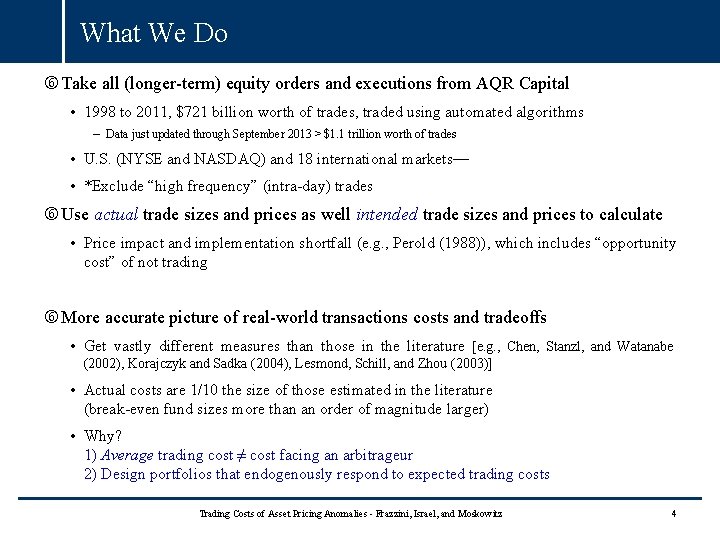
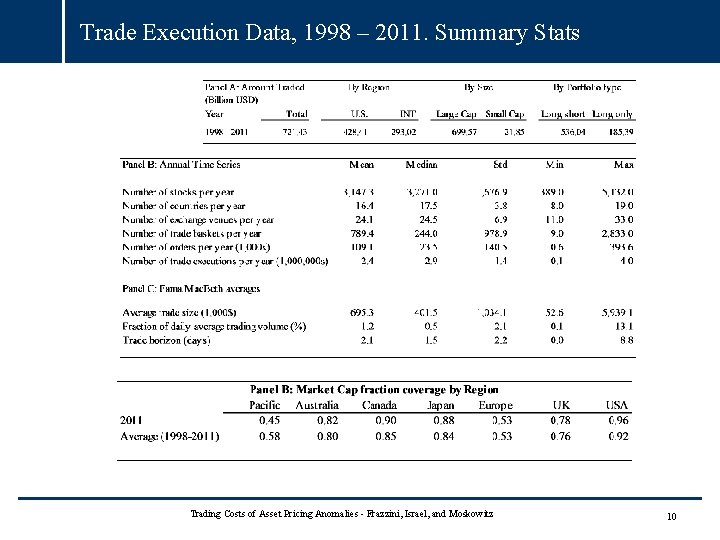
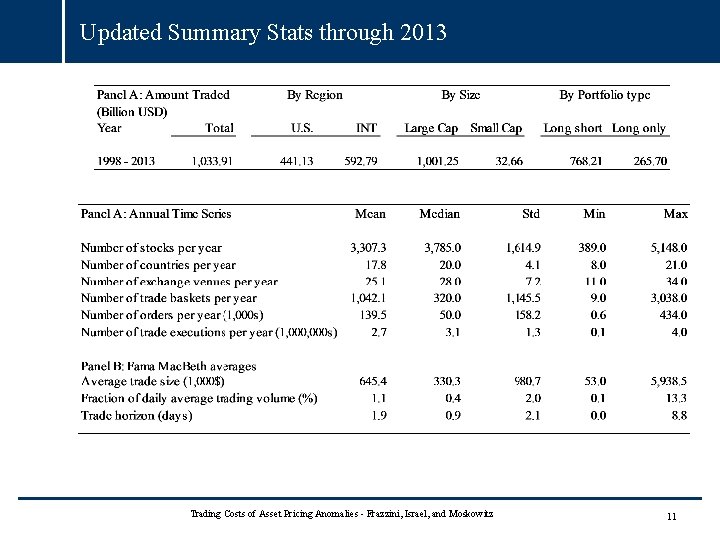
What We Do Take all (longer-term) equity orders and executions from AQR Capital • 1998 to 2011, $721 billion worth of trades, traded using automated algorithms – Data just updated through September 2013 > $1. 1 trillion worth of trades • U. S. (NYSE and NASDAQ) and 18 international markets— • *Exclude “high frequency” (intra-day) trades Use actual trade sizes and prices as well intended trade sizes and prices to calculate • Price impact and implementation shortfall (e. g. , Perold (1988)), which includes “opportunity cost” of not trading More accurate picture of real-world transactions costs and tradeoffs • Get vastly different measures than those in the literature [e. g. , Chen, Stanzl, and Watanabe (2002), Korajczyk and Sadka (2004), Lesmond, Schill, and Zhou (2003)] • Actual costs are 1/10 the size of those estimated in the literature (break-even fund sizes more than an order of magnitude larger) • Why? 1) Average trading cost ≠ cost facing an arbitrageur 2) Design portfolios that endogenously respond to expected trading costs Trading Costs of Asset Pricing Anomalies - Frazzini, Israel, and Moskowitz 4
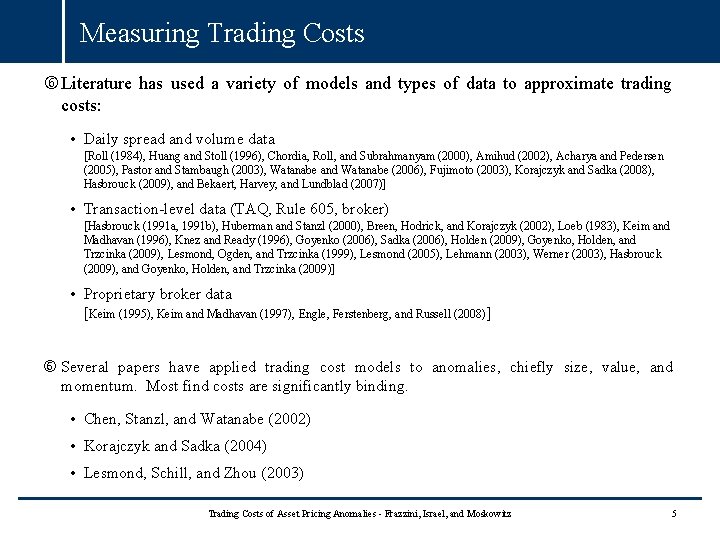
Measuring Trading Costs Literature has used a variety of models and types of data to approximate trading costs: • Daily spread and volume data [Roll (1984), Huang and Stoll (1996), Chordia, Roll, and Subrahmanyam (2000), Amihud (2002), Acharya and Pedersen (2005), Pastor and Stambaugh (2003), Watanabe and Watanabe (2006), Fujimoto (2003), Korajczyk and Sadka (2008), Hasbrouck (2009), and Bekaert, Harvey, and Lundblad (2007)] • Transaction-level data (TAQ, Rule 605, broker) [Hasbrouck (1991 a, 1991 b), Huberman and Stanzl (2000), Breen, Hodrick, and Korajczyk (2002), Loeb (1983), Keim and Madhavan (1996), Knez and Ready (1996), Goyenko (2006), Sadka (2006), Holden (2009), Goyenko, Holden, and Trzcinka (2009), Lesmond, Ogden, and Trzcinka (1999), Lesmond (2005), Lehmann (2003), Werner (2003), Hasbrouck (2009), and Goyenko, Holden, and Trzcinka (2009)] • Proprietary broker data [Keim (1995), Keim and Madhavan (1997), Engle, Ferstenberg, and Russell (2008)] Several papers have applied trading cost models to anomalies, chiefly size, value, and momentum. Most find costs are significantly binding. • Chen, Stanzl, and Watanabe (2002) • Korajczyk and Sadka (2004) • Lesmond, Schill, and Zhou (2003) Trading Costs of Asset Pricing Anomalies - Frazzini, Israel, and Moskowitz 5
Key Differences with the Literature Based on our live, realized trading cost data, we find very different results • Actual costs are 1/10 the size of those estimated in the literature • Break even fund sizes more than an order of magnitude larger Why? • Models used in the literature too conservative • Data represents the average trade (aggregated over all informed, retail, and institutional traders), our costs closer to the marginal trader • Portfolios considered do not address tcosts in any way (or in a very limited way) In addition we provide • Unique look at intent of the trade (model price), novel estimates for shorting, covering, etc. • tcosts internationally (18 markets) on same strategies simultaneously • Are there simple changes that can be made to a portfolio that increase net returns? • What are the tradeoffs? Trading Costs of Asset Pricing Anomalies - Frazzini, Israel, and Moskowitz 6
Trading Execution Algorithm *The portfolio generation process is separate from the trading process - algorithms do not make any explicit aggregate buy or sell decisions • Merely determines duration of a trade (most within 1 day, max is 3 days) The trades are executed using proprietary, automated trading algorithms designed and built by the “manager” (aka Ronen) • Direct market access through electronic exchanges • Provide rather than demand liquidity using a systematic approach that sets opportunistic, liquidity-providing limit orders • Break up total orders into smaller orders and dynamically manage them • Randomize size, time, orders, etc. to limit market impact • Limit prices are set to buy stocks at bid or below and sell stocks at ask or above generally We consider all of the above as part of the “trading cost” of a large arbitrageur Trading Costs of Asset Pricing Anomalies - Frazzini, Israel, and Moskowitz 7
Trading Execution Database Trade execution database from AQR Capital Management • Institutional investor, around 90. 2 billion USD in assets (November 2013) • Data compiled by the execution desk and covers all trades executed algorithmically in any of the firm’s funds sinception (excluding HFTs) Information on orders, execution prices and quantities, and intended prices and quantities • August 1998 to December 2011 (being updated through 2013) • Common stocks only: restrict to cash equity and equity swaps • 19 Developed markets (drop emerging markets trades) • Drop high frequency/statistical arbitrage trades • Result: 9, 128 global stocks , 0. 72 trillion USD worth of trades (updated to 1. 1 trillion USD) Price, return and volume data • Union of the CRSP tapes and the Xpress. Feed Global database • All available common stocks between July 1926 and December 2011 Trading Costs of Asset Pricing Anomalies - Frazzini, Israel, and Moskowitz 8
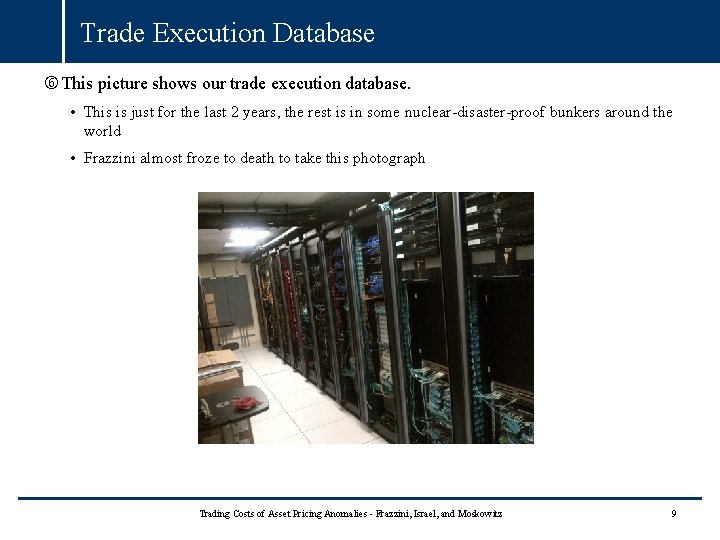
Trade Execution Database This picture shows our trade execution database. • This is just for the last 2 years, the rest is in some nuclear-disaster-proof bunkers around the world • Frazzini almost froze to death to take this photograph Trading Costs of Asset Pricing Anomalies - Frazzini, Israel, and Moskowitz 9
Trade Execution Data, 1998 – 2011. Summary Stats Trading Costs of Asset Pricing Anomalies - Frazzini, Israel, and Moskowitz 10
Updated Summary Stats through 2013 Trading Costs of Asset Pricing Anomalies - Frazzini, Israel, and Moskowitz 11
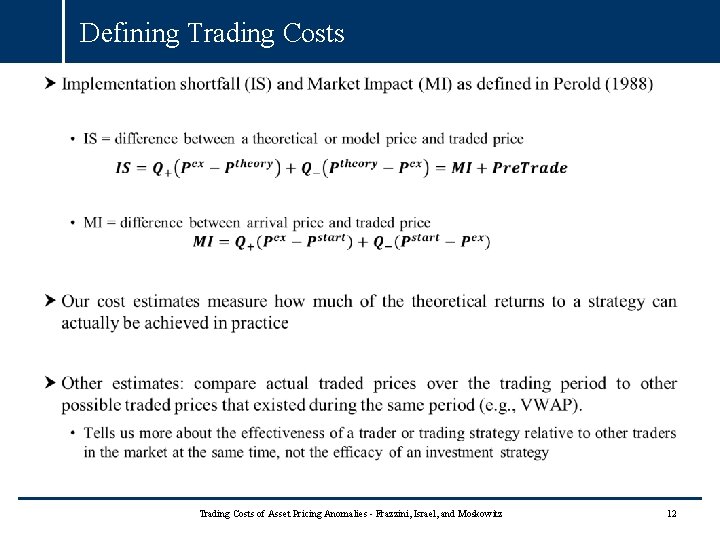
Defining Trading Costs of Asset Pricing Anomalies - Frazzini, Israel, and Moskowitz 12
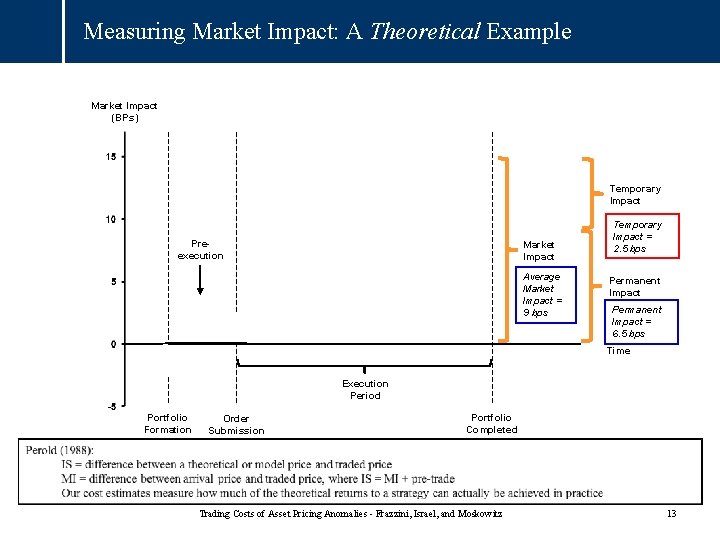
Measuring Market Impact: A Theoretical Example Market Impact (BPs) Temporary Impact Execution Prices Preexecution Market Impact Average Market Impact = 9 bps Temporary Impact = 2. 5 bps Permanent Impact = 6. 5 bps Time Execution Click to edit Master title style Period Portfolio Formation Order Submission Portfolio Completed Trading Costs of Asset Pricing Anomalies - Frazzini, Israel, and Moskowitz 13
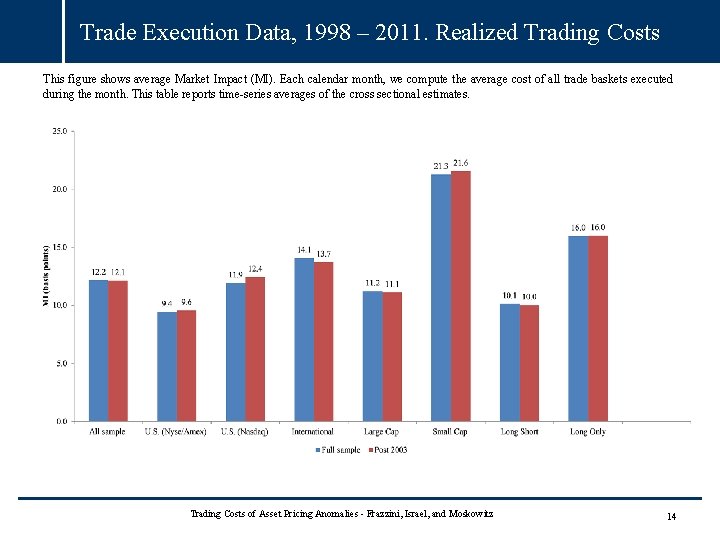
Trade Execution Data, 1998 – 2011. Realized Trading Costs This figure shows average Market Impact (MI). Each calendar month, we compute the average cost of all trade baskets executed during the month. This table reports time-series averages of the cross sectional estimates. Trading Costs of Asset Pricing Anomalies - Frazzini, Israel, and Moskowitz 14
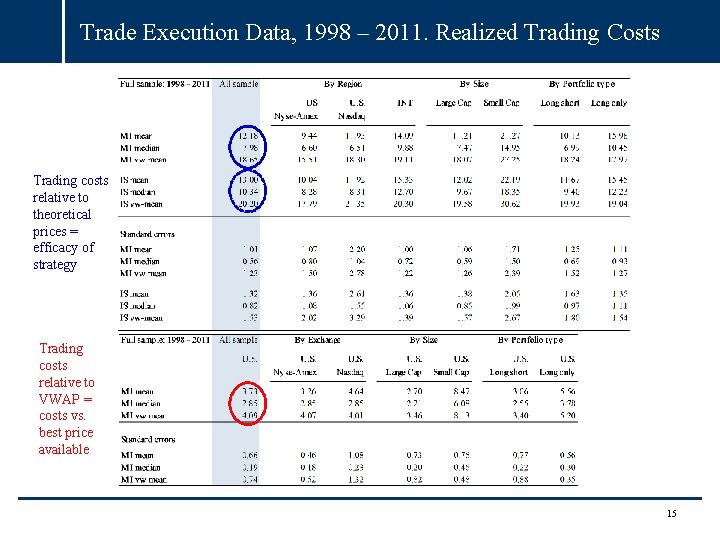
Trade Execution Data, 1998 – 2011. Realized Trading Costs Trading costs relative to theoretical prices = efficacy of strategy Trading costs relative to VWAP = costs vs. best price available 15
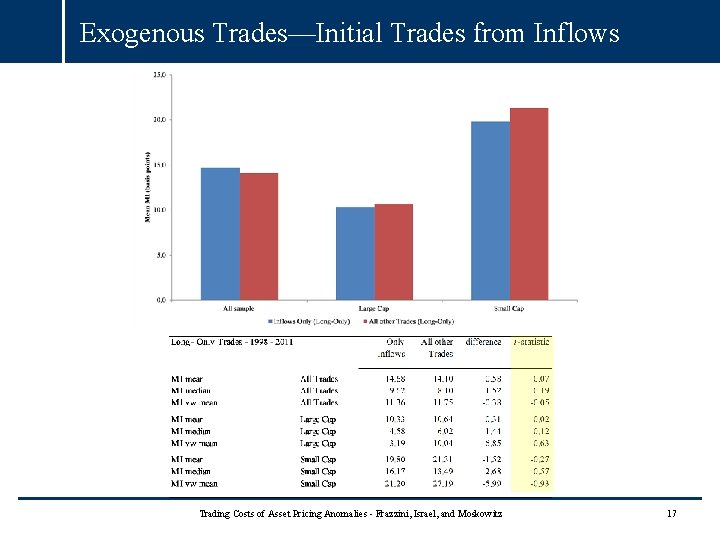
Interpretation How generalizable are the results? How exogenous are trading costs to the portfolios being traded by our manager? Trading costs we estimate are fairly independent from the portfolios being traded. 1. Only examine live trades of longer-term strategies, where portfolio formation process is separate from the trading process executing it. 2. Set of intended trades is primarily created from specific client mandates that often adhere to a benchmark subject to a tracking error constraint of a few percent. 3. Manager uses proprietary trading algorithms, but algorithms cannot make any buy or sell decisions. Only determine duration of trade (1 -3 days). 4. Exclude all high frequency trading. We also examine only the first trade from new inflows. Trading Costs of Asset Pricing Anomalies - Frazzini, Israel, and Moskowitz 16
Exogenous Trades—Initial Trades from Inflows Trading Costs of Asset Pricing Anomalies - Frazzini, Israel, and Moskowitz 17
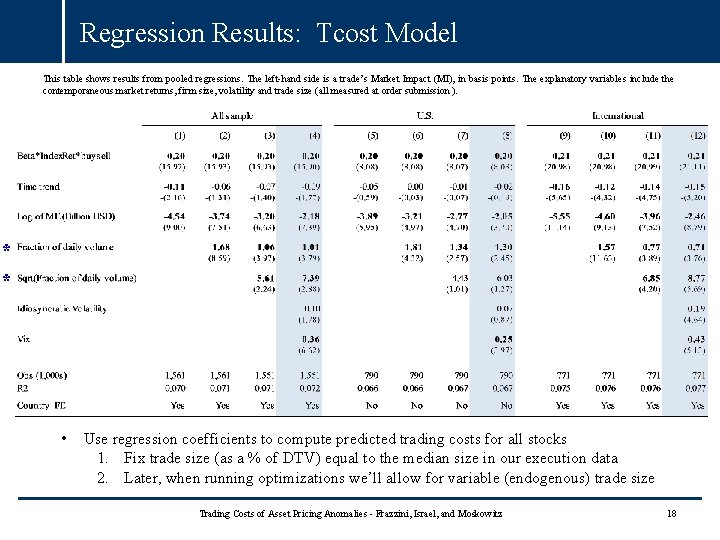
Regression Results: Tcost Model This table shows results from pooled regressions. The left-hand side is a trade’s Market Impact (MI), in basis points. The explanatory variables include the contemporaneous market returns, firm size, volatility and trade size (all measured at order submission ). * * • Use regression coefficients to compute predicted trading costs for all stocks 1. Fix trade size (as a % of DTV) equal to the median size in our execution data 2. Later, when running optimizations we’ll allow for variable (endogenous) trade size Trading Costs of Asset Pricing Anomalies - Frazzini, Israel, and Moskowitz 18
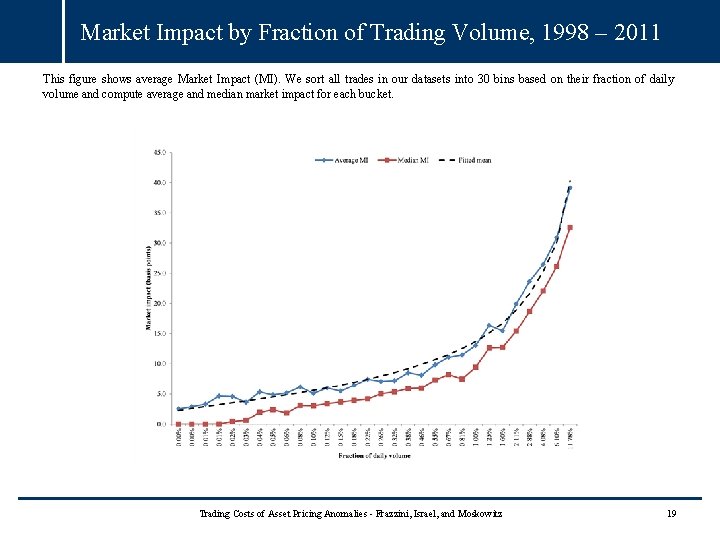
Market Impact by Fraction of Trading Volume, 1998 – 2011 This figure shows average Market Impact (MI). We sort all trades in our datasets into 30 bins based on their fraction of daily volume and compute average and median market impact for each bucket. Trading Costs of Asset Pricing Anomalies - Frazzini, Israel, and Moskowitz 19
Portfolios and Samples Our portfolio construction closely follows Fama and French (1992, 1993, and 1996) and Asness and Frazzini (2012) • Consider SMB, HML, UMD, STR, Val. Mom and Combo of all four • Form portfolios within country and compute a global factor by weighting each country’s portfolio by the country’s total (lagged) market capitalization Trading Execution sample , 1998 -2011 • All stocks with trading cost data over the prior 6 months at portfolio formation Trading Costs of Asset Pricing Anomalies - Frazzini, Israel, and Moskowitz 20
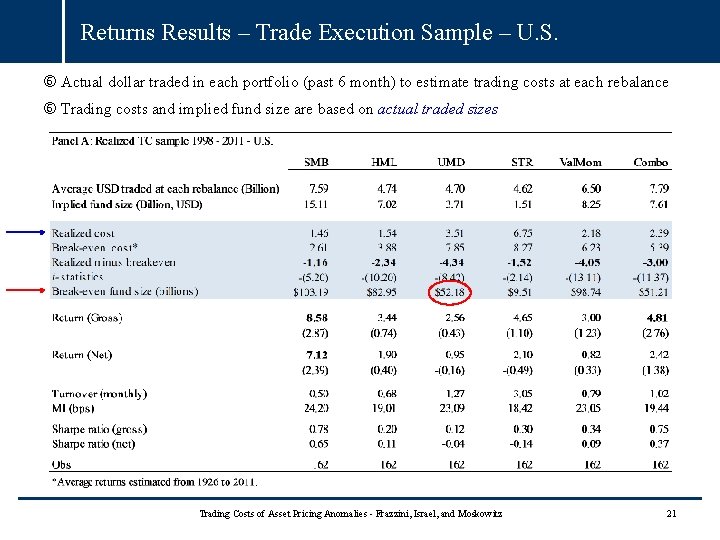
Returns Results – Trade Execution Sample – U. S. Actual dollar traded in each portfolio (past 6 month) to estimate trading costs at each rebalance Trading costs and implied fund size are based on actual traded sizes Trading Costs of Asset Pricing Anomalies - Frazzini, Israel, and Moskowitz 21
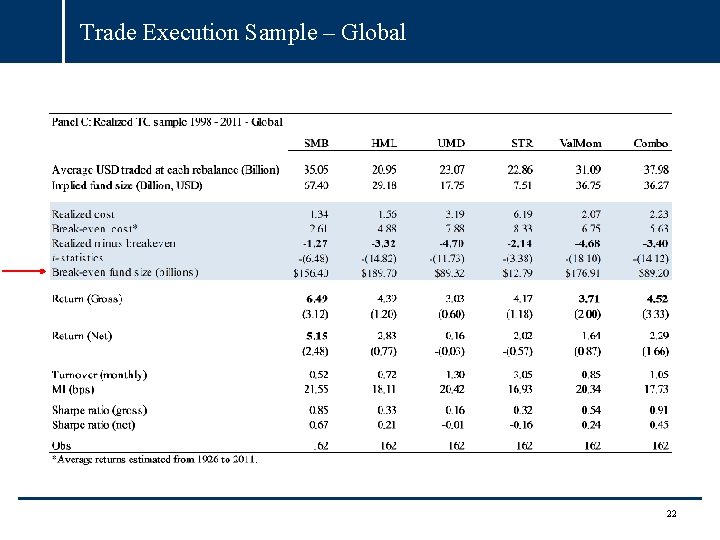
Trade Execution Sample – Global 22
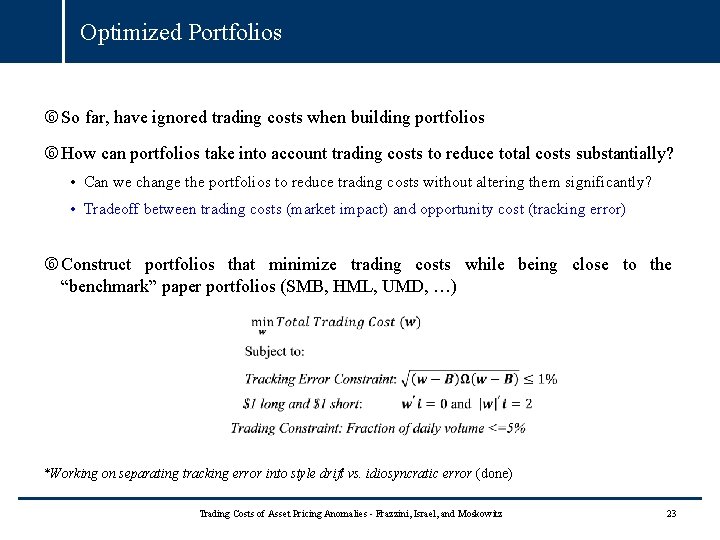
Optimized Portfolios So far, have ignored trading costs when building portfolios How can portfolios take into account trading costs to reduce total costs substantially? • Can we change the portfolios to reduce trading costs without altering them significantly? • Tradeoff between trading costs (market impact) and opportunity cost (tracking error) Construct portfolios that minimize trading costs while being close to the “benchmark” paper portfolios (SMB, HML, UMD, …) *Working on separating tracking error into style drift vs. idiosyncratic error (done) Trading Costs of Asset Pricing Anomalies - Frazzini, Israel, and Moskowitz 23
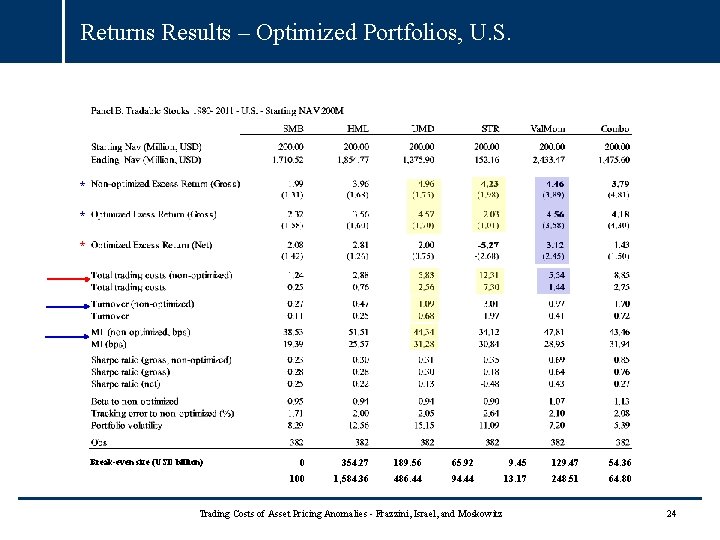
Returns Results – Optimized Portfolios, U. S. * * * Break-even size (USD billion) 0 354. 27 189. 56 65. 92 9. 45 129. 47 54. 36 100 1, 584. 36 486. 44 94. 44 13. 17 248. 51 64. 80 Trading Costs of Asset Pricing Anomalies - Frazzini, Israel, and Moskowitz 24
Trading Cost vs. Tracking Error Frontier, U. S. Trading Costs of Asset Pricing Anomalies - Frazzini, Israel, and Moskowitz 25
Trading Cost vs. Tracking Error Frontier, U. S. Trading Costs of Asset Pricing Anomalies - Frazzini, Israel, and Moskowitz 26
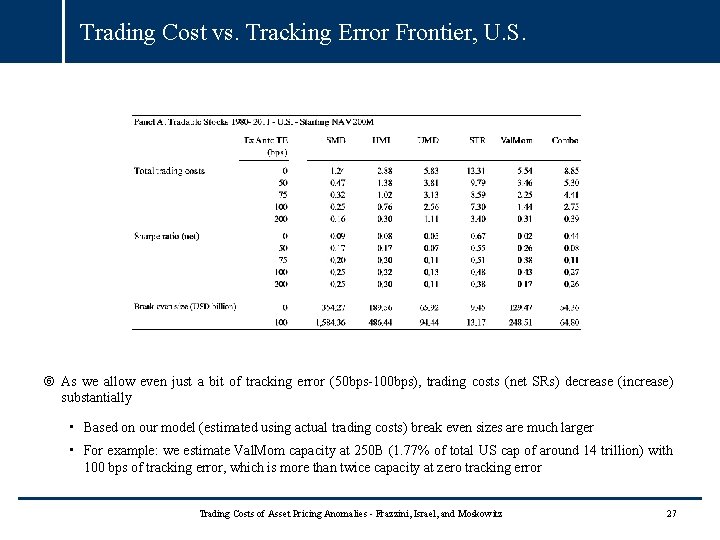
Trading Cost vs. Tracking Error Frontier, U. S. As we allow even just a bit of tracking error (50 bps-100 bps), trading costs (net SRs) decrease (increase) substantially • Based on our model (estimated using actual trading costs) break even sizes are much larger • For example: we estimate Val. Mom capacity at 250 B (1. 77% of total US cap of around 14 trillion) with 100 bps of tracking error, which is more than twice capacity at zero tracking error Trading Costs of Asset Pricing Anomalies - Frazzini, Israel, and Moskowitz 27
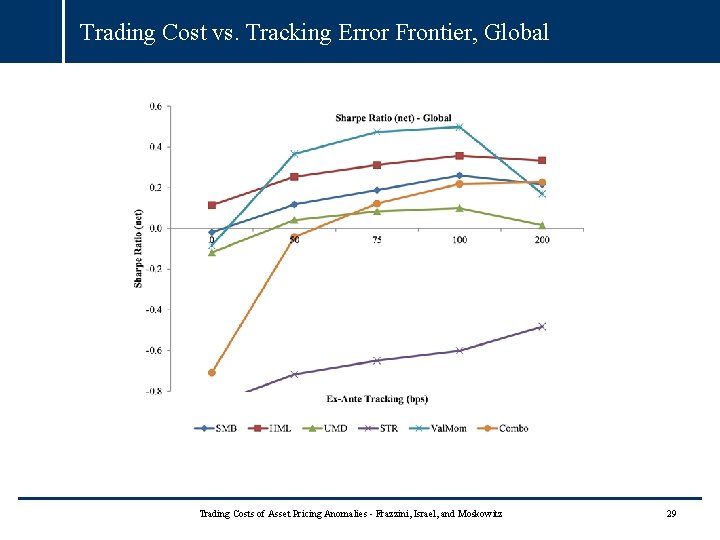
Trading Cost vs. Tracking Error Frontier, Global Trading Costs of Asset Pricing Anomalies - Frazzini, Israel, and Moskowitz 28
Trading Cost vs. Tracking Error Frontier, Global Trading Costs of Asset Pricing Anomalies - Frazzini, Israel, and Moskowitz 29
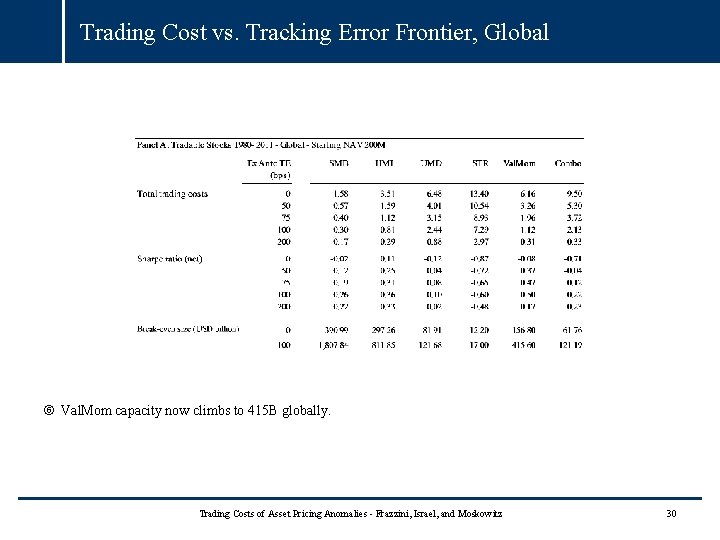
Trading Cost vs. Tracking Error Frontier, Global Val. Mom capacity now climbs to 415 B globally. Trading Costs of Asset Pricing Anomalies - Frazzini, Israel, and Moskowitz 30
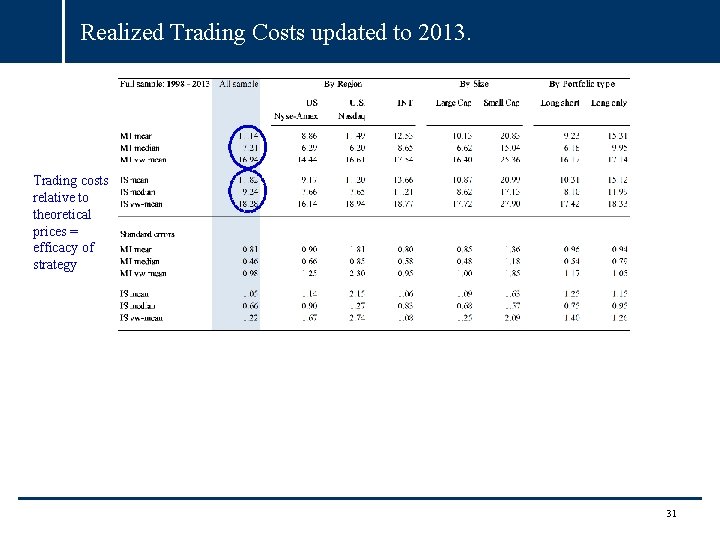
Realized Trading Costs updated to 2013. Trading costs relative to theoretical prices = efficacy of strategy 31
Conclusions Unique dataset of live trades to approximate the real trading costs of a large arbitrageur and apply them to standard asset pricing anomalies Our trading cost estimates are many times smaller (and break even capacities many times larger) than those previously claimed: 1. Not average trading costs, but closer to marginal trader’s cost 2. Construct portfolios to significantly reduce costs without incurring much tracking error Size, Val, Mom all survive tcosts at high capacity, but STR does not Fit a model from live traded data to compute expected trading costs based on observable firm and trade characteristics • We plan to make the coefficients and the price impact breakpoints available to researchers to be used to evaluate trading costs Trading Costs of Asset Pricing Anomalies - Frazzini, Israel, and Moskowitz 32
APPENDIX Trading Costs of Asset Pricing Anomalies - Frazzini, Israel, and Moskowitz 33
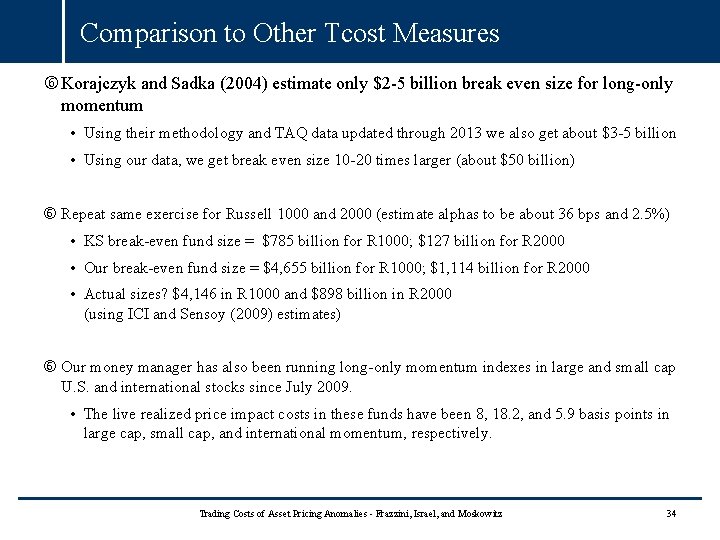
Comparison to Other Tcost Measures Korajczyk and Sadka (2004) estimate only $2 -5 billion break even size for long-only momentum • Using their methodology and TAQ data updated through 2013 we also get about $3 -5 billion • Using our data, we get break even size 10 -20 times larger (about $50 billion) Repeat same exercise for Russell 1000 and 2000 (estimate alphas to be about 36 bps and 2. 5%) • KS break-even fund size = $785 billion for R 1000; $127 billion for R 2000 • Our break-even fund size = $4, 655 billion for R 1000; $1, 114 billion for R 2000 • Actual sizes? $4, 146 in R 1000 and $898 billion in R 2000 (using ICI and Sensoy (2009) estimates) Our money manager has also been running long-only momentum indexes in large and small cap U. S. and international stocks since July 2009. • The live realized price impact costs in these funds have been 8, 18. 2, and 5. 9 basis points in large cap, small cap, and international momentum, respectively. Trading Costs of Asset Pricing Anomalies - Frazzini, Israel, and Moskowitz 34
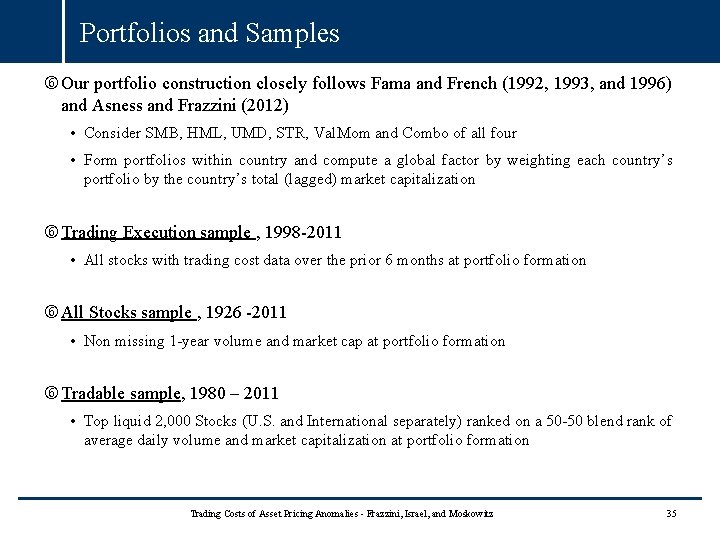
Portfolios and Samples Our portfolio construction closely follows Fama and French (1992, 1993, and 1996) and Asness and Frazzini (2012) • Consider SMB, HML, UMD, STR, Val. Mom and Combo of all four • Form portfolios within country and compute a global factor by weighting each country’s portfolio by the country’s total (lagged) market capitalization Trading Execution sample , 1998 -2011 • All stocks with trading cost data over the prior 6 months at portfolio formation All Stocks sample , 1926 -2011 • Non missing 1 -year volume and market cap at portfolio formation Tradable sample, 1980 – 2011 • Top liquid 2, 000 Stocks (U. S. and International separately) ranked on a 50 -50 blend rank of average daily volume and market capitalization at portfolio formation Trading Costs of Asset Pricing Anomalies - Frazzini, Israel, and Moskowitz 35
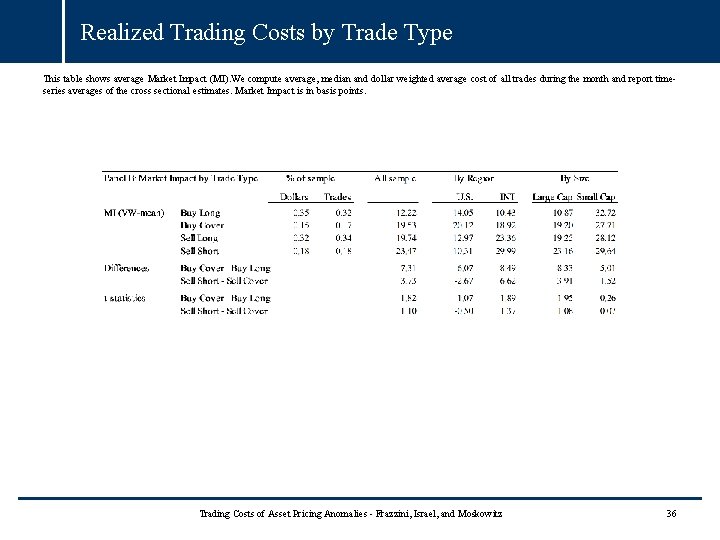
Realized Trading Costs by Trade Type This table shows average Market Impact (MI). We compute average, median and dollar weighted average cost of all trades during the month and report timeseries averages of the cross sectional estimates. Market Impact is in basis points. Trading Costs of Asset Pricing Anomalies - Frazzini, Israel, and Moskowitz 36
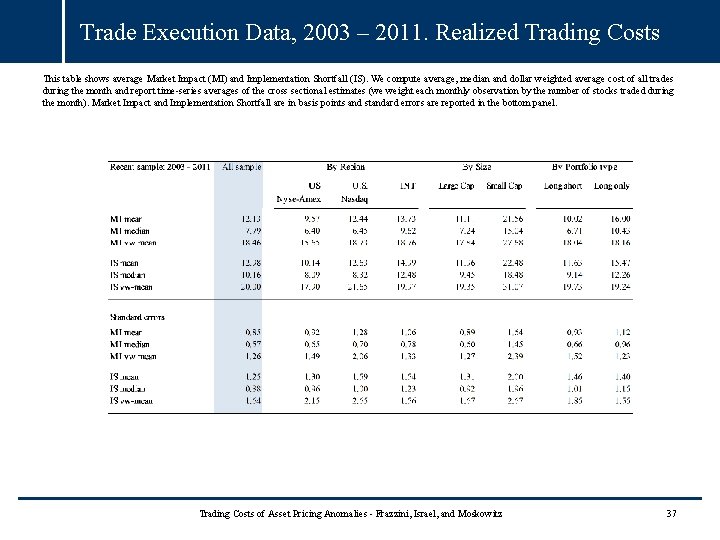
Trade Execution Data, 2003 – 2011. Realized Trading Costs This table shows average Market Impact (MI) and Implementation Shortfall (IS). We compute average, median and dollar weighted average cost of all trades during the month and report time-series averages of the cross sectional estimates (we weight each monthly observation by the number of stocks traded during the month). Market Impact and Implementation Shortfall are in basis points and standard errors are reported in the bottom panel. Trading Costs of Asset Pricing Anomalies - Frazzini, Israel, and Moskowitz 37
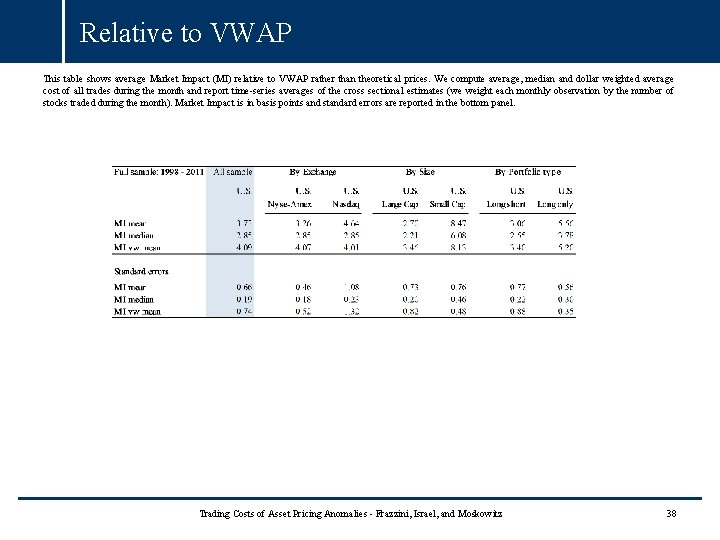
Relative to VWAP This table shows average Market Impact (MI) relative to VWAP rather than theoretical prices. We compute average, median and dollar weighted average cost of all trades during the month and report time-series averages of the cross sectional estimates (we weight each monthly observation by the number of stocks traded during the month). Market Impact is in basis points and standard errors are reported in the bottom panel. Trading Costs of Asset Pricing Anomalies - Frazzini, Israel, and Moskowitz 38
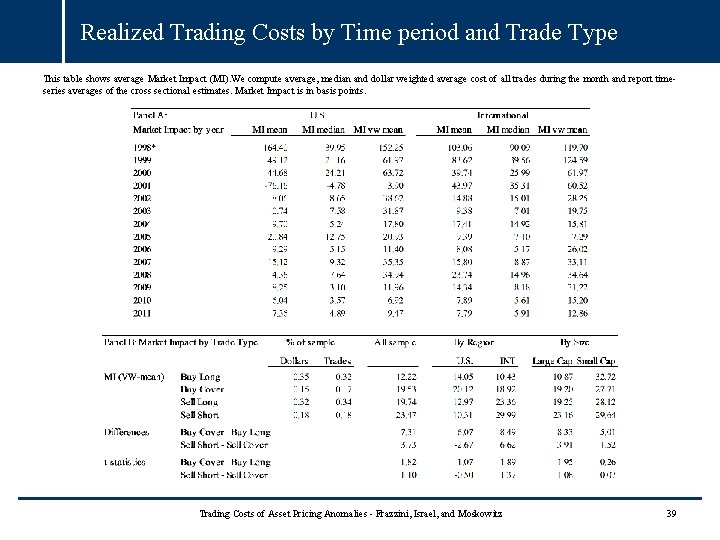
Realized Trading Costs by Time period and Trade Type This table shows average Market Impact (MI). We compute average, median and dollar weighted average cost of all trades during the month and report timeseries averages of the cross sectional estimates. Market Impact is in basis points. Trading Costs of Asset Pricing Anomalies - Frazzini, Israel, and Moskowitz 39
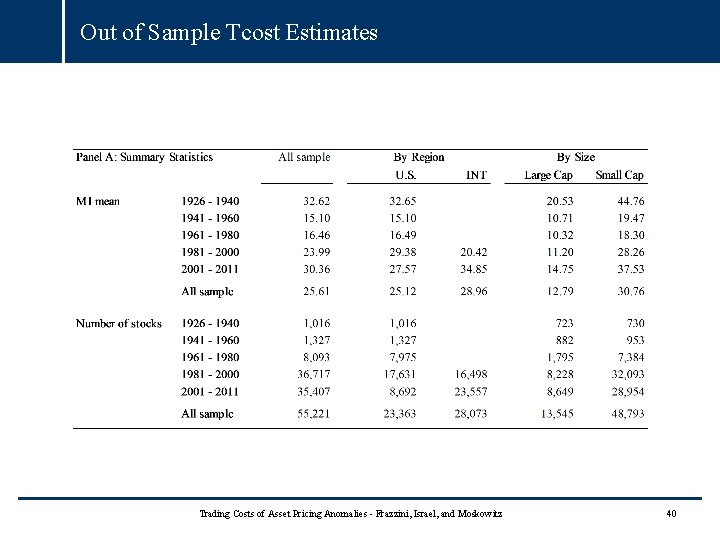
Out of Sample Tcost Estimates Trading Costs of Asset Pricing Anomalies - Frazzini, Israel, and Moskowitz 40
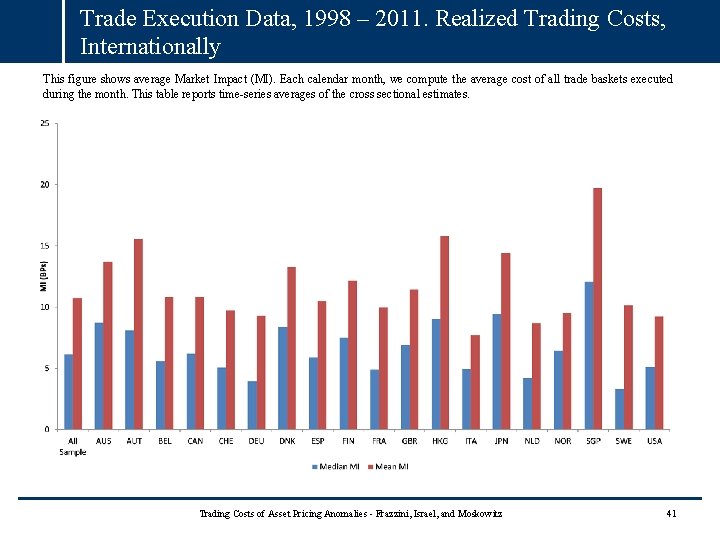
Trade Execution Data, 1998 – 2011. Realized Trading Costs, Internationally This figure shows average Market Impact (MI). Each calendar month, we compute the average cost of all trade baskets executed during the month. This table reports time-series averages of the cross sectional estimates. Trading Costs of Asset Pricing Anomalies - Frazzini, Israel, and Moskowitz 41
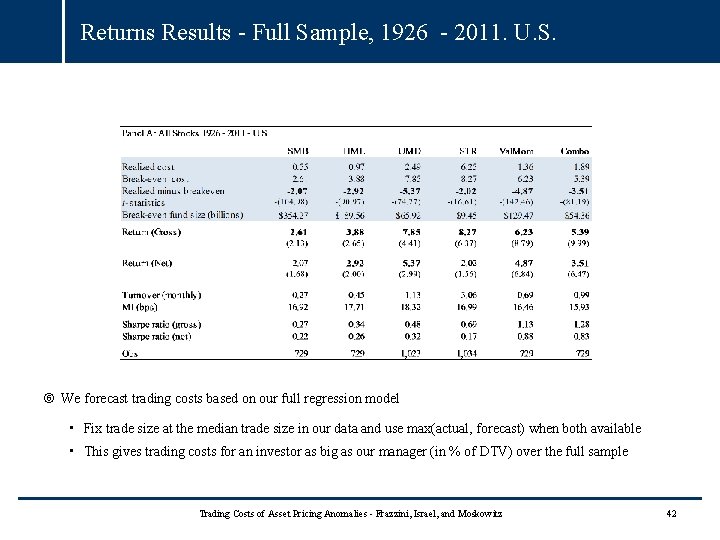
Returns Results - Full Sample, 1926 - 2011. U. S. We forecast trading costs based on our full regression model • Fix trade size at the median trade size in our data and use max(actual, forecast) when both available • This gives trading costs for an investor as big as our manager (in % of DTV) over the full sample Trading Costs of Asset Pricing Anomalies - Frazzini, Israel, and Moskowitz 42
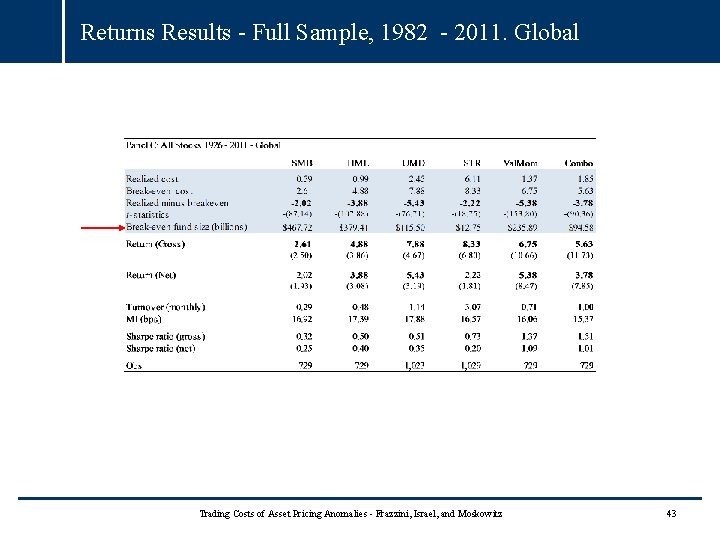
Returns Results - Full Sample, 1982 - 2011. Global Trading Costs of Asset Pricing Anomalies - Frazzini, Israel, and Moskowitz 43