Quality Circles History of Quality Circle Movement Quality


- Slides: 35

Quality Circles

History of Quality Circle Movement • Quality Circles were the logical consequence of the various waste elimination programs that were run in many Japanese corporations in early 50’s • QC provided a platform for the workers to get together and use techniques for their quest for continuous self development and organizational improvement • Prof Ishikawa launched the 1 st QC in Japan in May 1962 • S. R. Udpa – GM Operations BHEL launched first QC in Hyderabad plant of BHEL in 1980 • The success of QC prompted Mr Udpa any many other liked minded people to form the Quality Circle Forum of India, a non-profit organization with HQ in Hyderabad

Definition and Meaning • Quality Circle is a small group of employees in the same work area or doing a similar type of work who voluntarily meet regularly for about an hour every week to indentify and analyze and resolve work related problems, leading to improvement in their total performance and enrichment of their work life

Structure of Quality Circle

7 QC Tools The seven basic QC tools of Quality is a designation given to a fixed set of graphical techniques identified as being most helpful in troubleshooting issues related to quality They are called basic because they are suitable for people with little formal training in statistics and because they can be used to solve the vast majority of quality related issues • Cause and Effect Diagram • Check Sheet • Control Chart • Pareto Chart • Flow Charts • Histogram • Scatter Diagram

Cause and Effect Diagram Purpose: Graphical representation of the trail leading to the root cause of a problem How is it done? • Decide which quality characteristic, outcome or effect you want to examine (may use Pareto chart) • Backbone –draw straight line • Ribs – categories • Medium size bones –secondary causes • Small bones – root causes

Cause and Effect Diagram Benefits: • Breaks problems down into bite-size pieces to find root cause • Fosters team work • Common understanding of factors causing the problem • Road map to verify picture of the process • Follows brainstorming relationship

Cause and Effect Diagram Materials Manpower Typos Source info incorrect Didn’t follow proc. or Po Dyslexic Transposition Wrong source info in in tra Wrong purchase order g Incorrect shipping documents Glare on display Temp. Environme nt No training No communications Corrupt data No procedure Keyboard sticks Software problem Methods Machine

Check Sheets Purpose: – Tool for collecting and organizing measured or counted data – Data collected can be used as input data for other quality tools Benefits: – Collect data in a systematic and organized manner – To determine source of problem – To facilitate classification of data (stratification)

Control Charts

Pareto Analysis Purpose: Prioritize problems. Pareto diagram can be drawn by finding out which 20% causes 80% problems How is it done? • Create a preliminary list of problem classifications. • Tally the occurrences in each problem classification. • Arrange each classification in order from highest to lowest • Construct the bar chart

Flow Charts Benefits • Simplest of all flowcharts • Used for planning new processes or examining existing one • Keep people focused on the whole process How is it done? • List major steps • Write them across top of the chart • List sub-steps under each in order they occur Top Down

Flow Charts Benefits • Show what actually happens at each step in the process • Show what happens when nonstandard events occur • Graphically display processes to identify redundancies and other wasted effort How is it done? • Write the process step inside each symbol • Connect the Symbols with arrows showing the direction of flow Linear Toolbox

Airline ticket booking via Agent Sample Linear Flow

Histograms Purpose: To determine the spread or variation of a set of data points in a graphical form How is it done? : Collect data, 50 -100 data point Determine the range of the data Calculate the size of the class interval Divide data points into classes Determine the class boundary • Count # of data points in each class • Draw the histogram • • Stable process, exhibiting a bell shape

Scatter Diagrams Purpose: To identify the correlations that might exist between a quality characteristic and a factor that might be driving it • A scatter diagram shows the correlation between two variables in a process such as height and weight – These variables could be a Critical To Quality (CTQ) characteristic and a factor affecting it two factors affecting a CTQ or two related quality characteristics. • Dots representing data points are scattered on the diagram. – The extent to which the dots cluster together in a line across the diagram shows the strength with which the two factors are related.

Scatter Diagrams How is it done? : • Decide which paired factors you want to examine. Both factors must be measurable on some incremental linear scale. • Collect 30 to 100 paired data points. • Find the highest and lowest value for both variables. • Draw the vertical (y) and horizontal (x) axes of a graph. • Plot the data • Title the diagram The shape that the cluster of dots takes will tell you something about the relationship between the two variables that you tested.

QUALITY Model SITUATION LEVEL 1 LEVEL 2 LEVEL 3 LEVEL 4 Defects leave the Company Defects do not leave the Company Decrease defects Defects do not leave the Process Zero Defects Operations Errors Defects Inspection STD´s FOCUS Many Defects Many Complaints Eliminate Complaints Inspection ACTION Rework Replacement TOOLS Inspection STD´s Non defective Products Don't Make Defects, Focus on Improvement Don't Pass Defects to the Next Process Prevent Errors From Becoming Defects Strengthen Inspection Strengthen Improvement Strengthen Autonomous Control Strengthen Autonomation (Jidhoka) Standards and SDCA Structured Problem Solving Auto Quality Matrix II 6 Sigma Projects Very high cost of external failure Errors Improvement Non defective Products Defects Processes Non defective Products Errors Improvement Defects Processes Defects Operations Improvement COMPANY LEVEL 0 Reduced external failures Reduce cost on internal failure Design For 6 Sigma Invest in appraisal Invest in prevention Cost Of Quality is reduced !

Value Analysis and Value Engineering

What is ‘Value’? Value is a function of ‘Desired Performance’ and ‘Cost’ Value = Desired Performance (P) Overall Costs (C) Desired performance is expressed by the term worth which is defined as the lowest cost to achieve the Use (work) function and Aesthetic (sell) function

An Introduction to Value Analysis and Value Engineering • In 1961, Lawrence D Miles in his book ‘Techniques of Value Analysis Engineering’ defined Value Analysis • VA is a step by step approach to identify the functions of a product, process, system or service; to establish a monetary value for that function and then provide the desired function at an overall minimum cost without affecting any of the existing parameters like Quality, Maintainability, Productivity, Safety and other Performance Characteristics • In the year 1954 , US Navy Bureau of ships adopted same technique in their effort ‘cost avoidance’ during the design stage and saved millions of dollars and named it as Value Engineering • Value Engineering is where the value of all the components used in the construction of a product from design to final delivery stage are completely analyzed and pursued

Concept of Value is of two types Use Value Esteem Value • The Product Quality is fundamentally defined as ‘fitness for use’ • Use value is the basic or primary value of the product • Use value is the usefulness of the product or the service in fulfillment of a stated, implied or the latent need at the least cost for the required expectation of the performance standard or the quality level • The enhanced value associated with a brand or a product created by the marketers • Esteem value is a notional value for which the consumer is ready to pay higher • EV is the secondary value associated with the product • EV of a product or service is more related to the consumer’s social positioning in the society at a relatively higher echelon

Case on Functions AR Dairies is a Mumbai based milk and dairy product company. They used to supply milk (cow and buffalo) in 500 ml glass bottles. Later, they introduced flavoured Milk in 200 ml bottles , which become instant success. While flavoured milk is supplied throughout the day, other type of milk (cow and buffalo) is supplied only in the morning While going through the Audit report, the general manager found that there is a transit loss of 3% due to breakage of bottles. To overcome that the general manager introduced polyethylene bags in place of 500 ml bottles. However, flavoured milk is sold in glass/plastic bottles. Why did the general manager not introduce polyethylene bags for masala milk?

Answer to Case Primary Function of bottle is to hold the liquid and Secondary Function is to facilitate drinking In the case the shape of the bottle facilitates drinking , however when primary function is achieved by polyethylene bag then secondary function ceases to exist As a consumer drinks , Flavoured Milk on the spot, secondary function of facilitation of drinking is very important whereas cow/buffalo milk is never drunk without heating it Therefore the general manager could sacrifice secondary function in case of milk but not in case of Flavoured Milk not introduce polyethylene bags for masala milk?

Higher order (Primary) and Lower Order (Secondary) Functions The basic function of a Torch is ‘To give light’

Higher order (Primary) and Lower Order (Secondary) Functions Give Light HOW? WHY? Facilitate Viewing Supply Current HOW? Light the Bulb Insert Battery

Higher order (Primary) and Lower Order (Secondary) Functions When we ask question ‘Why’ to the basic function; the answer we get is called as ‘Higher Order Function’ and when we put question ‘How’ to the Higher Order Function we get Lower Order Function’ Thus, ‘Facilitate Viewing’ is Higher Order Function and the Light Bulb is a lower order function

What is the meaning of overall costs? Overall costs means different to different people Producer Consumer Overall cost is the summation of all the elements of the cost required to produce a product or service such as labour, material, overhead, etc. Overall cost is the monetary sum (price)for which the product or services are purchased in the market

Four Methods for increasing the value of a function… Method 1: Decrease the cost while ensuring the same level of performance V= P C Smart mobile phones were sold at ~20, 000 Rs and above a while ago, but India/China based companies flooded the market with smart phones available at prices between 5000 Rs to 20, 000 Rs

Four Methods for increasing the value of a function… Method 2: Enhance the performance at same cost V= P C A Mumbai local newspaper introduced a special supplement on metro thrice a week without changing the price

Four Methods for increasing the value of a function… Method 3: Decrease the cost and enhance the performance V= P C 5 th Generation Intel Core processor is cheaper and has more processing power than earlier chips

Four Methods for increasing the value of a function… Method 4: Increase both performance and cost ensuring that performance increases more than increment in the cost V= P C All soft drink companies have increased quantity of drink from 500 ml to 600 ml (20% more) but increased price just by 10%

Phases of Value Engineering… Value Analysis or Value Engineering is normally carried out in eight successive phases … Sr. No Phase Description/Comments 1 Orientation To create awareness and learn methodology of tool Training sessions for all supervisory and managerial staff on VA and VE Exposures to techniques like ABC, Pareto etc. for selection of project Formation of team consisting of experts from various functions 2 Information To collect all the information pertaining to the project(product) Work can be divided among team members 3 Function Start from basic function and probe further with WHY? And How? List down all the functions for all the parts 4 Creation To develop alternate means to achieve these functions Brainstorming sessions to generate ideas

Phases of Value Engineering… Value Analysis or Value Engineering is normally carried out in eight successive phases … Sr. No Phase Description/Comments 5 Evaluation To do cost benefit analysis and arrive at optimum choice Check whether the alternative suggested performs 6 Recommend ation To submit the details about the proposed changes with financial implications Report includes proposed changes, reasons of changing, new investments and annual savings 7 Implementati To execute proposed/accepted changes on List down all the activities and fix up the time frame for each Make the entire team responsible for all the actions 8 Audit/Follow up To compare the actual results with that of expected Can be done only after complete execution of the project Responsibility of top management alone

Darsiri Method • Darsiri Method of value engineering is a systematic approach to improve the value of the products and components by reconsideration of cost and quality • The quality of the product is reconsidered and reviewed , based on its functions, esteem value and cost • Read page no. 226 –Operations Management and Productivity Techniques by PN Mukherjee and T. T. Kachwala
 Radiusplural
 Non-movement area
 Locomotor dance movements
 V/2πr
V/2πr Circle j is congruent to circle p
 Closed circle math
 Circle a is tangent to circle b. true false
 Zionist movement definition ap world history
 Srivijaya empire ap world history
 Populism in a sentence
 Karve committee on cooperative principles
 Ap world history chapter 17 multiple choice questions
 Patient safety and quality care movement
 Quality circle structure
 Quality control circle
 Quality circle diagram
 Structure of quality circle
 Quality circle steps
 History also history physical
 Tqm inventor
 11-3 areas of circles and sectors answer key
 Literature circles ppt
 Fourth circle of hell punishment
 Modiano's centripetal circles of international english
 9 circles of hell meaning
 External tangents of two circles
 Circles jeopardy
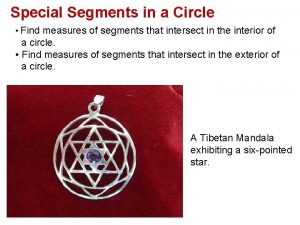
 Special segments in a circle
 Anya is drawing a circle graph
 Segment lengths in circles formulas
 Circle vocab geometry
 10-6 secants tangents and angles
 Define radical axis
 Pythagoras in circles nat 5
 Quiz 10-3 angles arcs and segment lengths
 Lesson 3 area of composite figures page 637 answer key

