Pro Forma Financial Statements Dr Nancy Mangold California


- Slides: 50
Pro Forma Financial Statements Dr. Nancy Mangold California State University, East Bay
Preparing Pro Forma Financial Statements – Step 1 § Project Operating Revenue l l Sales revenue Other revenue
Preparing Pro Forma Financial Statements – Step 2 § Projecting Operating Expenses l l l Cost of Goods Sold Selling and Administrative Expenses Net Income Before Interest and Taxes
Preparing Pro Forma Financial Statements – Step 3 § Project Assets l l l l Cash Accounts Receivable Inventories Other Current Assets Investments Fixed Assets Other Assets
Preparing Pro Forma Financial Statements – Step 4 § Project Liabilities and Contributed Capital l l l Accounts Payable Notes Payable Other Current Liabilities Long-Term Debt Other Liabilities Contributed Capital
Preparing Pro Forma Financial Statements – Step 5 § Project Retained Earnings l Retained Earnings
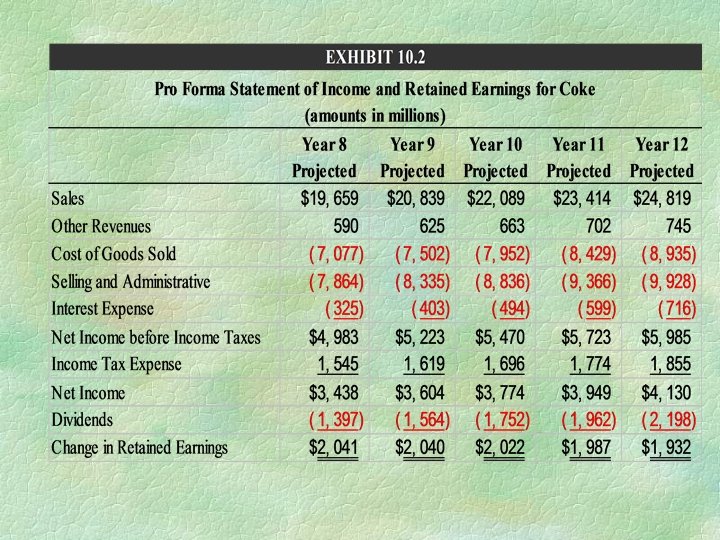
Preparing Pro Forma Financial Statements – Step 5 § Project Cost of Financing, Income Tax Expense and the Change in Retained Earnings l l l Interest Expense Income Tax Expense Net Income Dividends Change in Retained Earnings
Preparing Pro Forma Financial Statements – Step 6 § Project the Statement of Cash Flows l l l Investing Acquisition of Fixed Assets Sale of investments Acquisition of Investments Other Investing Transactions Cash Flow from Investing
Project Sales and Other Revenues § Price: Consider l l l general price inflation specific industry factor affecting demand excess capacity shortages of raw materials prices of substitute products § Volume: Consider l growth rate in the general population
Project Sales and Other Revenues § Use historical growth rate l l adjust for major acquisition or sale cyclical sales pattern • use varying growth rate l International sales – Consider – international competition – value of dollars
Projecting Other Revenues § Use historical percentage of sales
Project Operating Expenses § Projection depends on the behavior of the cost items § Variable cost l use common size income statement percentages multiplied by projected sales § High fixed costs l l estimate the VC and FC of the firm use historical growth rates for individual items
Project Operating Expenses § Cost of Goods Sold l l VC use projected cost of goods sold percentage of sales § Selling and Administrative Expenses l use projected S & A percentage of sales
Project the Assets on the Balance Sheet § Project total Assets l use common size balance sheet percentages to allocate the total assets among individual asset items § Project Individual assets l sum up individual asset amounts to obtain total assets
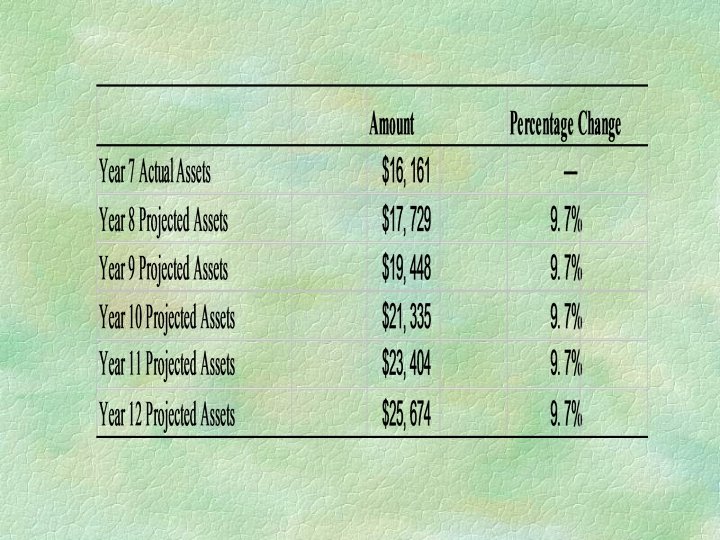
Project the Assets on the Balance Sheet § Projected Total Assets Approach § Use historical growth rate in assets l compound annual growth rate over five years
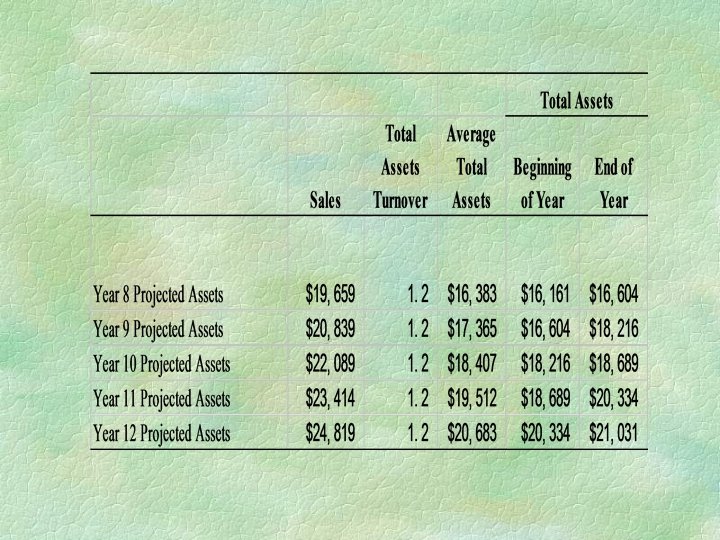
Project the Assets on the Balance Sheet § Alternative Approach § Use Total Assets Turnover Ratio Projected Sales = Ave. total assets Projected Total Assets Turnover § 2 x Ave. Total Assets - Beg. Assets = ending assets
Project Assets on Balance Sheet § May create sawtooth problem
Illustration of Difficulty Sometimes Encountered When Projecting Total Assets Using Assets Turnover Sales Dollars Assets 1 3 2 Year 4
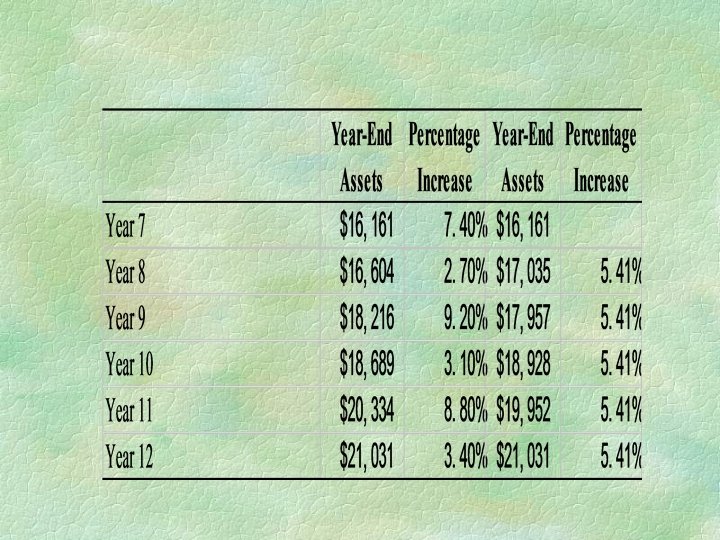
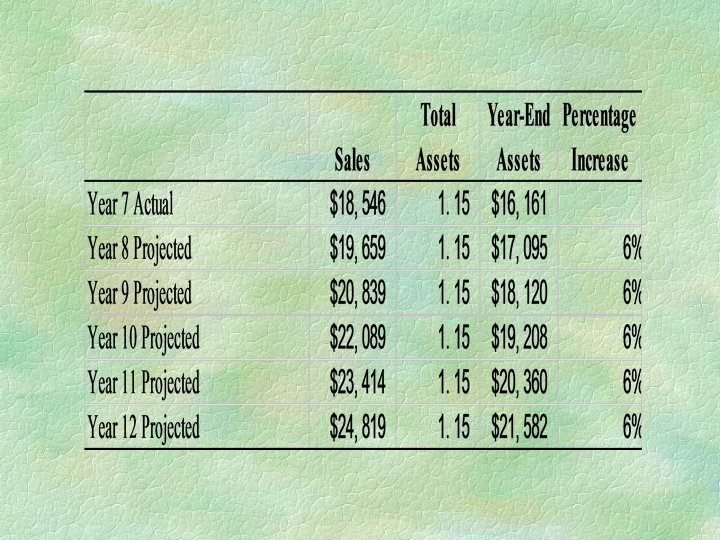
Project Assets on Balance Sheet § use compound annual rate to smooth the rate of increase in assets (Projected Ending Assets(yr 5)/ Beg. Assets (yr 0)) ^(1/5) § ($21, 030/$16, 161)^(1/5)
Project Assets on Balance Sheet § Another Alternative § Based the asset turnover on the ending balance instead of the average balance l l Sales/ending total assets = projected total asset turnover Projected sales/ projected total asset turnover = Year-end assets
Project Assets on Balance Sheet § Use common size balance sheet percentages to allocate the total assets to individual assets
Projected Individual Asset Approach § Use historical growth rate for individual assets l l Assets linked to operations tie to growth in sales Accounts receivable Inventories Fixed assets § Use asset turnovers
Projected Individual Asset Approach § Cash & Marketable Securities l l plug in figure Change in cash on the balance sheet must agree to change in cash on the projected statement of cash flows If cash is too high, assume the firm will invest the excess in marketable securities or pay down borrowings If negative, the firm uses short-term borrowings to bring about a desired level of cash
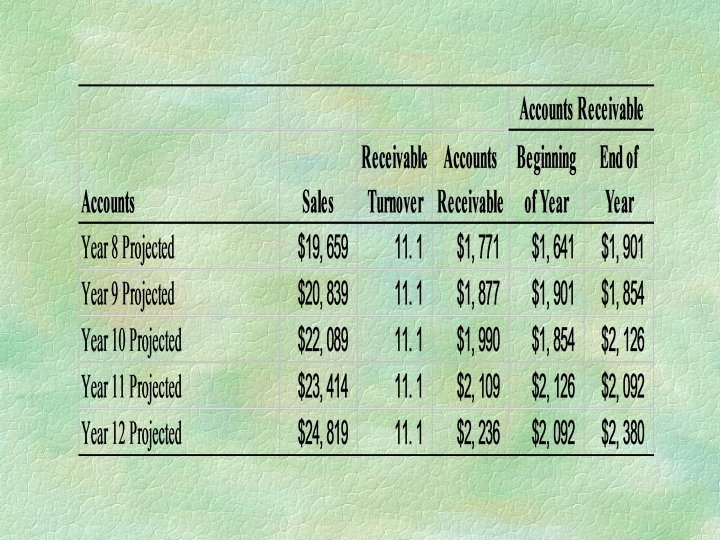
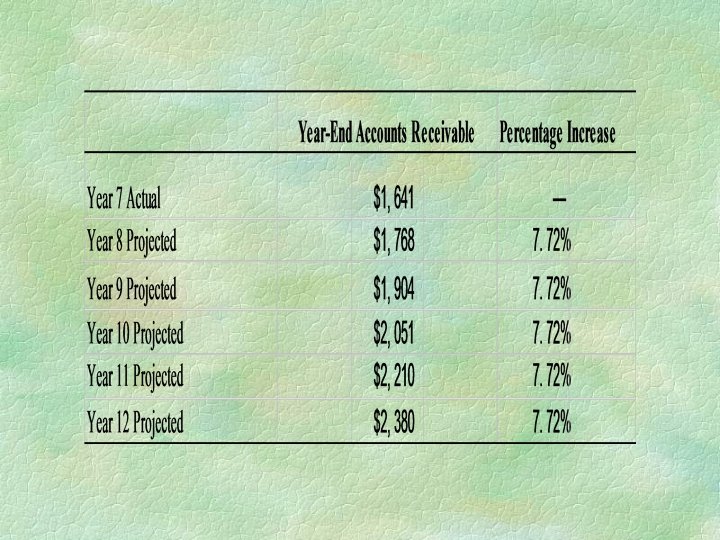
Projected Individual Asset Approach § Accounts Receivable l l Use receivables turnover Sales/Receivables turnover = Ave. accounts receivable 2*Ave. AR - beg. AR = ending AR smooth the Sawtooth problem using compound growth rate (Ending AR/Beg. AR) ** 1/5
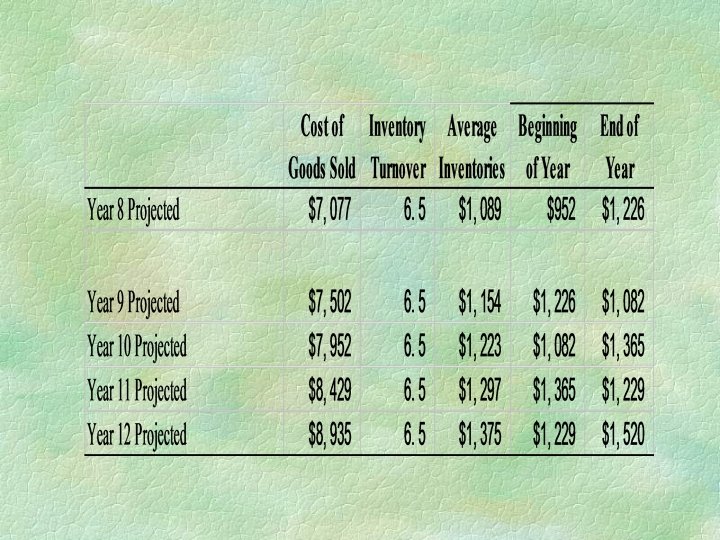
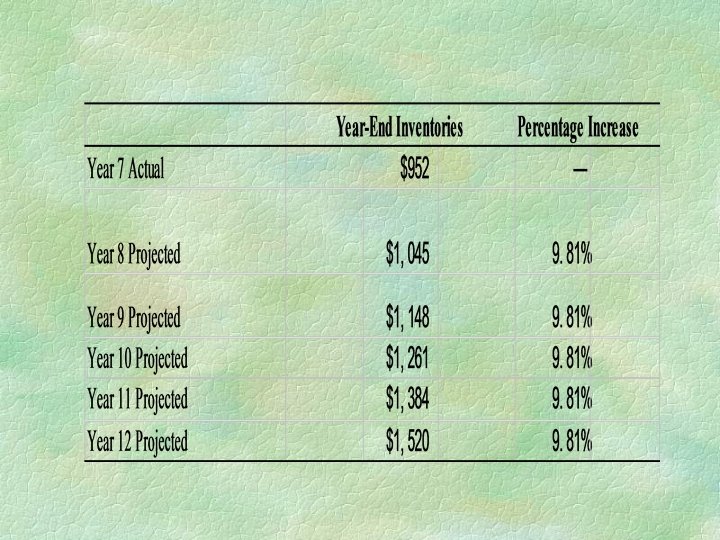
Projected Individual Asset Approach § Inventories l l l use inventory turnover Sales/Inventory turnover = Ave. inventories 2*Ave. Inv - Beg. Inv. = Ending Inv Smooth the sawtooth problem using compound growth (Ending Inv/Beg. Inv) ** 1/5
Projected Individual Asset Approach § Other Current Assets l use growth rate in sales § Investments in Securities l use compound annual growth rate § Property, Plant and Equipment l use fixed assets turnover (follow AR, Inv) § Other Assets l use growth in sales
Projected Individual Asset Approach § If common size Financial Statement indicate § Cash and Marketable Securities l 10% of Assets § (AR+Inv+Other current assets+PPE+other assets)/90% = Total assets § Total assets * percentage cash = cash § Total assets * percentage marketable securities = marketable securities
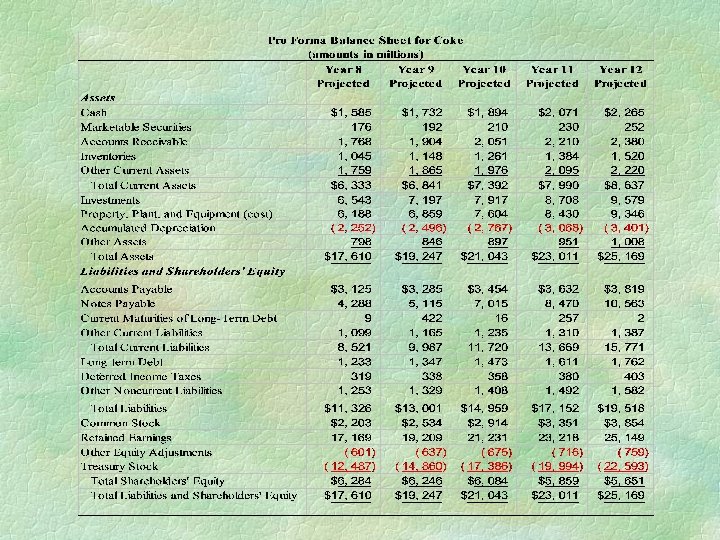
Project Liabilities and Shareholders’ Equity § Projected total asset approach § Use common size balance sheet percentages to project l l Individual liabilities Shareholders’ equity § Project individual liabilities and shareholders’ equity accounts l l use historical growth rates use turnover ratios
Project Liabilities and Shareholders’ Equity § § § Accounts Payable use AP turnover COGS + End Inv - Beg Inv = Purchases/ AP turnover = Ave AP * 2 - Beg AP = Ending AP balance Use compound annual AP growth rate to smooth AP § (Proj end AP/ beg AP ) **1/5
Project Liabilities and Shareholders’ Equity § Notes Payable l plug (projected assets - projected liab and equity) § Current Maturities of LT Debt l use disclosed amount § Other Current Liabilities l use growth rate in sales
Project Liabilities and Shareholders’ Equity § Long Term Debt l use percentage of LT debt to total assets § Deferred Income Taxes l l relate to operating items (employee benefits, PPE, equity investment, intangible assets) use growth rate in sales § Other Noncurrent liabilities l use growth rate in sales
Project Liabilities and Shareholders’ Equity § Contributed Capital- Year-end Common Stock l use compound annual growth rate § Other Equity Adjustments l l l Foreign currency translation adjustment Unrealized gains on securities for sale use growth rate in sales § Treasury stock l use projected compound growth rate
Project the Cost of Financing § Interest Expense § Short term borrowing l Ave notes Payable * proj. interest rate § Long term borrowing l Ave long term debt * proj. Interest rate
Project Income Tax Expense § Income Taxes l use effective tax rate
Project Retained Earnings § Dividends l use compound annual dividend growth rate § Change in Retained Earnings l Beginning R/E + Net income - Dividends = Ending Retained Earnings
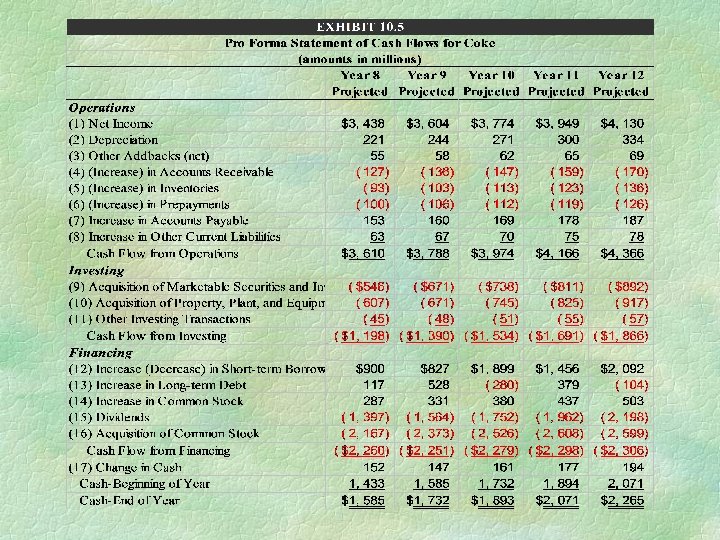
Project the Statement of Cash Flows § Net income l Pro forma income statement § Depreciation l Change in accumulated depreciation § Other addbacks l l increase in deferred income taxes other noncurrent liabilities
Project the Statement of Cash Flows § Changes in operating current asset and current liability - pro forma balance sheet § Acquisition of PPE l Change in PPE from pro forma B/S § Other Investing Transactions l change in other assets § Increases in borrowing l increase in Notes Payable and LT Debt
Project the Statement of Cash Flows § Changes in Common Stock l Changes in common stock, paid-in capital, and treasury stock § Dividends l Projected amount each year § Change in Cash l Net to the change in cash on the comparative balance sheet
Analyzing Pro Forma Financial Statements § Serves as a base case that an analyst can use to asses the impact of various changes for a company § Changes in various assumptions will have different effects § Use spreadsheet to observe the effect on the financial statement ratios