Power of the Population Pyramids What is a


 WHY LOWER")


")


- Slides: 25
Power of the Population Pyramids !!!!
What is a population pyramid? • We use population pyramids to analyze growth (or decline) of fertility, mortality, and migration. • Also shows: - proportion of Kiddos-young people (0 -14 ) - proportion of Economically active- working people (15 – 59) - proportion of the Oldies- elderly people (60+) -These can be shown as a percentage or a number.
What is a population pyramid? Vertical Axis - Age Groups Elderly dependents Working population Young dependents Horizontal Axis – Percentage / number
Sex Ratio The division between the sexes can also be analysed by calculating the male : female ratio or sex ratio This expresses the number of men in the population as a proportion of the number of women.
Dependency Ratio • The ratio of non-economically active to economically active people in the population is called the dependency ratio.
Zero Population Growth • The population pyramid can also show zero-growth. • This means that birth rates and death rates cancel each other out. • In this case, the age-sex pyramid is more like a column than a pyramid, and people are distributed evenly throughout the cohorts
Horizontal Axis The horizontal axis may either represent actual numbers OR the percentage of the total population in each age category.
Vertical Axis • The population is normally divided into five year groups e. g. 0 -4, 5 -9, 10 -14 on the vertical axis. • However, sometimes you will see one and ten year intervals too. • The final years are collapsed into one category (e. g. 90+) • Different age groups are known as cohorts
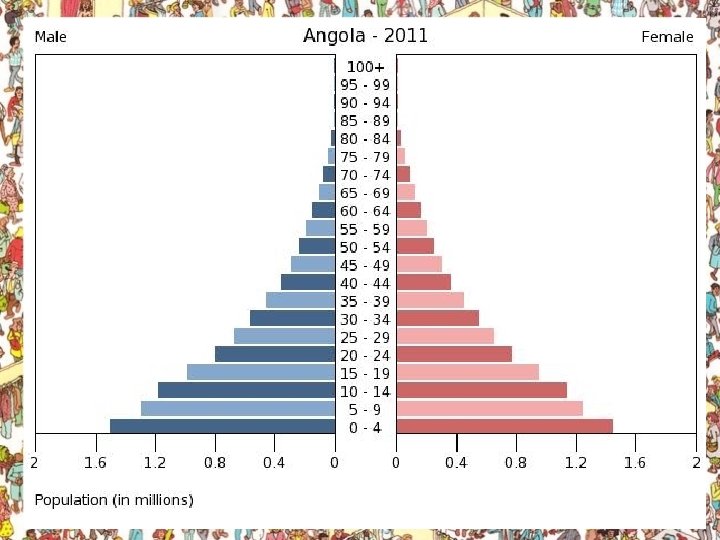
Population Pyramids Developing Countries • Wide base which indicates a youthful population (as a result of high birth rates); • Narrow top (there are fewer people in the older age groups because life expectancy is lower);
Implications for governments in developing countries • Limited resources will be stretched to meet the needs of a large number of dependent children for schooling, nutrition and health care; • As this group reaches working age, a large number of jobs will need to be created to enable them to support themselves and their families. • As this group reaches child-bearing age, it is likely that fertility rates will be high, leading to continued high rates of natural population increase.
Population Pyramids Developed Countries • Narrower base (due to lower birth rate) WHY LOWER BIRTH RATES? • Wider top (reflecting a longer life expectancy) WHY A LONGER LIFE EXPECTANCY? • In some developed countries there is a bulge in 40 -45 age cohort as a result of the “baby boomers” of the 1960 s
Developing/Developed
Developed and Developing Countries
Triangular-shaped Pyramid (Broad-based Pyramid)
Broad-based Pyramid Title: India, 2000 Shape: Broad Base - high birth rates Narrow Top - small elderly pop - high death rate Proportion: - Large proportion of young - high young dependency ratio Sex Ratio: Balance pyramid - Balanced sex ratio
Expansive population pyramids show larger numbers or percentages of the population in the younger age groups, usually with each age group larger in size or proportion than the one born before it. Population growth is rapid.
Constrictive population pyramids display lower numbers or percentages of younger people. Population growth is negative.
Stationary or near-stationary population pyramids display somewhat equal numbers or percentages for almost all age groups. Of course, smaller figures are still to be expected at the oldest age groups. Population growth is neutral or stable.
How to Read a Population Pyramid Width of the Base birth rate varies with the width of the base. A wide base indicates a high birth rate and a narrow base indicates a low birth rate.
How to Read a Population Pyramid • Symmetry – statistically speaking pyramids should be relatively symmetrical – any asymmetry indicates a difference in the male and female population – this pyramid shows more females at age ranges above 50 which indicates that women are living to older ages than males
How to Read a Population Pyramid • Shape of Sides – Concave sides indicate a high death rate and convex sides indicate a low death rate – this population pyramid exhibits concave sides indicating a high death rate
How to Read a Population Pyramid • Bumps in the sides – irregularities in the sides indicate a demographic anomaly – the 30 -50 age group in the population pyramid at the right represents the baby boom – this bump will travel upward as the baby boomers age • Bumps in the sides – irregularities in the sides indicate a demographic anomaly – the large numbers of working aged men in the pyramid to the left indicates a migrant workforce
Population Pyramids in Transition
Past, Present and Future Trends • As well as illustrating the effect of past changes, population pyramids can also indicate both short and long term future changes in population. • We can use population pyramids to show the results of migration