Tools for Demographers Population Pyramids What are Population
- Slides: 23
Tools for Demographers: Population Pyramids
What are Population Pyramids? Definition: It is a graph that shows population distribution by age (from 0 – 100 years) and by gender (female and male). • Also known as an Age- sex pyramid • It is an easy way to show the characteristics of a population • The data is graphed (visual representation) • Facts are based on data collected from a census.
Age Distribution l How many people in Canada are in different age groups? l Demographers have identified three categories when looking at population pyramids: l l l Children (ages 0 – 15 years) Working Adults (16 – 64 years) Seniors (64 years and over)
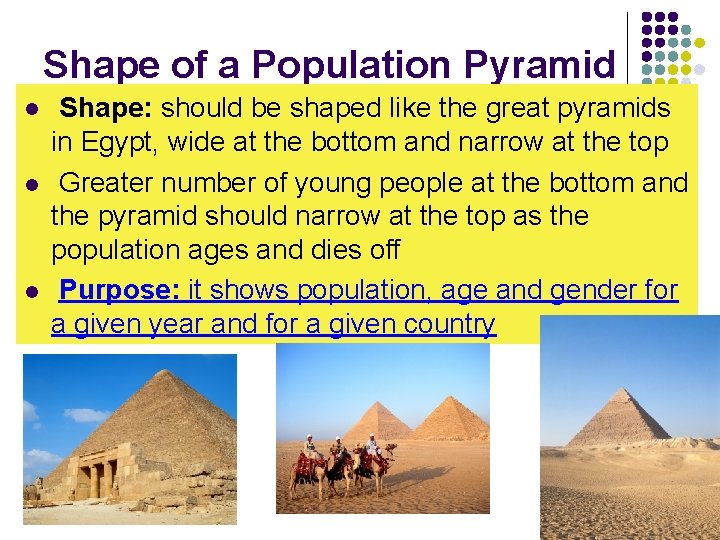
Shape of a Population Pyramid l l l Shape: should be shaped like the great pyramids in Egypt, wide at the bottom and narrow at the top Greater number of young people at the bottom and the pyramid should narrow at the top as the population ages and dies off Purpose: it shows population, age and gender for a given year and for a given country
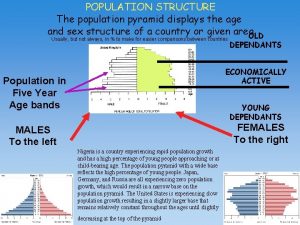
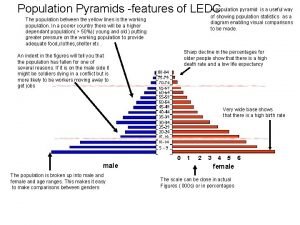
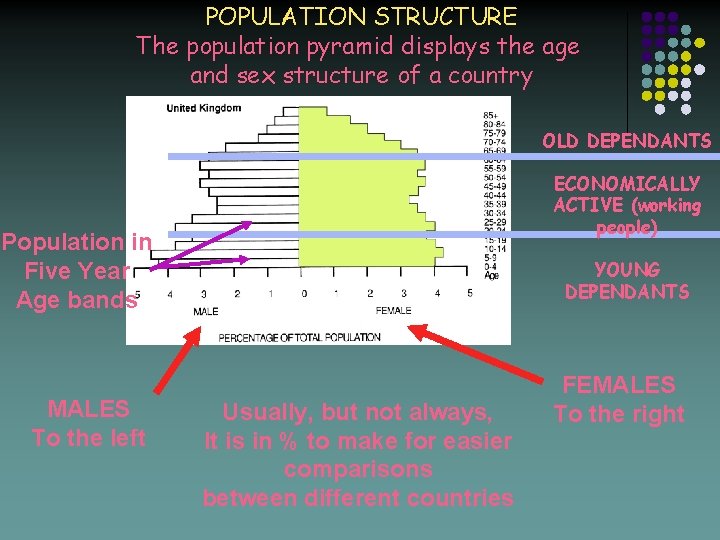
POPULATION STRUCTURE The population pyramid displays the age and sex structure of a country OLD DEPENDANTS ECONOMICALLY ACTIVE (working people) Population in Five Year Age bands MALES To the left YOUNG DEPENDANTS Usually, but not always, It is in % to make for easier comparisons between different countries FEMALES To the right
Dependency Load l Definition: refers to the group of people in Canada who are l l l NOT in the workforce Working age (15 – 65 years) support those under the age of 14 and those above the age of 65 These people within Canada are dependent on those who work They are located at the bottom and top of the population pyramids A young population such as in 1951 meant that Canada needed more schools, houses, health care and recreational programs. Now the population is aging and we need more retirement homes, nurses, health care facilities, medicine and care givers.
What do Population Pyramids show us? They allow us to analyze: Population Percentages and life expectancies of males and females The percentage of the population under the age of 15 and over the age of 65, know as the dependency load – Why are these people deemed dependent? The number of childbearing women in the population (15 to 49) Population growth history Impact of population policies such as on the fertility rate, immigration rate, etc.
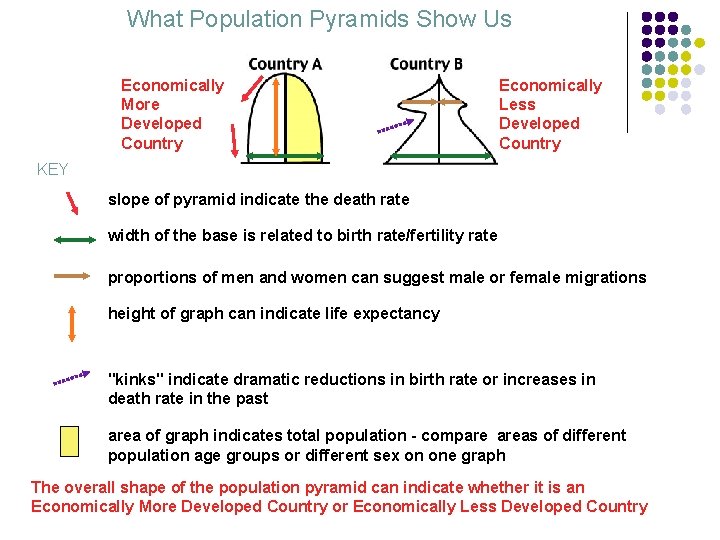
What Population Pyramids Show Us Economically More Developed Country Economically Less Developed Country KEY slope of pyramid indicate the death rate width of the base is related to birth rate/fertility rate proportions of men and women can suggest male or female migrations height of graph can indicate life expectancy "kinks" indicate dramatic reductions in birth rate or increases in death rate in the past area of graph indicates total population - compare areas of different population age groups or different sex on one graph The overall shape of the population pyramid can indicate whether it is an Economically More Developed Country or Economically Less Developed Country
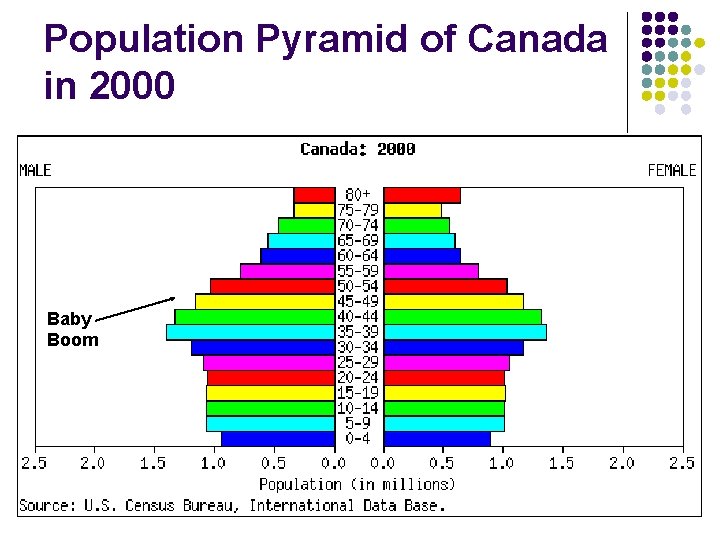
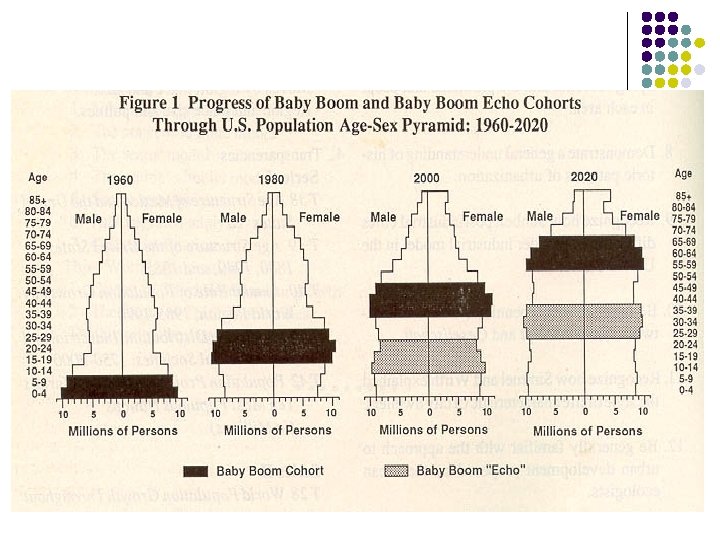
Baby Boomers l l People who were born after WWII (between 1945 – 1965) when men came home to their wives and started families They are now into their late 60 s and late 40 s This was the largest population of babies to exist all at one time and still is to this day Hilarious Baby boomers clip http: //www. youtube. com/watch? v=_N_Sq. Lljun Q&feature=related
Population Pyramid of Canada in 2000 Baby Boom
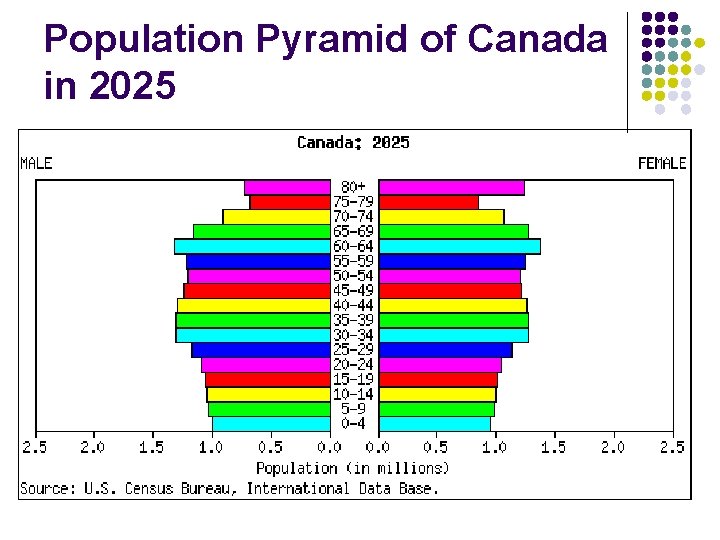
Population Pyramid of Canada in 2025
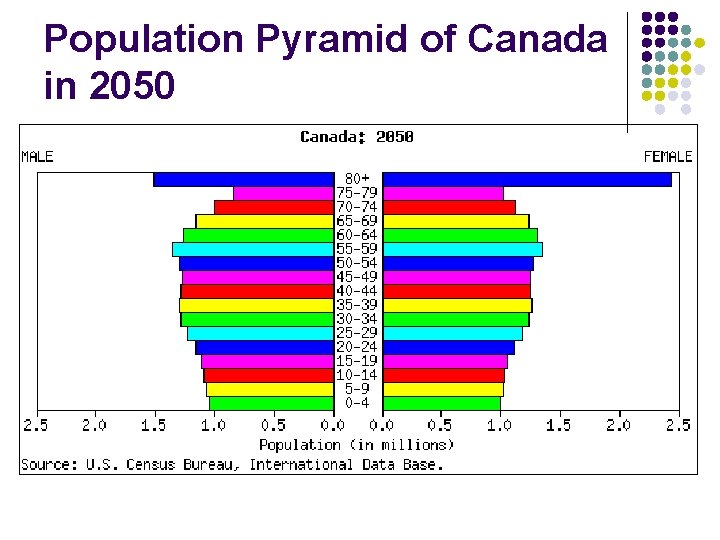
Population Pyramid of Canada in 2050
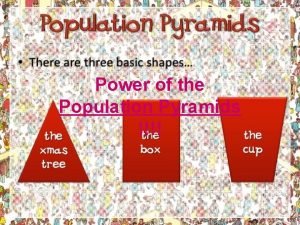
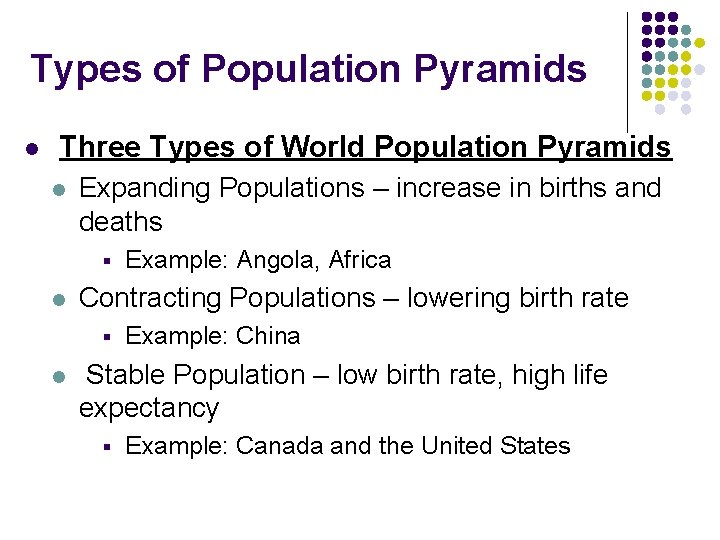
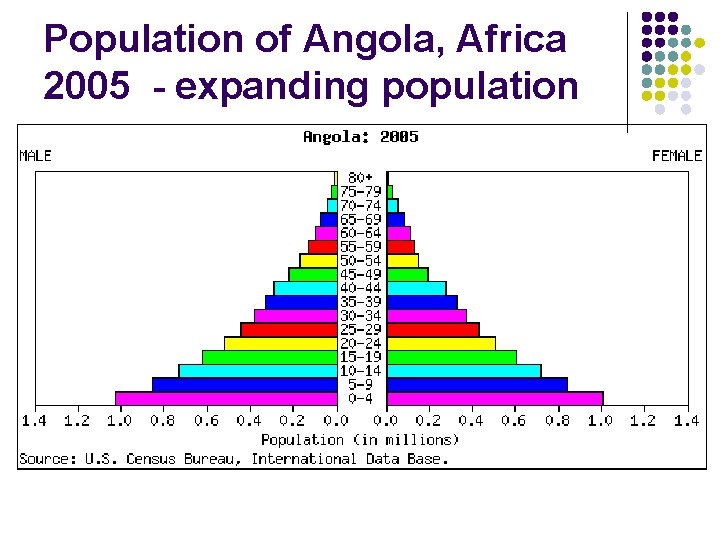
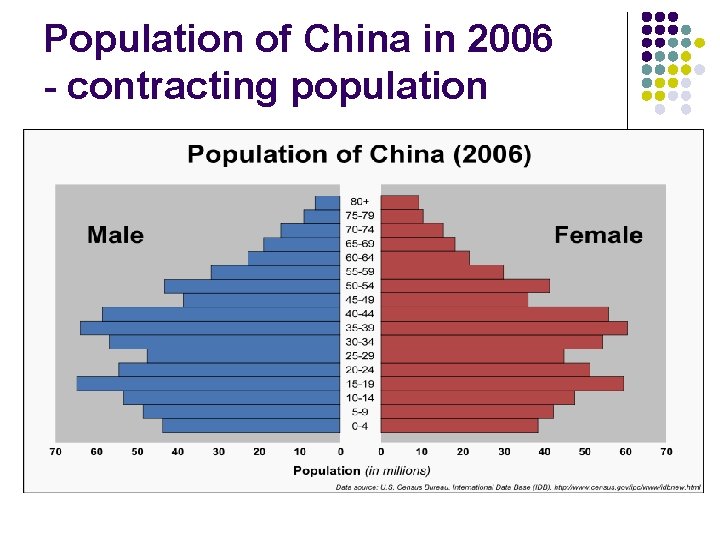
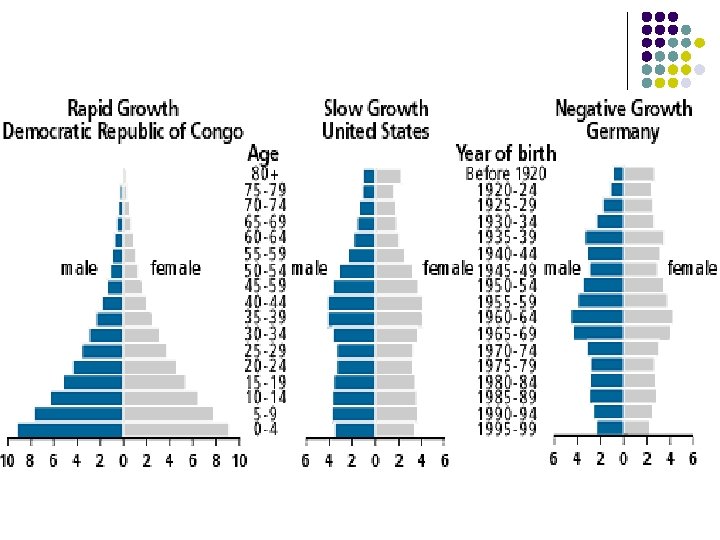
Types of Population Pyramids l Three Types of World Population Pyramids l Expanding Populations – increase in births and deaths § l Contracting Populations – lowering birth rate § l Example: Angola, Africa Example: China Stable Population – low birth rate, high life expectancy § Example: Canada and the United States
Population of Angola, Africa 2005 - expanding population
Population of China in 2006 - contracting population
Conclusion: l l l What will Canada’s population look like in the future? How old will you be in 2025? 2050? Which age group will you be in? How will Canada be affected by our current aging population? How will Canada be impacted by our growing and increasing population?
Creating a Population Pyramid On your own, you will now create a population pyramid for Canada using the statistics given to you from Stats Canada. l You will need to look at the stats carefully for each set of years and the gender. l Carefully, outline the pyramid for males in Canada and then for females in Canada When the outline is done, you may colour the bars to your pyramid Boys = blue Females = red l
Population Pyramids worksheet 1. Read the handout as a class. l 2. Then compete the following questions on the following generations: Generations: Baby boomers, Generation X, Echo Boomers and the youths of today are now Generation Y l
What does it all mean? l l l Complete the chart by THINKING about the effects of population. No textbook needed. Just you and your brain. How will it impact you? What do you think is going to happen? This is a continuation from the what we discussed on population problems and the pros and cons to a growing population in Canada.
Demographic Transition Model l Complete the demographic transition model by filling in the chart on your handout and then drawing the diagram into your notes and labeling it.
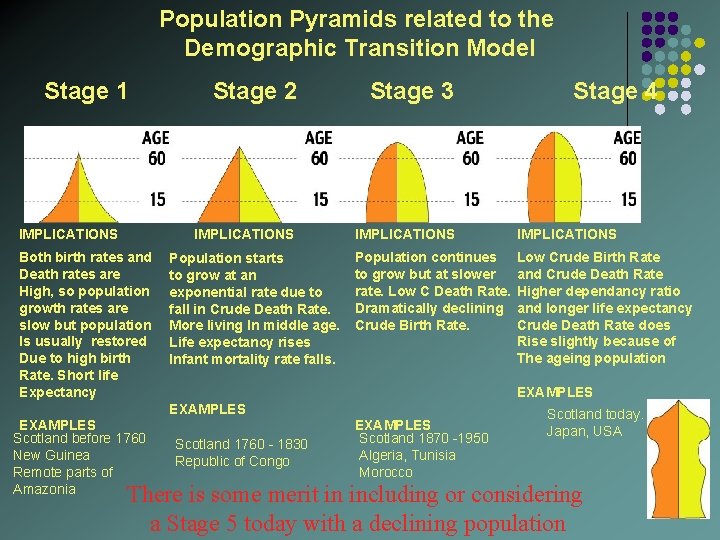
Population Pyramids related to the Demographic Transition Model Stage 1 IMPLICATIONS Both birth rates and Death rates are High, so population growth rates are slow but population Is usually restored Due to high birth Rate. Short life Expectancy Stage 2 Stage 3 IMPLICATIONS Population continues to grow but at slower rate. Low C Death Rate. Dramatically declining Crude Birth Rate. Low Crude Birth Rate and Crude Death Rate Higher dependancy ratio and longer life expectancy Crude Death Rate does Rise slightly because of The ageing population Population starts to grow at an exponential rate due to fall in Crude Death Rate. More living In middle age. Life expectancy rises Infant mortality rate falls. EXAMPLES Scotland before 1760 New Guinea Remote parts of Amazonia Stage 4 Scotland 1760 - 1830 Republic of Congo EXAMPLES Scotland 1870 -1950 Algeria, Tunisia Morocco Scotland today. Japan, USA There is some merit in including or considering a Stage 5 today with a declining population