Population and Environment I Demographic and population pyramid


 Fertility 2) Mortality 3) Marriage 4) Migration")
 1 st stage: High stationary 2) 2 nd")


- Slides: 29
Population and Environment – I Demographic and population pyramid Dr Madhavi Bhargava
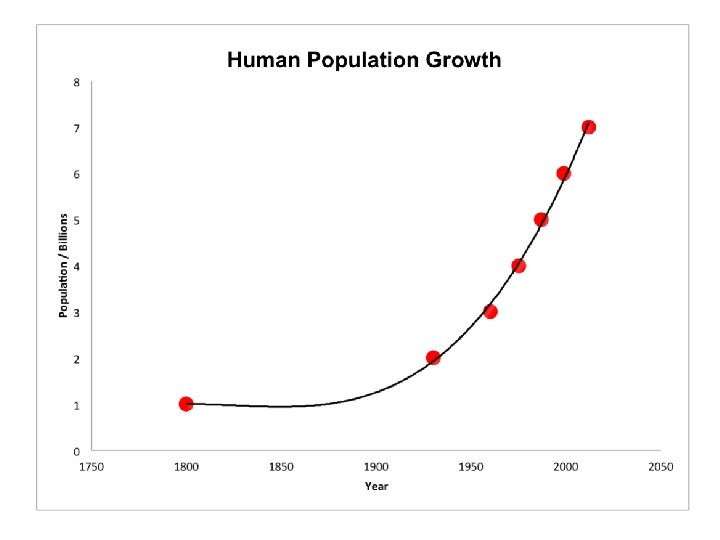
Maximum carrying capacity
Environmental components for carrying capacity a. Productive systems: farmland, orchards, etc that provide food b. Protective systems: climate, forest, oceans c. Waste assimilative system: rivers, wetlands that assimilate the human waste First two are: life-supportive capacity Last is: waste-assimilative capacity
Population doubling time and population pressure • Time required for a population to double itself • The population pressure is due to: 1. Dramatic increase in population 2. High densities in different parts of the world This gives rise to disparity in resource availability 15% of the population controls resources of 85% of world’s population
• It takes 15 -20 times as much resources to raise a child in US as compared to developing nations
• Differential growth rates in different countries • Impact of growth depends not just on rate of growth • Also depends on size and age structure of the population THE DEMOGRAPHY
Demography • Scientific study of human population • ‘Demos’ means people • Includes three important human phenomena: 1) Changes in population size 2) Composition of population 3) Distribution of population in space
Demographic processes Five important demographic processes: 1) Fertility 2) Mortality 3) Marriage 4) Migration 5) Social mobility These determine size, composition and distribution
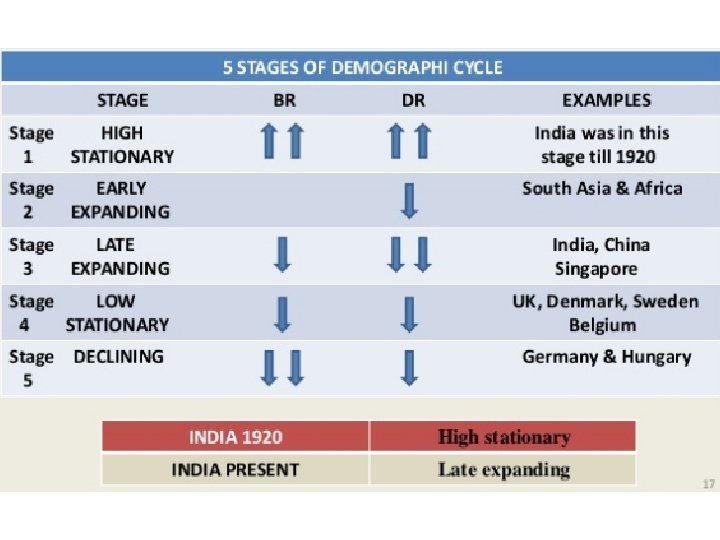
Demographic cycle Mainly 5 stages: 1) 1 st stage: High stationary 2) 2 nd stage: Early expanding 3) 3 rd stage: Late expanding 4) 4 th stage: Low stationary 5) 5 th stage: Declining
First stage: High stationary • High birth rate • High death rate • These cancel each other and population remains stationary • India was in this stage till 1920
Second stage: Early expanding • • • Death rate declines Birth rate remains unchanged Better health and living conditions Shortened breast feeding duration Eg: Africa
Third stage: Late expanding • • • Death rate further declines Birth rate falls to some extent But birth rate > death rate India is in this phase Similarly China
Fourth stage: Low stationary • Low birth rate • Low death rate • Good health services and better standard of living • Results in ZERO population growth • Eg: UK, Denmark, Sweden • Mostly the developed and industrialized countries
Fifth stage: Declining • Birth rate is lower than the death rate • Example: Germany, Hungary Reasons for decline in fertility: 1)Education 2)Availability of contraception 3)Change in marriage and child birth patter 4)Growth and development 5)Governmental initiatives
Birth rate and Death rate Growth rate: Crude birth rate – Crude death rate
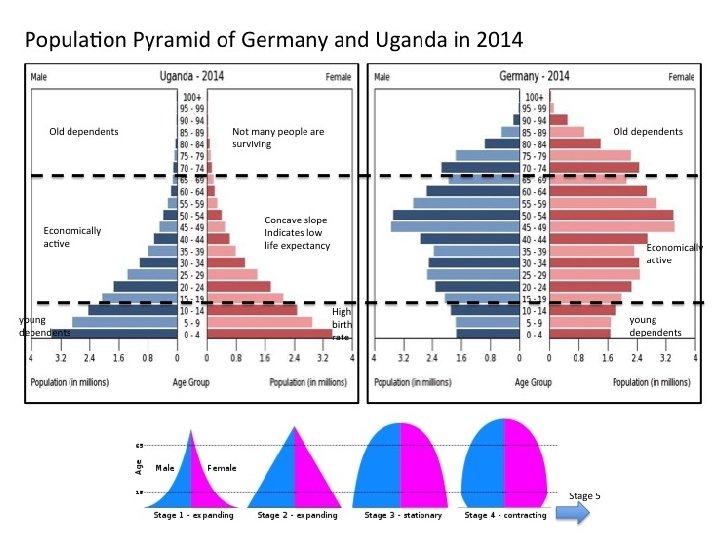
Population pyramid • Also known as age pyramid • Pictorial presentation of proportion of males and females in each age group • Age groups divided in groups of 5 -year interval • Youngest at the bottom • Oldest on the top Dependents • 15 to 65 years: the working population
What is a population pyramid Vertical Axis - Age Groups Elderly dependents Working population Young dependents Horizontal Axis – Percentage / number
Types of population pyramid • Triangular shape • Beehive shaped • Rectangular shaped
Broad-based Pyramid India in 2000 Shape: Broad Base - high birth rates Narrow Top - small elderly pop - high death rate Proportion: - Large proportion of young - high young dependency ratio Sex Ratio: Balance pyramid - Balance sex ratio
Beehive-shaped Pyramid
Beehive-shaped Pyramid Country: Singapore, 2000 Shape: Beehive shaped Proportion: Large proportion of working population, 15 -59 yr old - large group of economically active pop Sex Ratio: Balanced pyramid
Hong Kong 2000 Taiwan 2000
Population Pyramids in Transition
Dependency ration • Children below 15 and persons above 65 are considered dependent • Dependency ratio: Old age and young age dependency ratio can also be calculated seperately
Family size • Common language: Number of members in a family • In demography: Total number of children a woman has borne at a point of time • Completed family size: total children during reproductive age group • Family size depends on many factors
Factors affecting family size • • Age at marriage Duration of marriage Level of education Economic status Prevailing social and cultural practices Desired family size Use of family planning techniques