Population Geography Counting the Worlds Population Population Pyramids


 Ted Talks video:")


: number of live births per")


 n n n Hunter and Gatherer")

 n n n Agricultural/Early Industrial")


 n n Industrial Societies Sharply declining")


 n n Tertiary Societies CBR")
 Some demographers think we should add a 5 th stage")


 The consequence of these two principles is that eventually, population will")
 Population grows geometrically…. Population exceeds carrying capacity… Population is kept in")


 Production, 1961 -2005 © Dr.")


 has")


")


- Slides: 95
Population Geography Counting the World’s Population
Population Pyramids
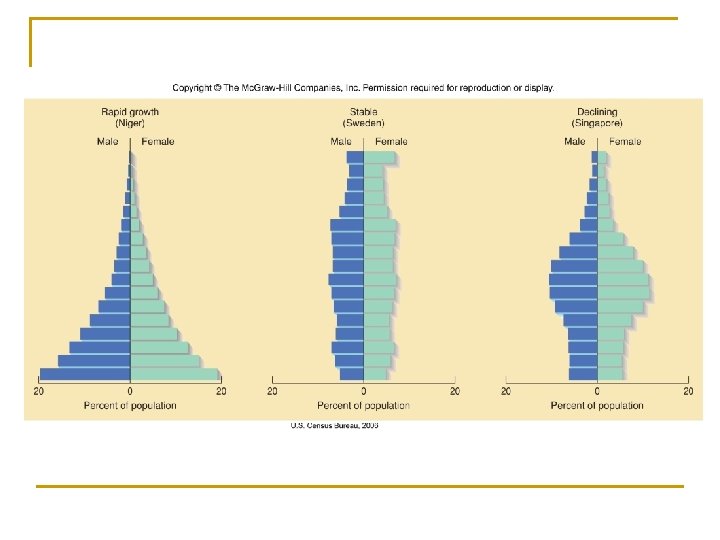
Population Pyramids n n n Also known as age-sex structures used to evaluate the distribution of ages and genders in a given population Shows sex ratio (number of males compared to females in a population) at ANY GIVEN TIME! Cohorts (people of the same age) are split between men and women on the pyramid Used to analyze population and/or predict future population Cannot determine country size from pyramids but can determine placement in DTM
Population Pyramid Algeria’s pyramid has a wide base and a flattened top. What does that mean? Italy’s pyramid is wider in the middle than at the base. What does that mean? What expectations do you have for a population pyramid from 2025?
Expanding Populations Stable Population Contracting Population
2025 Predictions n n n Did Algeria’s growth rate decrease? How can you tell? What happened to Italy’s population? Graying population: When a population has more middleaged and older people than young people. Why is this a problem?
South Africa and the United States
More on population pyramids n n Pyramids Power. Point (Chris Hall) Ted Talks video: Population pyramids: powerful predictors of the future – https: //www. youtube. com/watch? v=RLm. Kf. Xw. WQt. E
Population Math
Adding up population numbers n n Equations exist to allow demographers to determine actual populations Demographic accounting equations q Global population accounting equation n P 1=P 0+B-D q q q Subglobal population accounting equation n P 1=P 0+B-D+I-E q q q n n P 1 is size of population at end of interval of measurement P 0 is size of population at start of interval of measurement B is number of births during interval of measurement D is number of deaths during interval of measurement P 1, P 0, B and D same as above I is number of immigrants moving into region during interval of measurement E is number of emigrants moving out of region during interval of measurement Immigration: people moving into a region/country Emigration: people leaving a region/country
Math Example n n Country A has 1 million people in 1990. Over the next 10 years 75, 000 babies are born; 50, 000 people die; 10, 000 people move into the country; and 5, 000 people exit. What would the population be in 2000? P 1=1, 000+75, 000 -50, 000+10, 0005, 000= 1, 030, 000 people
Fertility and Mortality n Fertility: reproductive behavior of a population q Impacted by n n n Fecundity of population Diet and nutritional intake Economic and industrialization levels Sociocultural factors like age of marriage Mortality: death related behavior of a population
Population Key Terms n n Crude Birth Rate (CBR): number of live births per 1, 000 people in a year Crude Death Rate (CDR): number of deaths per 1, 000 people in a year q n n n LDC’s average CDR of 20 while MDC’s average CDR of 10 Infant Mortality Rate (IMR): number of infant (children who die before their first birthday) deaths per 1, 000 live births Life Expectancy: average number of years to be lived by a person Fecundity: ability of a woman to conceive (usually ages 15 to 45) General Fertility Rate (GFR): number of births per 1, 000 women in the fecund years Total Fertility Rate (TFR): predicted number of births a woman will have as she passes through fecund years q TFR has declined on every continent but Africa over the last 50 years n q q Example : In 1975 Mexico’s TFR was 7 but in 2016 has dropped to 2. 2 – in China in 1970 TFR was 6 but 1. 6 in 2016 TFR rate is 2. 5 across the globe 2016 TFR rate in U. S. , Europe and China is 1. 8 or less
Replacement-Level Fertility n n n n n A TFR of 2. 1 is considered replacement-level fertility meaning parents will produce the number of children needed to replace themselves TFR of 2. 1 causes zero population growth (ZPG) Natural Increase Rate (NIR) is growth rate of a population using the formula q CBR-CDR/10 q Does NOT include immigration and emigration NIR that equals zero means population won’t grow or decline Global NIR in 2014 was 1. 08%; currently 1. 20% More developed countries have an NIR of 0. 1% Less developed countries have an NIR of 1. 5% Africa’s NIR in 2014 was 2. 5%; currently 2. 6% NIR does NOT include migration
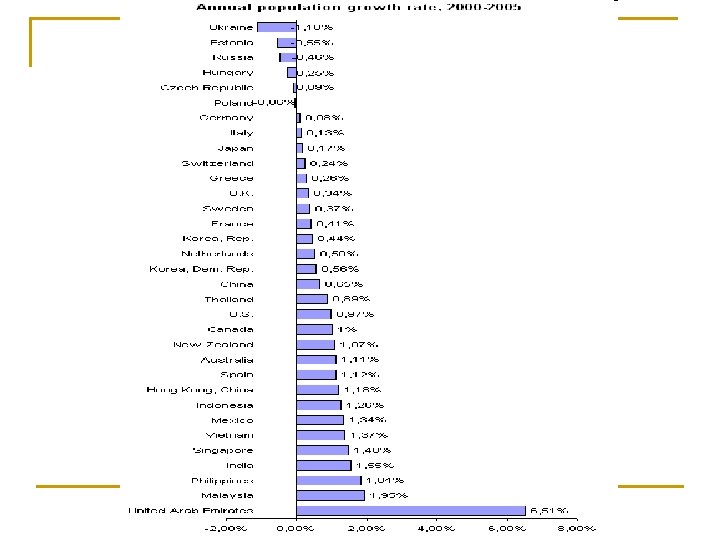
Fertility Rates Country Growth Rate % Per Year Birth Rate per 1, 000 Death Rate per 1, 000 United States 0. 4 12 8 Japan -0. 2 8 10 China 0. 5 12 7 Russia 0 13 13 Australia 0. 6 13 7 Mexico 1. 4 19 5 South Africa 1. 2 22 10 India 1. 5 22 7 United Kingdom 0. 3 12 9 Changing social values, women’s access to education & employment, better health care, and contraception have reduced fertility rates in most parts of the world.
Population Graph Options: S-curves and J curves
Rule of 70 n n Defined: time that it takes for a population to double Equation: Divide 70 by current growth rate of population q n 70/ current growth rate = doubling time Examples q q 70/5% = 14 years 70/2% = 35 years
Population Consequences The good AND the bad!
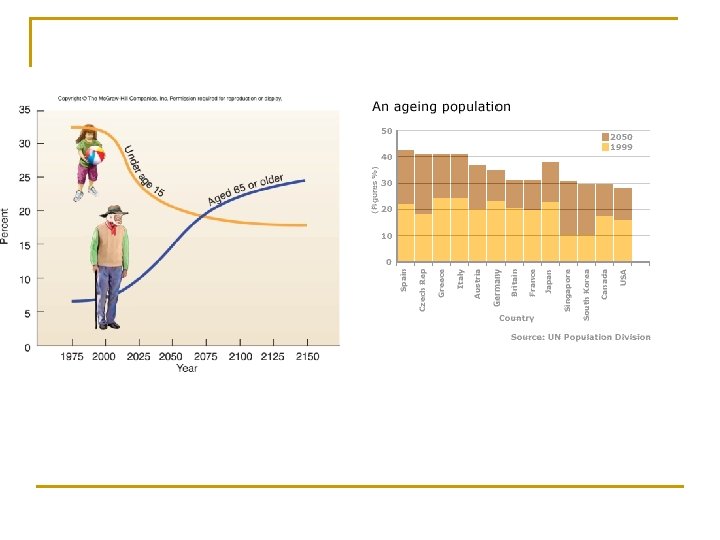
A Graying Population n A population that has more middle-aged and older people than young people q n Dependency ratio: The ratio of the number of people who are either too old or young to provide for themselves to the number of people who must support them through their own labor. This is usually expressed in the form n : 100, where n equals the number of dependents. q q n What would be the positives and negatives of a graying population? Dependents: people who depend on workers for survival Non-dependents: people who can support themselves through work High ratio means more people are dependent than working q q q Fewer people to pay taxes Social security dependency 2000 was first time in history that people under 14 years of age were outnumbered by people over 60
Causes and implications of an aging population n n Population aging is influenced by birth and death rates as well as life expectancy Social implications: retirement age, number of retired people Economic implications: dependency ratio rises Political implications: voting patterns
Carrying Capacity and Overpopulation n Carrying Capacity: number of people an area can sustain or support q q n Japan: imports food Saudi Arabia: desalinizes water to increase carrying capacity Overpopulation: when a region’s population outgrows its carrying capacity q q Resource availability very important, but resources can be indigenous or imported so not always the only factor for overpopulation Some areas have resources to produce more than they harvest, but struggle with a lack of infrastructure, political/economic stability, etc.
Other population growth consequences n One Child Policy: In China, boys now outnumber girls 119 for every 100 girls born – natural average is 105 to 100
Is population growth a problem? Two very different, but supportable ideas n Yes q Most of our increased food availability is tied to nonsustainable resources like oil q Humans bring about environmental destruction n n q n No q q I=PAT Environmental Impacts= Population size times affluence times technology Most humans live a lifestyle that is not sustainable q Food supplies have increased - in 1970 average caloric intake was 2, 435 but in 2000 average was 2, 087 Countries like China have industrialized quickly BECAUSE of increased population that create workers and a market Humans are the ultimate resource and will continue to advance to support ourselves
Let’s watch a video clip http: //www. ted. com/talks/hans_rosling_on_global_population_growth
Historical Growth The Demographic Transition Model
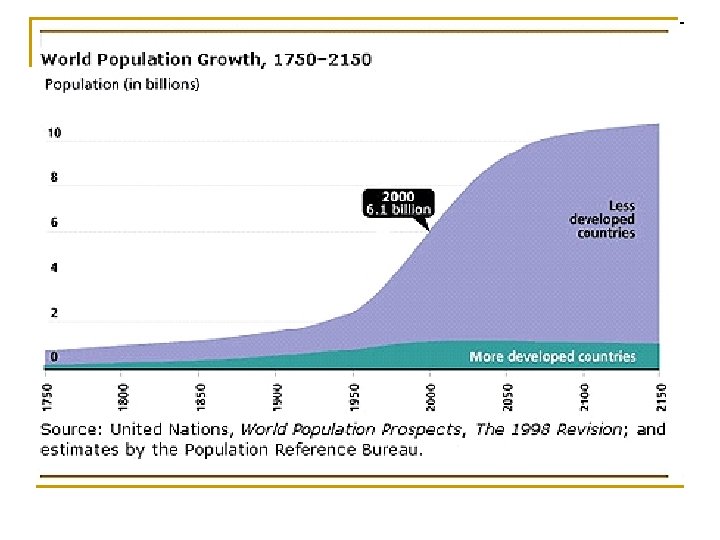
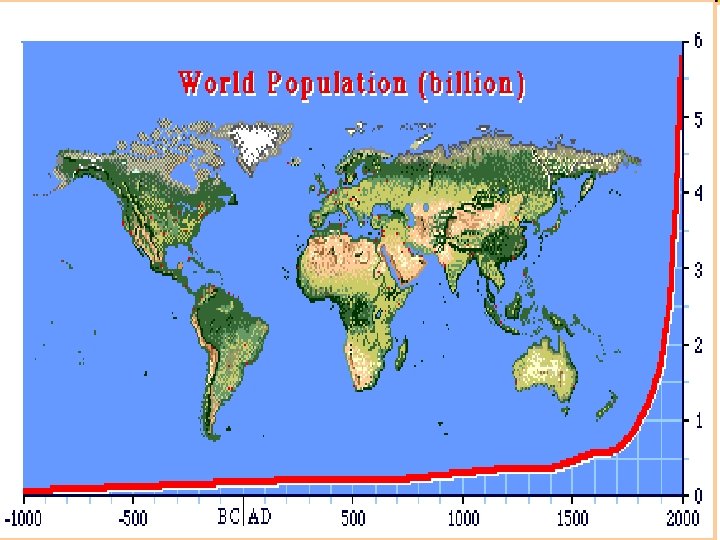
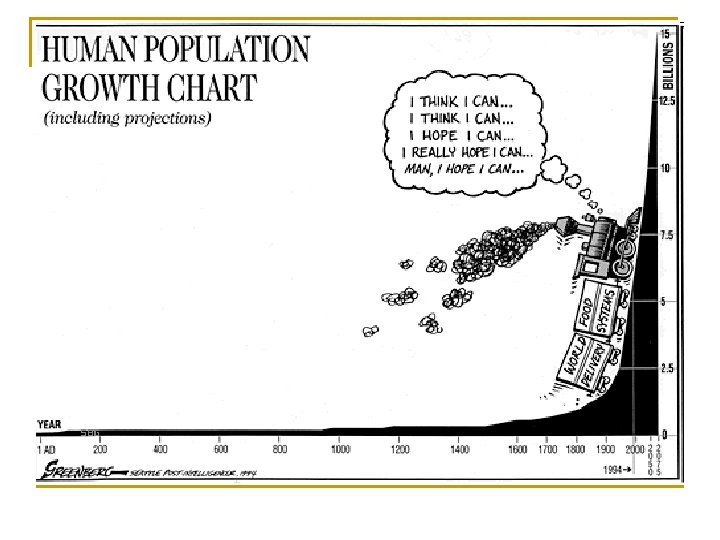
Population Explosion n n n Over the last three centuries, earth has experienced a population explosion Currently population is growing at exponential rate Exponential growth: the more people that are added, the faster the population is growing Linear (a. k. a. arithmetic) growth: constant fixed rate of growth In 1750 world population was 700 million In 200 years (1950) population grew to 6 billion
Historical population growth n 12, 000 -10, 000 BCE: First Agricultural Revolution q q q n Humans domesticated crops Led to development of cities and stationary settlements City development leads to population growth 1700’s Industrial Revolution and Second Agricultural Revolution q Industrial Revolution was new technologies and industriesstarted in England n q Moved people into cities Second Industrial Revolution improved fertilization and food storage, increasing food supply n Allowed more people in cities because extra food is grown can be sold in cities
What causes population growth? n Medical Advances q n Quantity and quality of food q n Agricultural technology has increased availability and health benefit of food Ethnic and religious issues q q q n Inoculations, better health care, new medications Many cultures forbid birth control or abortion Religions encourage having children Some cultures have beliefs that spread disease Economic issues q q Agriculturally based economy=higher birth rate Industrial or service based=low or no population growth
Population Projections for the Future n n Different growth scenarios exist Medium growth (most accepted) q n Low-growth q n 2050=9 billion; 2100=9. 5 billion Population will begin declining: 2050=7. 5 billion; 2100=5. 1 billion High-growth scenario q 2050=11 billion; 2100=16 billion
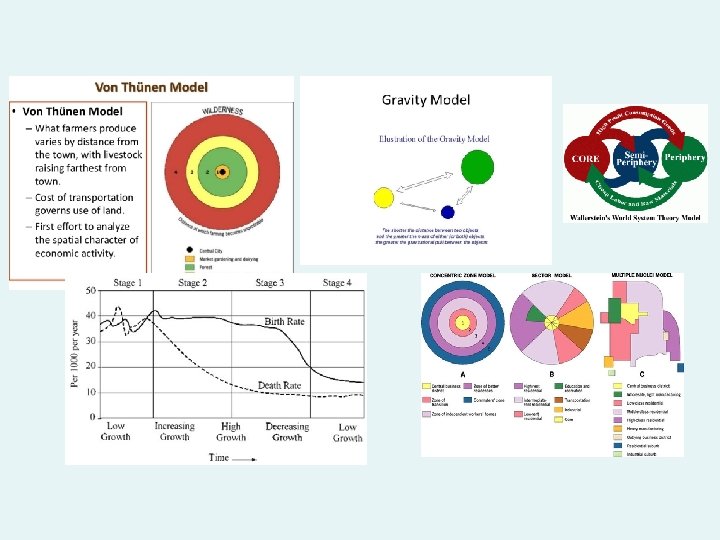
Models • Model defined: An abstract representation of reality created to simplify complex systems. We use them in APHG to help us understand spatial relationships and phenomenon. • 3 Types: Graphic, Verbal, Mathematical • Geographers take one of two approaches to create a model: • Empirical Approach- look at data first and then generalize to a theory; OR Theoretical Approach – total guess and then test • We will learn about many models in Human Geography and it is VERY important for you to know and understand all of them
Demographic Transition Model n n n Defined: DTM predicts changes in birth, death and natural increase rates in countries as they transition or mature Based on assumption that economics drive demographic change and that all countries will pass through four stages of demographic transition or change The three measurements in the model are CBR, CDR and NIR
Stage 1: Low Growth (High Stationary Pre-Industrial Stage) n n n Hunter and Gatherer Societies High CBR and CDR leading to low NIR Fluctuation in CBR and CDR because of disease, famine and war Usually characterizes a subsistence farming country without industrialized economy All countries have moved on to Stage 2 today
TRANSITION TO STAGE TWO IN CLASSIC DTM Agricultural technology Improvements in food supply: higher yields as agricultural practices improved in “Second Agricultural Revolution” (18 th century) In Europe, food quality improved as new foods introduced from Americas Medical technology Better medical understanding (causes of diseases; how they spread) Public sanitation technologies Improved water supply (safe drinking water) Better sewage treatment, food handling, and general personal hygiene Improvements in public health especially reduced childhood mortality
Stage 2: High Growth (Sharply Expanding Early Industrial Stage) n n n Agricultural/Early Industrial Societies High CBR: Children are still needed on the farms to help Declining CDR: CDR starts to drop as new health care systems arrive-industrialization has begun but CBR has not fallen because children still seen as economic necessity NIR increases because same high number of births is occurring with fewer deaths to match the high birth numbers Population expansion is high
Declining Infant Mortality Rates
TRANSITION TO STAGE THREE IN CLASSIC DTM Societies become more urban, less rural Declining childhood death in rural areas (fewer kids needed) Increasing urbanization changes traditional values about having children City living raises cost of having dependents Women more influential in childbearing decisions Increasing female literacy changes value placed on motherhood as sole measure of women’s status Women enter work force: life extends beyond family, changes attitude toward childbearing Improved contraceptive technology, availability of birth control But contraceptives not widely avail in 19 th century; contributed little to fertility decline in Europe … Fertility decline relates more to change in values than to availability of any specific technology
Stage 3: Moderate Growth (Expanding Later Industrial Stage) n n Industrial Societies Sharply declining CBR drops because families’ decisions to lower number of children they are having NIR is decreasing but still greater than zero so population is still expanding
Stage Three: Further improvements in medicine lower death rates more; raise life expectancies Measles Mortality, US, since 1900 TB Mortality, US, since 1900
Rapidly increasing urbanization in world LDCs today Population Classified as Urban
Strong inverse relationship between female literacy and fertility rates, observed globally Increasing availability and use of modern contraception in most LDCs since 1970 s
Stage 4: Low Growth (Low Stationary Post Industrial Stage) n n Tertiary Societies CBR and CDR meet at equal levels (equilibrium) but this time they are not at low levels NIR is low Seen as modern society stage with zero population growth
Stage 5? (Population Decline) Some demographers think we should add a 5 th stage to the DTM, but it is theoretical at this point. n Higher CDR than CBR n Irreversible population decline n No countries are in stage 5 but some countries (esp. in Europe) are in decline n
DTM Full Cycle n n n A country that moves through 4 stages completes a cycle from low NIR in Stage 1 to low NIR in Stage 4 Two critical differences: Stage 1 CBRs and CDRs are very high (35 -40 / 1000) and very low in Stage 4 (10 / 1000). Total population of country is much higher in Stage 4 than in Stage 1
Criticisms of DTM n n Based on England's transition from subsistent economy to industrialized society All countries may not pass through this system q q n Some African countries received medicines and food from more developed countries England took 100 years to go from stage 2 to 3 and countries today are being pushed at a much faster rate No 5 th stage that shows a continuing decline in the CBR as seen in modern countries like France and Germany-something that shows the graying population
Differences in DTM experience: MDCs & LDCs ● Faster decline in death rates — Tech improvements diffused from MDCs & applied rapidly in LDCs post-WW 2 ● Longer lag between decline in deaths and decline in births — Stage 3 slower start in LDCs where econ growth is delayed ● Higher max rates of growth in LDCs — Over 3. 5% peak NIR in Mauritius and Mexico; only 1. 3% peak in Sweden
Age structures today in LDCs are much younger than MDCs experienced – leading to prolonged “Demographic Momentum” – expected growth of population long after fertility declines Percentage of Population Under Age 15
Demographic Momentum n n Also known as hidden momentum Tendency for population to continue growing after fertility has declined because of young age distribution Happens when people live longer-even though TFR is 2. 1 to 2. 5, population is still growing because people are dying at slower rates and there is a large group of young people Makes zero population growth difficult to attain
Global DTM n n n All countries on globe are out of Stage 1 Most Latin American and Asian countries are in Stage 3 Most African countries remain at high growth in Stage 2 Many European countries at end of Stage 4 Japan & some European countries are facing Stage 5 (if it exists) or the graying population problem
Population Theories
Population growth theories Thomas Malthus n q q n n n Wrote An Essay on the Principle of Population, 1798 Argued that global population was growing geometrically while food supplies were growing arithmetically Advocated birth control and celibacy (positive checks) and warned of war, starvation and disease (negative checks) Said population growth caused poverty, crime and misery Karl Marx q Said population wasn’t problem-the problem was unequal distribution of resources and wages q Said population growth was caused by poverty and unequal distribution so if things were distributed evenly, population wouldn’t grow Ester Boserup q Believed overpopulation problem could be solved by increasing number of subsistence farmers because when humans are faced with starvation, they WILL develop new technology Neo-Malthusians q Argue that sustainable development hinges on Malthusian idea that human population must reach a “sustainable” level within carrying capacity
MALTHUS’ THEORY OF POPULATION GROWTH In 1798 Thomas Malthus published his views on the effect of population on food supply. His theory has two basic principles: Population grows at a geometric rate i. e. 1, 2, 4, 16, 32, etc. Food production increases at an arithmetic rate i. e. 1, 2, 3, 4, etc.
MALTHUS (CONT. ) The consequence of these two principles is that eventually, population will exceed the capacity of agriculture to support the new population numbers. Population would rise until a limit to growth was reached. Further growth would be limited when: preventive checks - postponement of marriage (lowering of fertility rate), increased cost of food etc. positive checks - famine, war, disease, would increase the death rate.
MALTHUS (CONT. ) Population grows geometrically…. Population exceeds carrying capacity… Population is kept in “check”– preventative and/or positive checks
2. The Malthusian Crisis ■ The “Malthusian crisis” • Available agricultural spaces are limited. • Technical progresses (machinery, irrigation, fertilizers, and new types of crops) are slow to occur. • Increasing incapability to support the population. • If this persists, the population will eventually surpass the available resources. • The outcomes are “Malthusian crises”: • Food shortages. • Famines. • War and epidemics. • “Fix” the population in accordance with available resources. • Necessity of a “moral restraint” on reproduction. © Dr. Jean-Paul Rodrigu
2. The Malthusian Crisis t 3 Quantity Technological Innovation t 2 t 1 Resources Population Overexploitation Time © Dr. Jean-Paul Rodrigu
2. The Malthusian Crisis ■ The Malthusian Crisis has not occurred • Malthus has been criticized on several accounts during the last 200 years. • Religious view (Protestantism), racist and elitist. • Did not foresee the demographic transition: • Changes in the economy that changed the role of children in the industrializing societies. • Failed to account for improvements in technology: • Enabled food production to increase at rates greater than arithmetic, often at rates exceeding those of population growth. • Enabled to access larger amounts of resources. • Enabled forms of contraception. © Dr. Jean-Paul Rodrigu
© Dr. Jean-Paul Rodrigu
Global Growth in Population and Grain (Wheat and Rice) Production, 1961 -2005 © Dr. Jean-Paul Rodrigu
ESTHER BOSERUP’S THEORY OF POPULATION GROWTH In contrast to Malthus, instead of too many mouths to feed, Boserup emphasized the positive aspects of a large population; In simple terms, Boserup suggested that the more people there are, the more hands there are to work; She argued that as population increases, more pressure is placed on the existing agricultural system, which stimulates invention; The changes in technology allow for improved crop strains and increased yields.
ANTI-POPULATIONISTS VS. PRONATALISTS Malthus– anti-populationist Echoed in recent debates by Paul Ehrlich, author of The Population Bomb; Ehrlich believed that the earth’s carrying capacity would quickly be exceeded, resulting in widespread famine and population reductions; Boserup– pronatalist (cornucopian) Echoed in recent debates by Julian Simon, who opposed Ehrlich by using economic theories; ie. Resources needed to support populations are becoming more abundant, not scarcer;
Checks on Population Public and Private
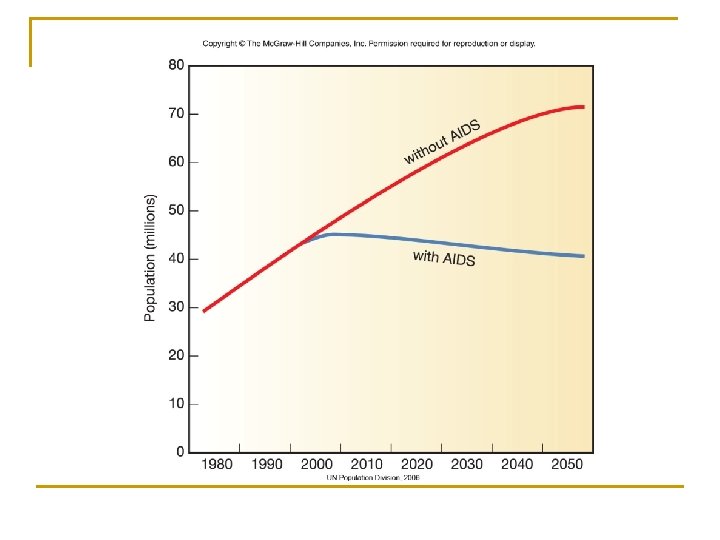
Negative Checks on Population n n Three basic categories: natural disasters, war or political turmoil and economic issues Black Plague: killed 40% of European population and 13 million Chinese in 1300 s Irish potato famine: killed almost 50 percent and caused massive emigration HIV/AIDS: since 1980 s has risen to pandemic (disease affecting very large amounts of people in large area) levels q In 2005, 39 million people living with HIV, nearly 3 million died from AIDS q In Sub-Saharan Africa, 19% of all adults are infected q China expected to see nearly 11 million infections by 2010 q More than ½ of 5 million new cases every year are people ages 15 -24 q By 2010 there will be 25 million AIDS orphans
Global HIV/AIDS Rates
Population Policies n Pro-natalist policies promote reproduction and bigger families-sometimes called expansive policies q q q n Examples include tax breaks for children, anti-abortion laws, paid time off for mothers, free child care Found in France, Sweden, Japan and other European countries Also found historically and in subsistence type economies Anti-natalist policies encourage reduction in fertility rates-sometimes called restrictive policies q q Examples include easily accessible abortions and contraceptives, or government policies limiting children Examples include India and China’s One-Child Policy
Global population control n n n United Nations has held many conferences on population control issues 1974 UN population conference in Romania didn’t really work because of Cold War tensions 1984 conference held in Mexico influenced by new technologies to increase global food production and China’s recent enactment of One-Child Policy 1994 conference in Egypt proposed the Cairo Strategy-Teaching contraceptive uses in schools in poorer countries q Cairo Strategy has been very controversial with certain conservative groups 2004 conference declared the key to limiting population growth is to empower women through education and economic parity (equality)
Migration a. k. a. Population Movement
Migration n n In the modern world, friction of distance (difficulty of distance) has been reduced Process of coming together even though distances are not decreasing is called spacetime compression Spatial interaction is the interconnectedness of two places Migration: permanently moving from home region and crossing an administrative boundary
Why do people migrate? n Migration stream is pathway from a place of origin to a destination q q n Push factors: reasons people leave a place q q n Many develop because of information exchange between people Usually found with migration counter stream Can be cultural, economic, environmental, or political Examples: high taxes, high crime rates, warfare, abusive governments, unbalanced sex ratios, overpopulation, natural disasters, persecution, poor economic conditions Pull factors: reasons people go to a new place q q Can be cultural, economic, environmental, or political Place desirability: possession of positive features making people want to move there n Examples: affordable real estate, being near family member, good schools, religious freedom, jobs, better quality of life
Internal Migration n n Defined: movement within a country Interregional migration q n Intraregional migration q n Moving from region in the country to another region Moving within a region, such as from a city to a suburb Rural to Urban migration q Migration from farms to cities
Voluntary vs. Forced Migration n n n Voluntary Migration Occurs when migrants have an option of whether or not to move; done by choice Usually not associated with violence or abusive governments Example: a new job, moving to be near family May be transnational, internal, chain, step, and rural to urban Patterns of both types of migration may be affected by distance and physical features n n n Forced Migration Immigrants pushed from land Asylum seekers Refugees: migrants fleeing some form of persecution or abuse International refugees: fell country to move to another country Intranational refugees: abandon homes but remain in their country to escape persecution q Sometimes called internally displaced peoples
Brief history of migration n n About 3% of worlds people have migrated from their countries of origin North America, Oceania and Europe have net in-migration Asia, Africa and Latin America have net out-migration 50% of Southwest Asia’s population are immigrants U. S. had three major waves of immigration q Colonial era (1607 -1776) primarily from Europe and Africa and was both voluntary and involuntary; slave trade was forced migration q 19 th century primarily from Europe n q Before 1840 England, 1840 -1850’s German and Irish 20 th century n n 1907 northern and western Europe and Russia; 1970 -1980’s Asia leading source of immigrants, 1980’s Latin America primary source Immigration altered by Quota Act of 1921 which allowed highest number of immigrants from European countries and discriminated against Asians and other regions
8 Great Migrations (KNOW THESE!)
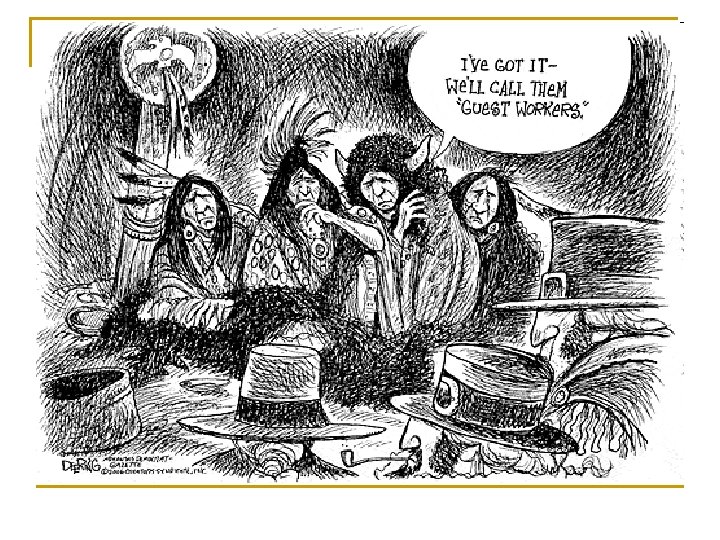
Migration Selectivity n n n Often, migration fits into a pattern based on age, income and other socioeconomic factors Defined: evaluation of how likely someone is to migrate based on personal, social and economic factors Most influential factor is age q n n Most people move 12 times in their lifetimes, ½ before age 25 Brain Drain: net out-migration from one place of most educated workers who leave for more attractive places Guest Workers: people let into a country to work jobs native people don’t necessarily want to do like heavy, dangerous or disagreeable work
Gravity Model n n n Used to estimate spatial interaction and movement between two places Resembles Isaac Newton’s theory of gravitational pull Says that larger places attract more migrants however asserts that closer places is directly proportionate to population size and inversely proportionate to the distance between the two places Proposes an equation that balances distances and size in trying to predict spatial interactions q Example: more people will migrate from Mexico to the U. S. than England because of distance decay factors Does not factor in migration selectivity factors like age, educational level and human behavior
Where is the optimal place to put a pizza shop based on the gravity model?
Ravenstein’s Migration “Laws” n n n Late 1800 s, British geographer Ernst Ravenstien identified 11 generalizations about migration-some still apply today The majority of migrants travel short distances Step migration: person has a long distance goal in mind achieves it in a series of small steps q q Intervening opportunity: when an opportunity is found along the way so journey is stopped Intervening obstacles: barriers in migration journey like financial problems, roadblocks, immigration requirements and wars
Ravenstein’s “Laws”, cont. n Migrants who are traveling a long way tend to move to larger cities rather than smaller cities q q n Large city has more opportunities, creating an almost magnetic pull Keep in mind, Ravenstein was writing during height of Industrial Revolution Rural residents are more likely to migrate than are urban residents q q True in Ravenstein’s time because of Industrial Revolution Seen in many developing countries like China and Brazil
Last three “Laws” n Families are less likely to migrate across national borders than are young adults q q n Every migration stream creates a counter stream q q q n It is easier for single people to migrate than whole families Singe people less encumbered with responsibilities Net migration is the number of people in the original flow minus the number of people in opposite flow (counter stream) Caused by many factors Example: Jews leaving Germany before WWII who were captured at borders and forced to return or young boy from rural setting who moves to city and then returns to rural area after trying city life Gender: International=male, internal=female
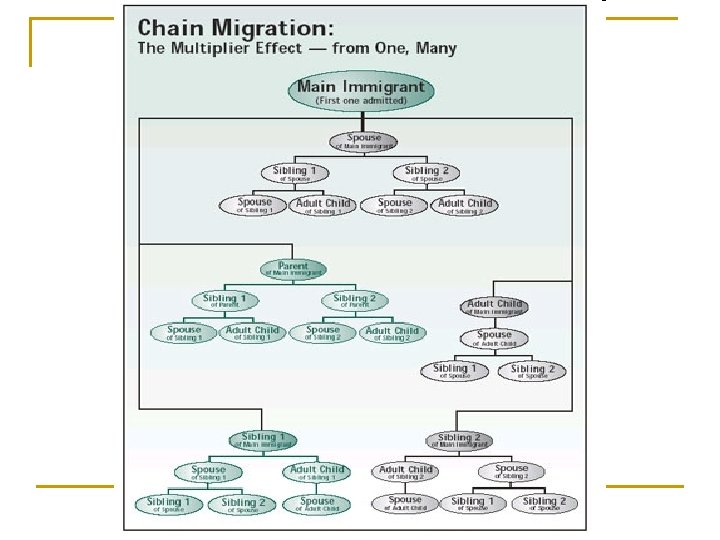
Chain Migration n n Occurs when people migrate to be with other people who migrated before them and with whom they feel some tie Tie can be religious, familial, cultural, ethnic or any type of connection It increases migrant streams to one area Results in formation of ethnic enclaves Most common type of migration to the U. S.
Consequences of Migration n Governments institute policies to encourage migration q n Or policies to restrict migration q n Examples: Homestead Act of 1862 where U. S. gave land to settlers willing to farm for 5 years; guest worker programs Example: Make entering a country difficult with educational standards, restricting types of jobs, or setting a quota on number of people of one ethnicity Consequences: positive or negative on countries of origin and receiving countries q q Countries of origin: relief from overcrowding, less working-age people, brain drain, sending remittances home Receiving countries: Spread of culture (languages, religions, foods, entertainment, traditions); hard workers who start businesses and create innovations; spread of diseases, conflicts between different ethnicities