Population Pyramids Population pyramids are used to show


- Slides: 15
Population Pyramids
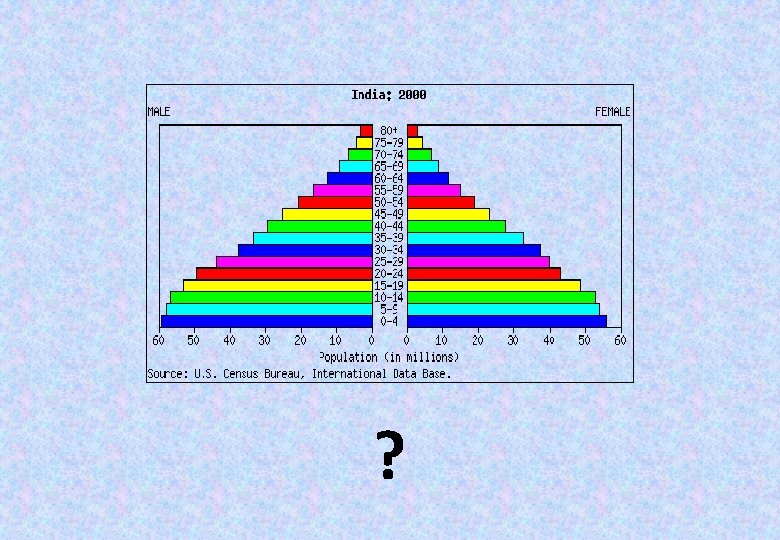
Population pyramids are used to show information about the age and gender of people in a specific country. Male Female There is also a high death rate. In this country there is a high birthrate Population in millions This population pyramid is typical of countries in poorer parts of the world (LEDCs. )
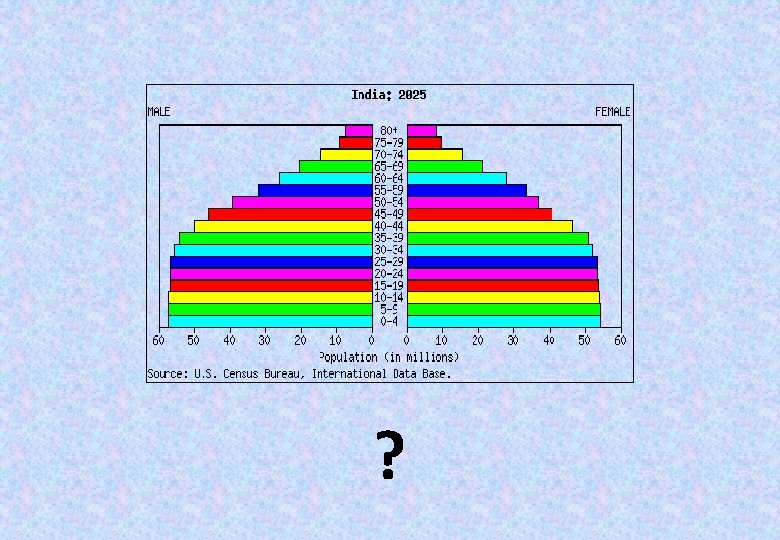
In some LEDCs the government is encouraging couples to have smaller families. This means the birth rate has fallen.
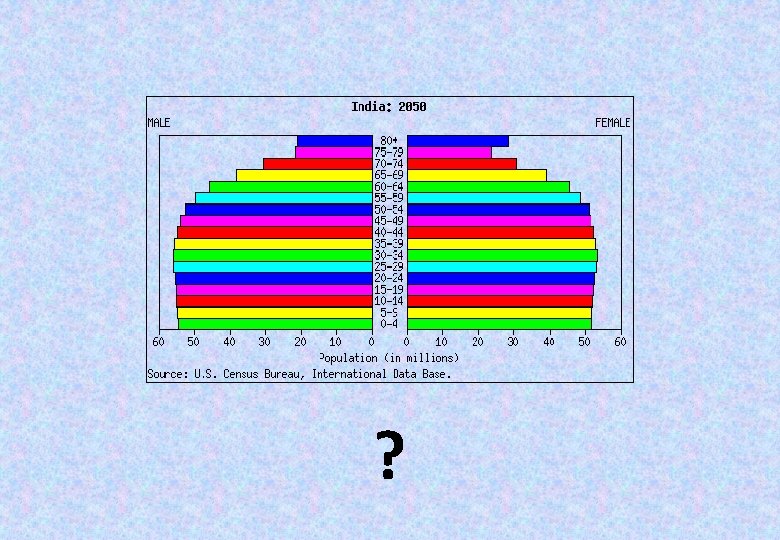
Male Female The largest category of people were born about 40 years ago. In this country the number of people in each age group is about the same. Population in millions In this country there is a low birthrate and a low death rate. This population pyramid is typical of countries in the richer parts of the world (MEDCs. )
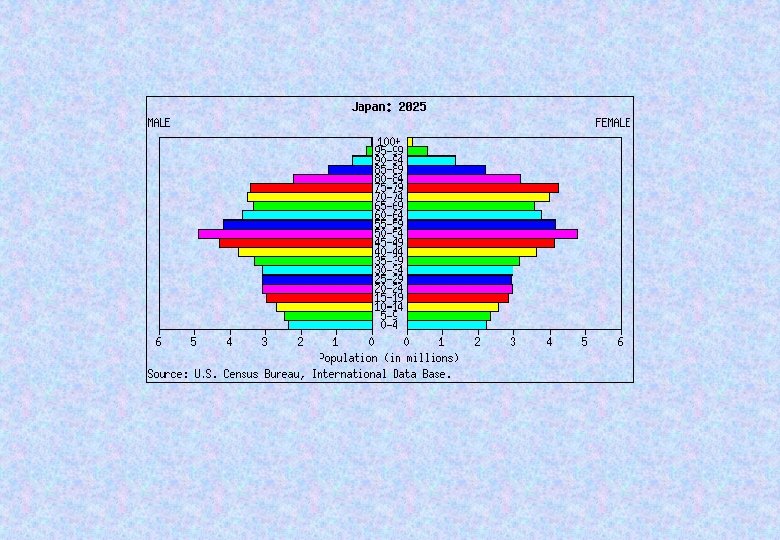
Male Female Population in millions In this country the birth rate is decreasing. This is happening more and more in many of the world’s richer countries. In the future the elderly people will make up the largest section of the population in this country.
Male Female Population in thousands This country has a large number of temporary workers. These are people who migrate here especially to find a job.
Population pyramid for Mozambique Population pyramid for Iceland
What happens next?
What is going to happen to Japan’s population in the future? Why does this matter?
Your task: • Open your own Power. Point presentation. • Look at the list of LDCs (less developed countries) on Wikipedia and choose 1 from the list; look at the list of developed countries and choose 1 MDC (more developed country) from the first list given • Go to www. census. gov • Select Search and type in IDB. • Select International Database • Select Data Access • Find a population pyramid for the LDC you chose for 2010; save the picture and insert it into a Word document; write at least 3 sentences that explain/describe the data shown in the pyramid • Repeat for the MDC you chose • Choose any other country and find population pyramids for 2000, 2025 and 2050 • Write two paragraphs explaining/describing what the graphs show and give reasons for the patterns. Explain how the population of this country is changing and hypothesize about how this could affect the country.
When you have finished: Find out some background information on each country and add this to your document. Concentrate on facts and figures that can be used to compare the countries such as % of children in school, type of jobs available, the GDP per capita, etc.