Planning Improvement Performance PIP Planning Advisory Service July
 Planning Advisory Service July 2013 www. pas. gov. uk")


 14 Householders 12 10 8 £ 900")


- Slides: 30
Planning Improvement & Performance (“PIP”) Planning Advisory Service July 2013 www. pas. gov. uk
What is PAS ? We help Councils to improve
Today • • Open the kimono Real councils speak their brains Recognising who is good The future • Q&A • Debate and argument • Who is in the room ? Benchmark experience ?
Session 1: Open the kimono 1. 2. 3. 4. 5. 6. - Applicants: Speed and certainty The basics: “How much stuff ? ” The awkwards: “How does it present itself ? ” The non-obvious: “How should we resource it ? ” Improvement and productivity Conclusions Get beyond the CIPFA pdf. Rearrange it. Be an active participant in history
The “pick 3” preferences
Vote is for an interactive service votes chance to amend duty planner submission check-over speedy decisions consistent advice quick pre-app website validation checklist councillor involvement count 349 305 302 256 225 157 100 93 30
Speed
1. How much stuff ? Version 1 • Cost = time x direct cost + overheads. eg – Householder = 9 hrs x £ 18/hr + 43% = £ 240 • Gives us two ways of thinking about resources – Cost (what the customer would pay, inclusing pensions, office, the Mayor’s limo) – Hours (how quickly we work in the department)
Aggregation of 110, 000 applications 40, 000 35, 000 30, 000 25, 000 20, 000 34, 790 15, 000 29, 572 10, 000 13, 477 5, 000 11, 941 10, 310 6, 813 1, 611 Householder All other Other minor Conditions All dwellings Heritage Major commercial 182 All Mineral Extraction 181 All Waste Recovery
Direct costs of £ 27 m £ 7, 000 £ 6, 000 £ 5, 000 £ 4, 000 £ 3, 000 £ 6, 398, 984 £ 5, 907, 708 £ 5, 108, 900 £ 4, 403, 242 £ 2, 000, 000 £ 1, 444, 803 £ 1, 033, 215 £ 1, 813, 544 £ 157, 337 £Householder All other Other minor Conditions All dwellings Heritage Major commercial All Mineral Extraction £ 357, 122 All Waste Recovery
fee no fee 0 -100 101 -200 201 -400 401 -1000 1001 -2000 2001 -5000 5001 -50 k 50 k-204 k Count cumulative 36, 356 25% 25, 085 42% 56, 223 80% 19, 663 94% 3, 455 96% 2, 721 98% 1, 761 99% 1, 232 100% 51 100% 146, 547
1. How much stuff ? Version 1 1. It’s the dwellings that will get you – Unfortunately – Not demand management / co-design / volunteers – The answer can only be policy (!) 2. We grouped it unhelpfully – “all other” = stupidly large 3. This is a high volume, low value game
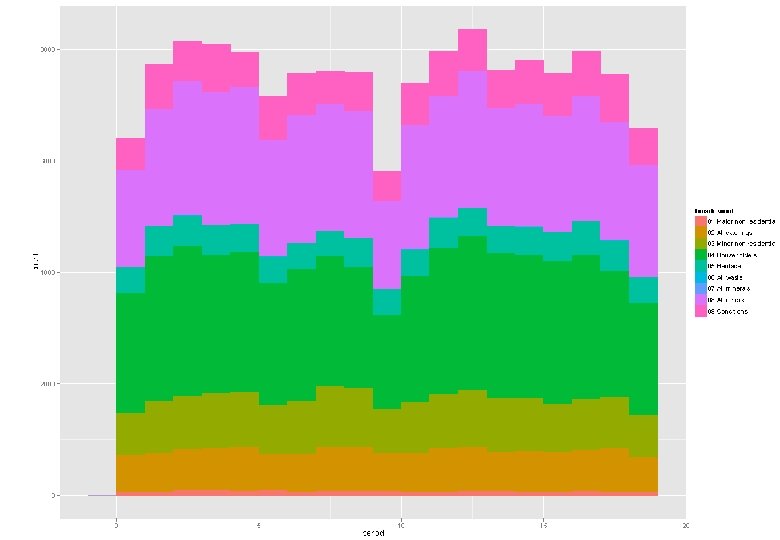
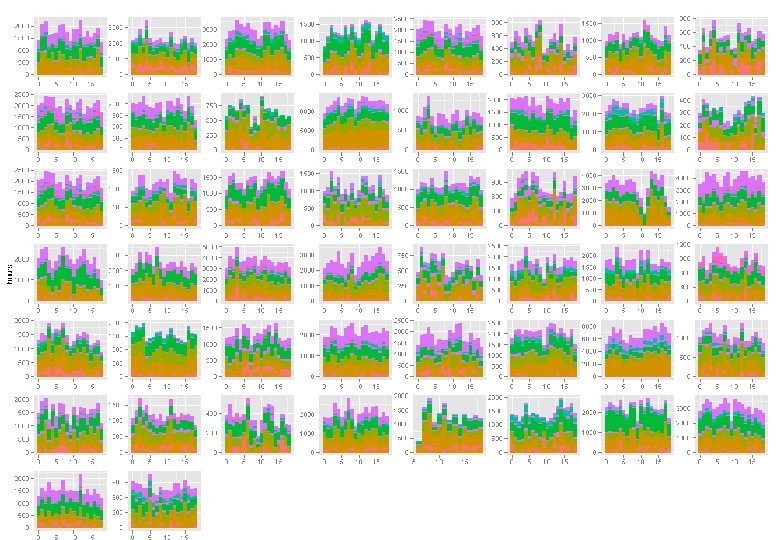
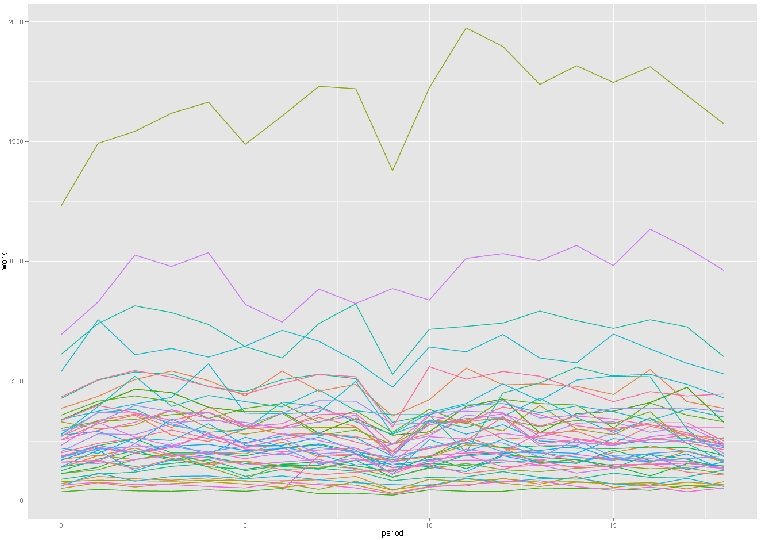
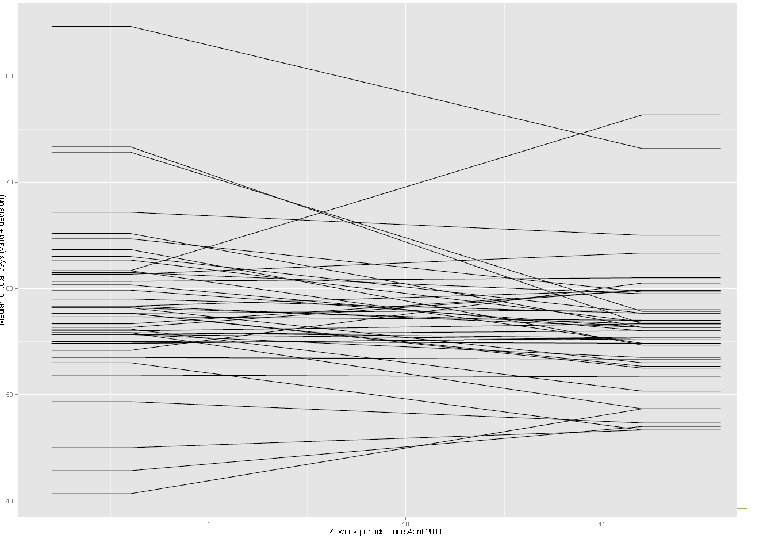
2. Stuff over time • • Serendipitous benchmark cock-up 144, 000 applications held by club Coded the same, with resource info !
30 20 10 0 1 -10 -20 -30 -40 -50 2 3 4 5 6 7 8 9 10 11 12 13 14 15 16 17 18 19 too little too much
balance 19 18 17 16 15 14 13 12 11 10 balance 9 8 7 6 5 4 3 2 1 -50 -40 -30 -20 -10 0 10 20 30
2. Stuff over time 1. Your workload fluctuates more than you think it does – Annual leave controls ? – To what level is your permanent resource ? 2. Your peers fluctuate in roughly the same way 3. Joining together just makes the problem bigger
3. Costs and income • There are three drivers of cost: – Hourly rate – Overhead – Productivity
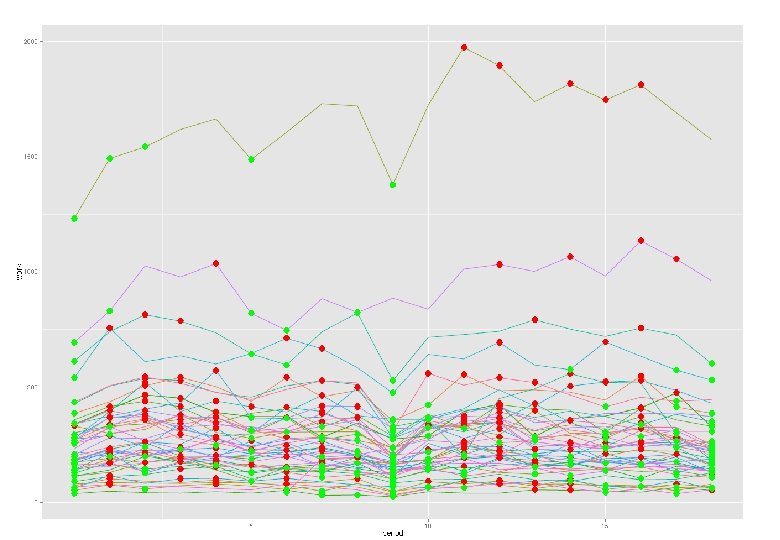
16 Hours per App (in same order) 14 Householders 12 10 8 £ 900 Cost per App 6 £ 800 4 £ 700 2 £ 600 0 1 £ 500 £ 400 3 5 7 9 11 13 15 17 19 21 23 25 27 29 31 33 35 37 39 Cost per Hour 30 £ 300 25 £ 200 20 £ 100 £ 1 3 5 7 9 11 13 15 17 19 21 23 25 27 29 31 33 35 37 39 15 10 Consider 2 nd place 5 0 1 3 5 7 9 11 13 15 17 19 21 23 25 27 29 31 33 35 37 39
3. Costs and income In preparation for locally set fees, probably three things need fixing: 1. Hourly rate: how much are people paid ? Can you get them to spend most of their time working ? 2. Productivity: how quickly do they work ? 3. Overheads: pension scheme / ICT / history / horse trading You might be more in control of #2, but they all matter.
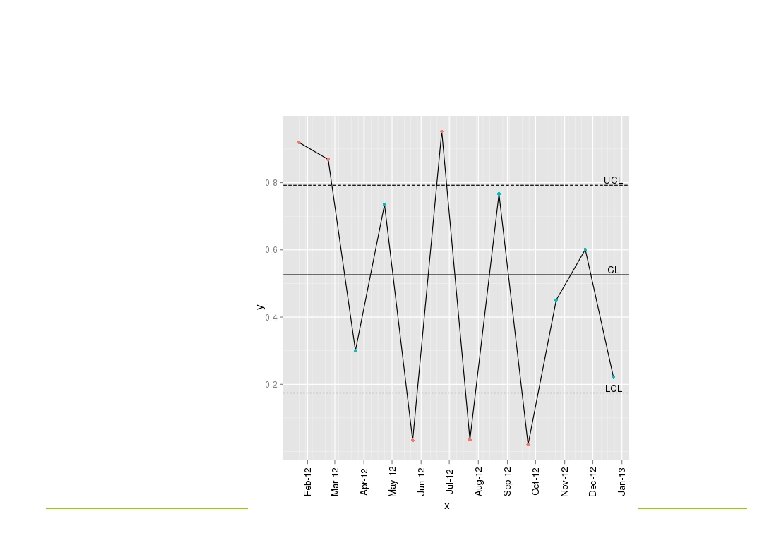
4. Improvement • 87, 000 “common” applications – Compare simple with simple • Using receipt – to – determine – Include time taken to make valid
How do I find improvement ?
5. Conclusions & thoughts 1. This is a productivity game, not a cost management game. Big range. 2. Fluctuating workload with fixed resource = fail – How do you know how much work is on desks? 3. Planning authorities are of a variety – Queasiness about league tables 4. Listen to your users. They want something different. And might even pay for it. 5. Go forward or get caught out
BUT … BUT • Beware what is not in the numbers – Purpose – Prediction (Market pick up capacity) – Risk appetite • This is a people business – Relationships with applicants, committee • This is all the important stuff !
My thoughts • There is no “best practice”. – But there are standard measures • There is lots of learning and immediate improvement possible for almost all councils – But it’s easy to make things worse • This is never finished. • Tackle the Venn of good planning / good management – Successional planning?