Physics Unit 1 1 Measurement Metric System Calculating



- Slides: 66
Physics Unit 1. 1 Measurement Metric System Calculating using dimensional analysis Recording with scientific notation
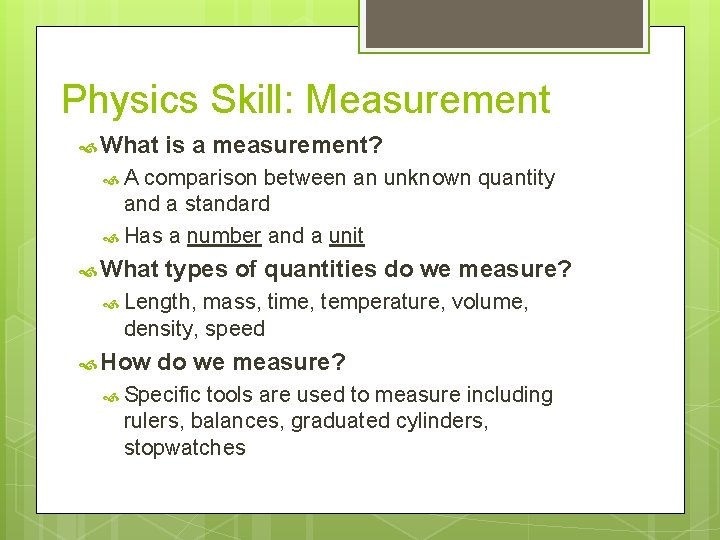
Physics Skill: Measurement What is a measurement? A comparison between an unknown quantity and a standard Has a number and a unit What types of quantities do we measure? Length, mass, time, temperature, volume, density, speed How do we measure? Specific tools are used to measure including rulers, balances, graduated cylinders, stopwatches
Types of Measurements Quantitative data Data that describes an object numerically; reveals structure Qualitative data Data that describes an object using description; reveals behavior
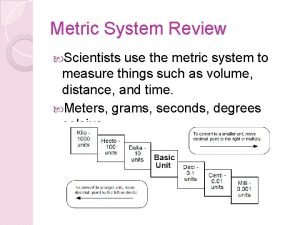
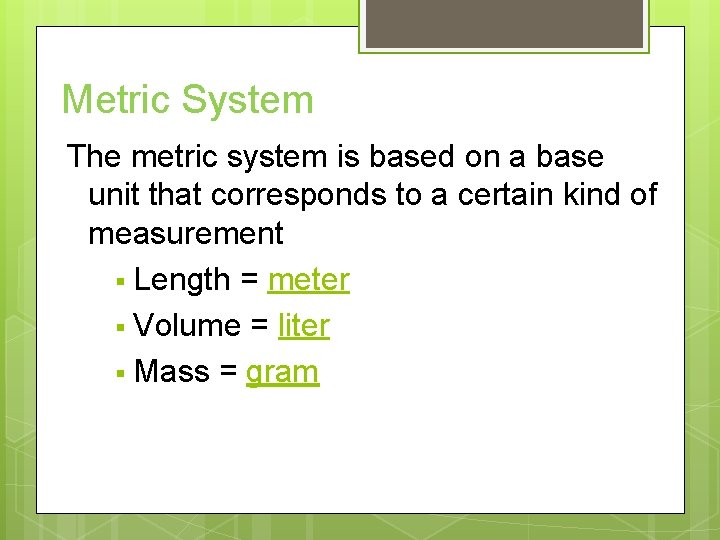
Metric System The metric system is based on a base unit that corresponds to a certain kind of measurement § Length = meter § Volume = liter § Mass = gram
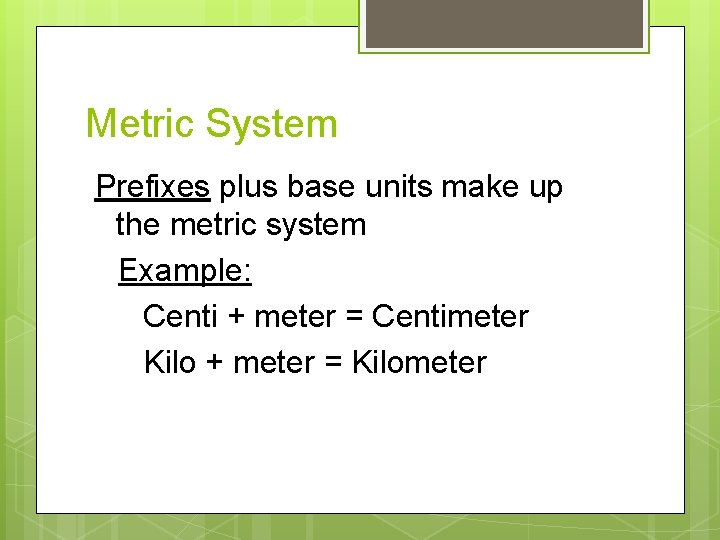
Metric System Prefixes plus base units make up the metric system Example: Centi + meter = Centimeter Kilo + meter = Kilometer
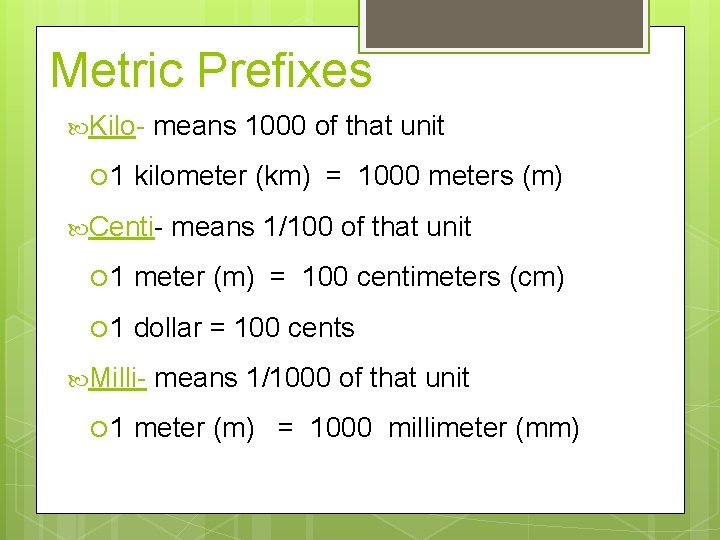
Metric Prefixes Kilo- means 1000 of that unit 1 kilometer (km) = 1000 meters (m) Centi- means 1/100 of that unit 1 meter (m) = 100 centimeters (cm) 1 dollar = 100 cents Milli- means 1/1000 of that unit 1 meter (m) = 1000 millimeter (mm)
Hint. . . Notice that the #1 always goes with the bigger unit!
Know these prefixes: Kilo Hecto Deka Base Unit Deci Centi Milli
Dimensional Analysis v What happens when you divide a number by itself? v What happens when you divide a unit by itself? In both cases, you get the number 1. v Dimensional analysis involves multiplication and division. Focus on cancelation of UNITS v A method of unit conversion v
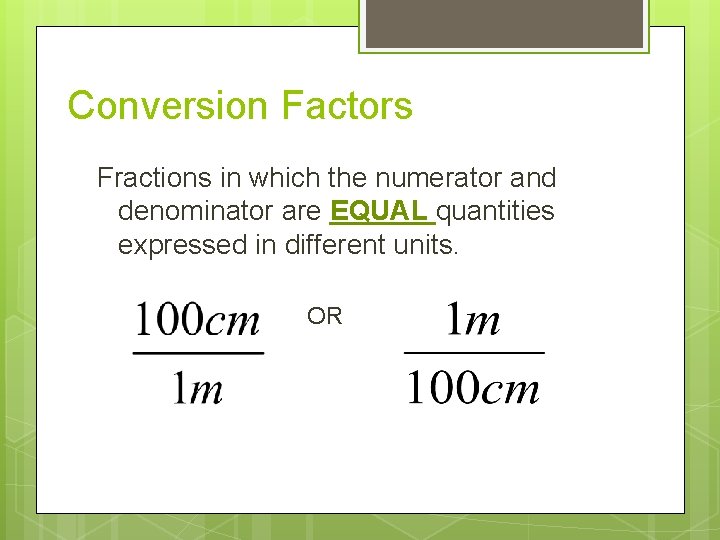
Conversion Factors Fractions in which the numerator and denominator are EQUAL quantities expressed in different units. OR
Dimensional Analysis Steps: 1. Read the question! How many minutes are in 2. 5 hours?
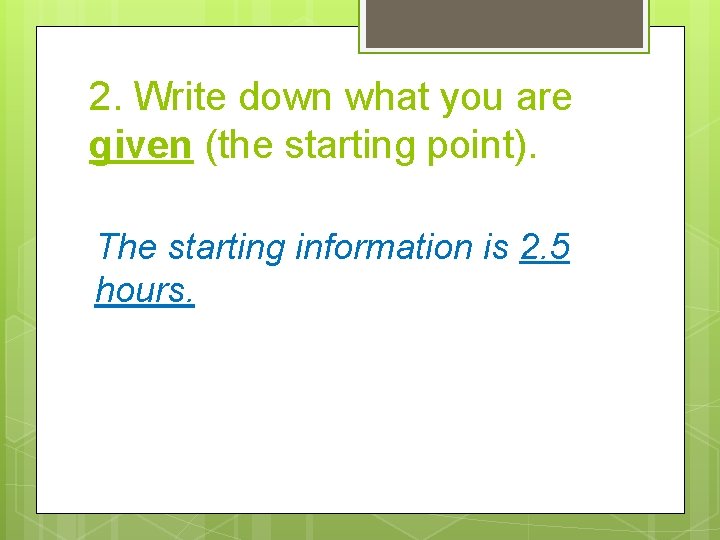
2. Write down what you are given (the starting point). The starting information is 2. 5 hours.
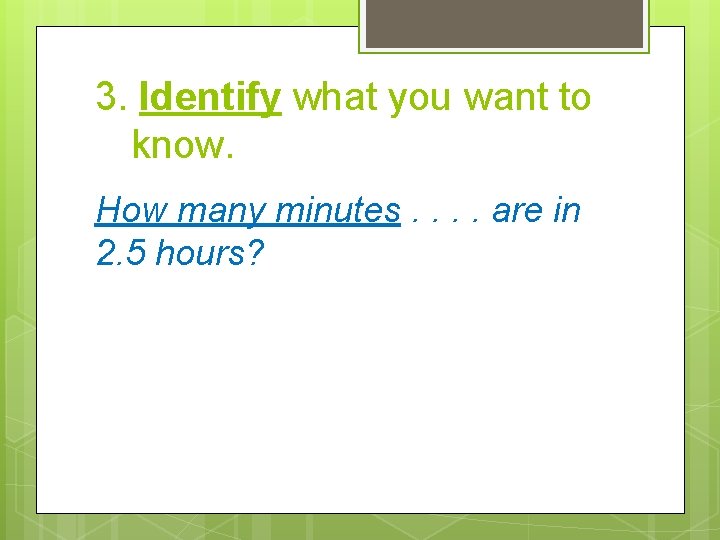
3. Identify what you want to know. How many minutes. . are in 2. 5 hours?
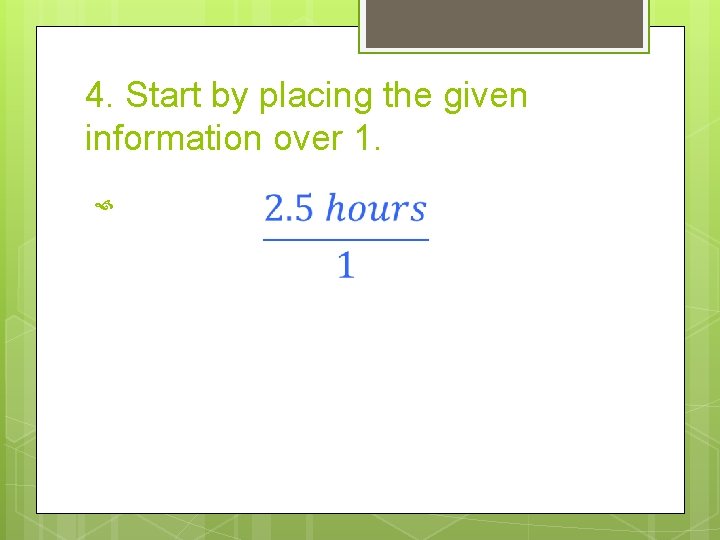
4. Start by placing the given information over 1.
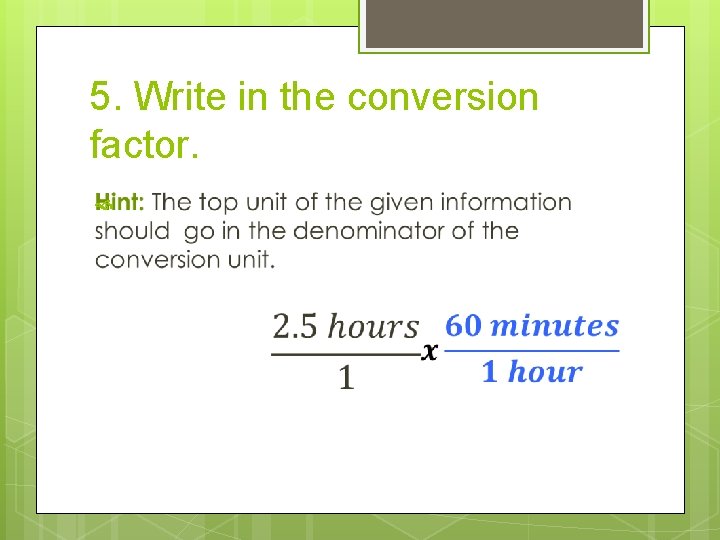
5. Write in the conversion factor.
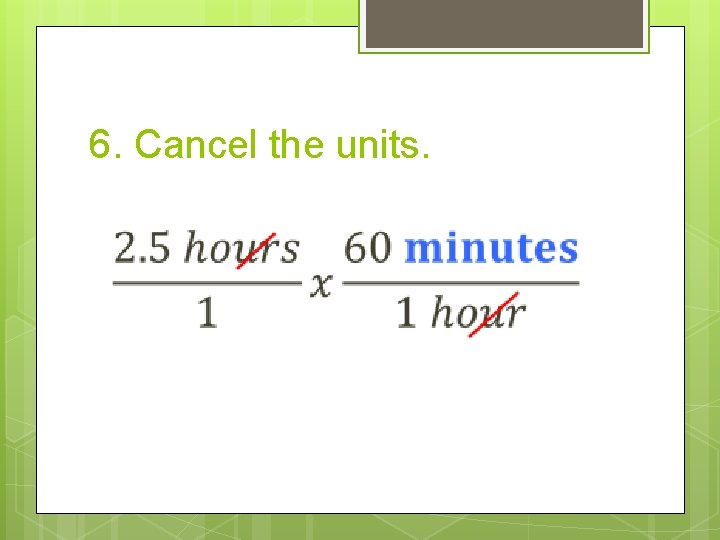
6. Cancel the units.
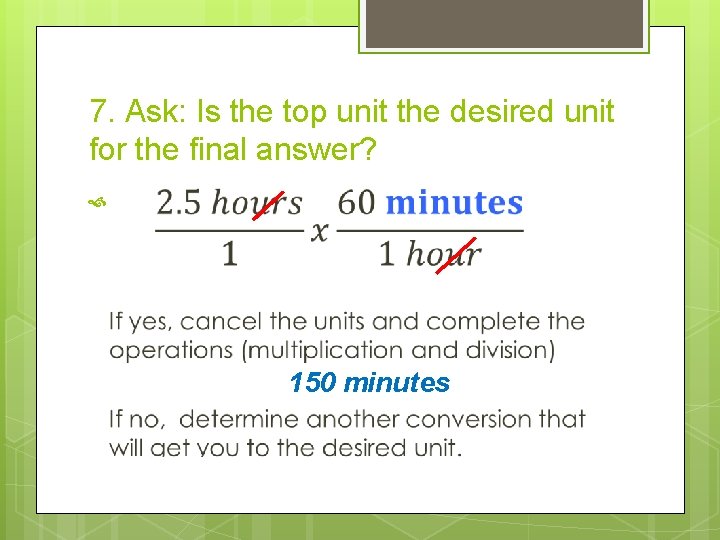
7. Ask: Is the top unit the desired unit for the final answer? 150 minutes
Step 8 Complete the necessary multiplication and division to get the final answer.
Example How many seconds are in 6 minutes?
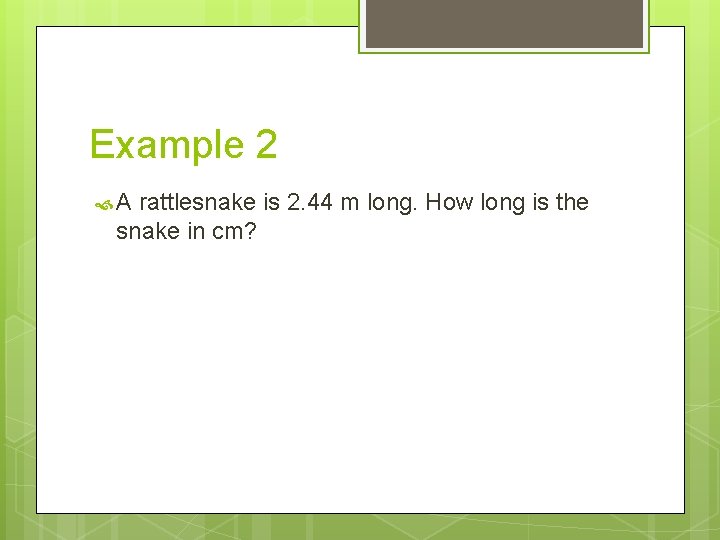
Example 2 A rattlesnake is 2. 44 m long. How long is the snake in cm?
Recording Measurement Big and Small § § Scientific notation is a way of expressing really big numbers or really small numbers. For very large and very small numbers, scientific notation is more concise.
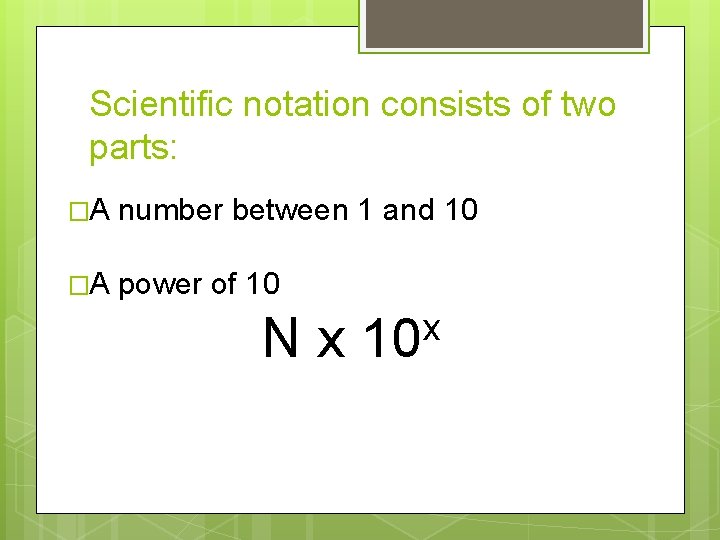
Scientific notation consists of two parts: �A number between 1 and 10 �A power of 10 x N x 10
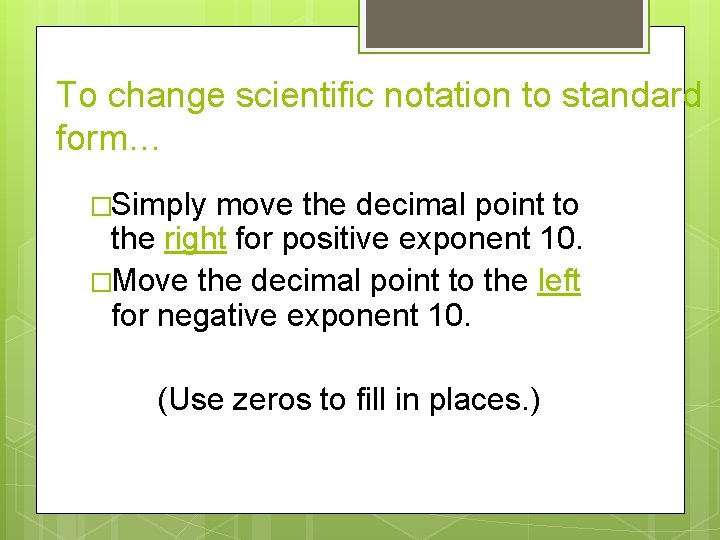
To change scientific notation to standard form… �Simply move the decimal point to the right for positive exponent 10. �Move the decimal point to the left for negative exponent 10. (Use zeros to fill in places. )
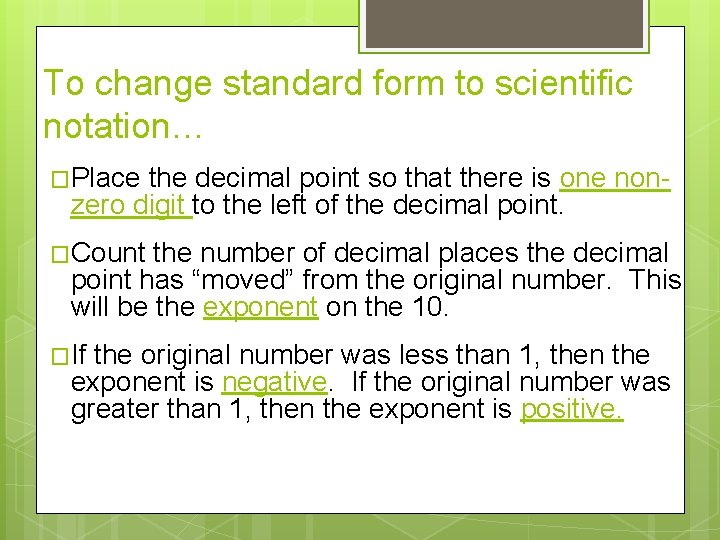
To change standard form to scientific notation… �Place the decimal point so that there is one non- zero digit to the left of the decimal point. �Count the number of decimal places the decimal point has “moved” from the original number. This will be the exponent on the 10. �If the original number was less than 1, then the exponent is negative. If the original number was greater than 1, then the exponent is positive.
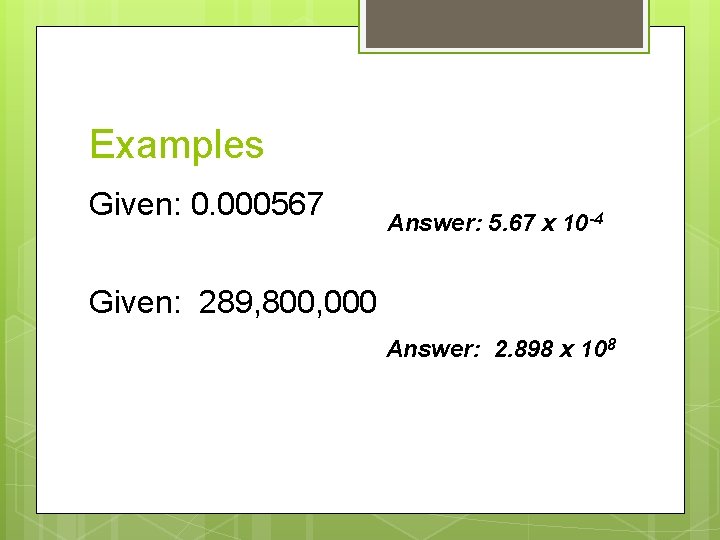
Examples Given: 0. 000567 Answer: 5. 67 x 10 -4 Given: 289, 800, 000 Answer: 2. 898 x 108
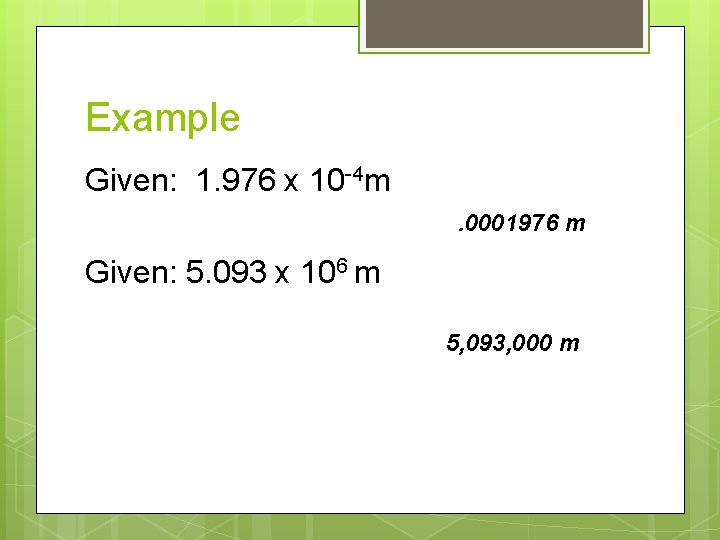
Example Given: 1. 976 x 10 -4 m. 0001976 m Given: 5. 093 x 106 m 5, 093, 000 m
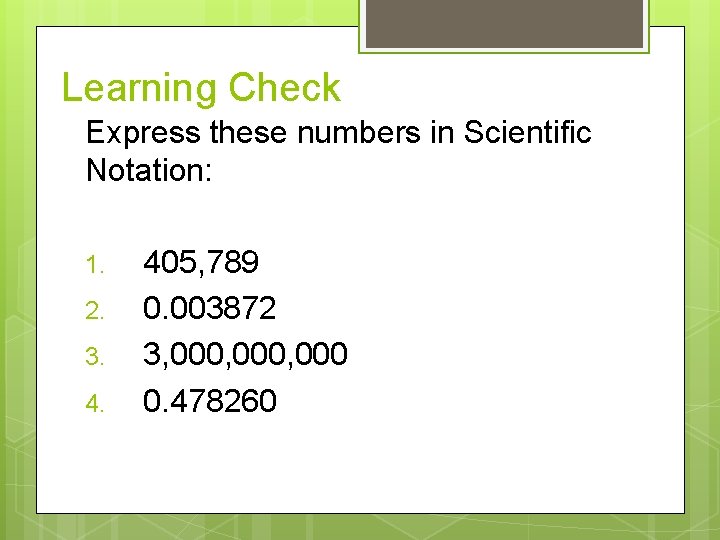
Learning Check Express these numbers in Scientific Notation: 1. 2. 3. 4. 405, 789 0. 003872 3, 000, 000 0. 478260
Accuracy and Precision What is the difference between accuracy and precision? Why is it important for a time keeping device to be accurate? http: //www. nbclearn. com/portal/site/learn/scienc e-of-the-summer-olympics
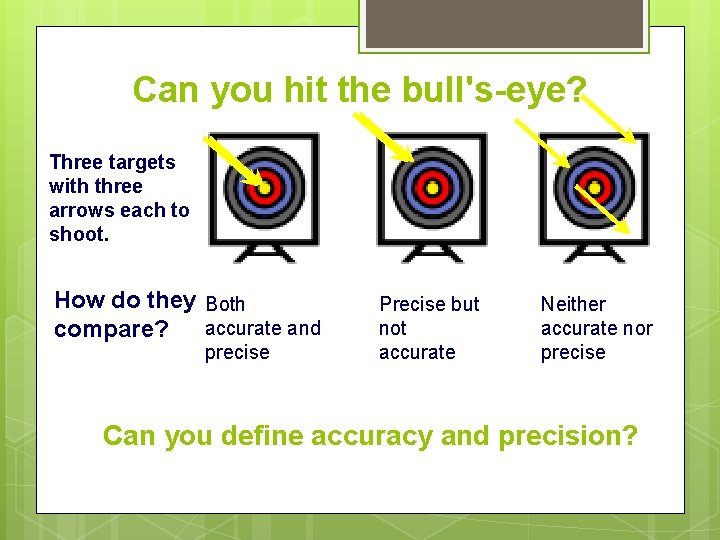
Can you hit the bull's-eye? Three targets with three arrows each to shoot. How do they Both accurate and compare? precise Precise but not accurate Neither accurate nor precise Can you define accuracy and precision?
Accuracy vs. precision Accuracy- describes how well the results of a measurement agree with an accepted value Precision- the degree of exactness of a measurement which allows for repeatability of the measurement; depends on the instrument used for measurement
Significant Figures § The numbers reported in a measurement are limited by the measuring tool § Significant figures in a measurement include the known digits plus one estimated digit
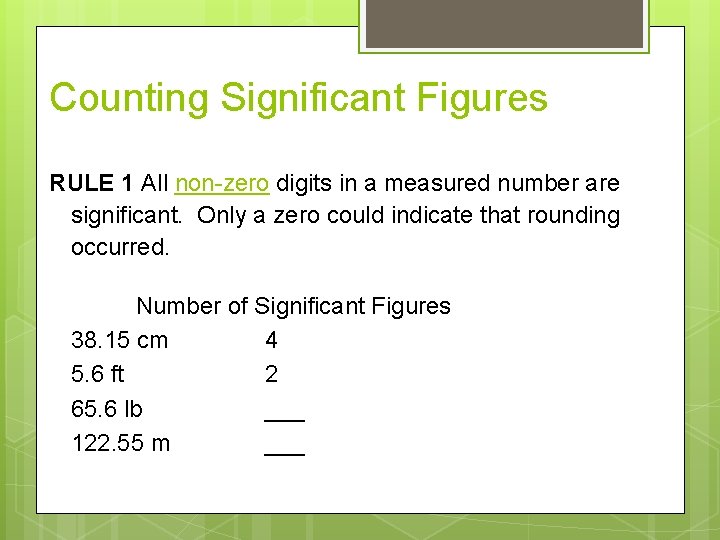
Counting Significant Figures RULE 1 All non-zero digits in a measured number are significant. Only a zero could indicate that rounding occurred. Number of Significant Figures 38. 15 cm 4 5. 6 ft 2 65. 6 lb ___ 122. 55 m ___
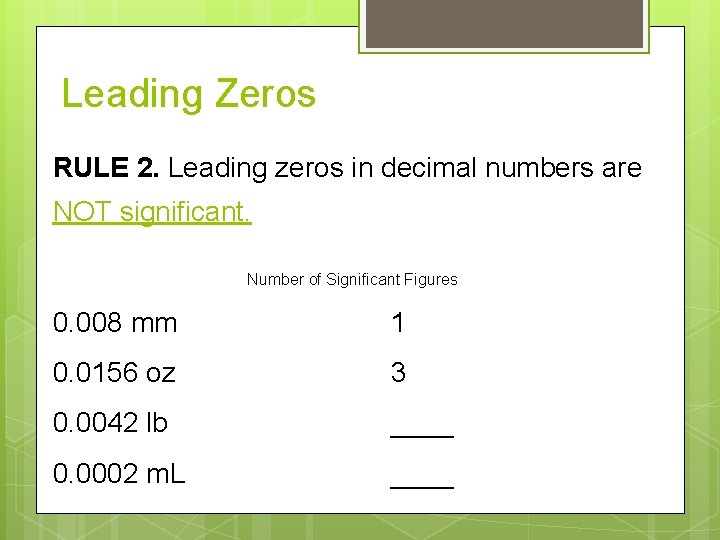
Leading Zeros RULE 2. Leading zeros in decimal numbers are NOT significant. Number of Significant Figures 0. 008 mm 1 0. 0156 oz 3 0. 0042 lb ____ 0. 0002 m. L ____
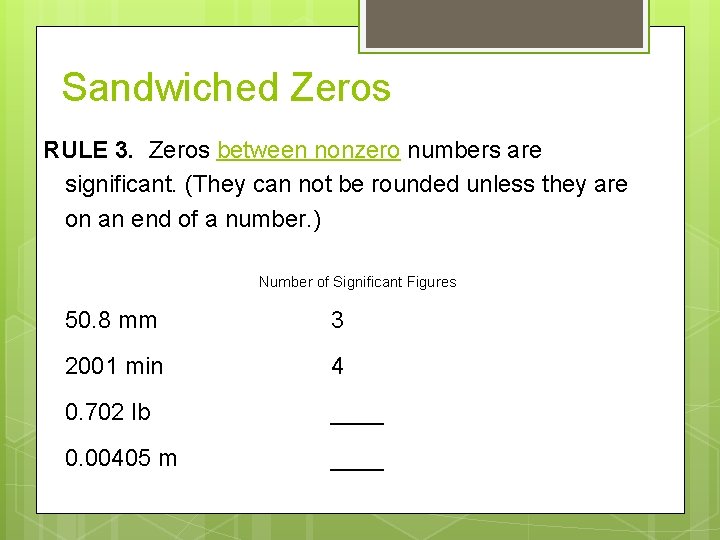
Sandwiched Zeros RULE 3. Zeros between nonzero numbers are significant. (They can not be rounded unless they are on an end of a number. ) Number of Significant Figures 50. 8 mm 3 2001 min 4 0. 702 lb ____ 0. 00405 m ____
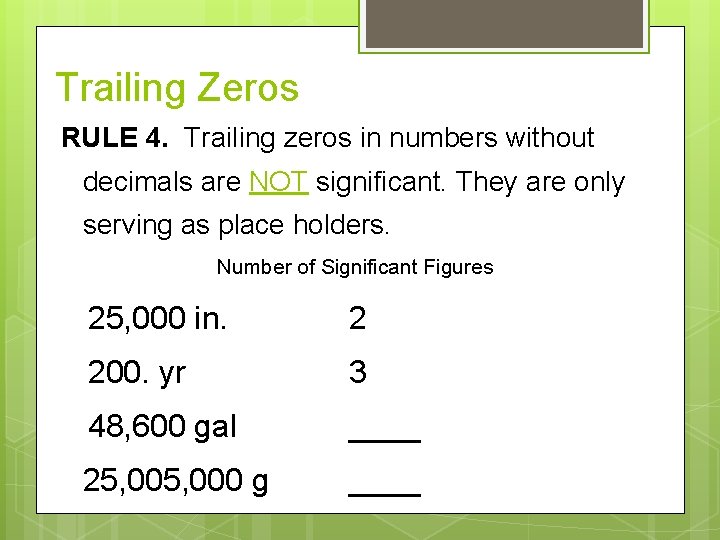
Trailing Zeros RULE 4. Trailing zeros in numbers without decimals are NOT significant. They are only serving as place holders. Number of Significant Figures 25, 000 in. 2 200. yr 3 48, 600 gal ____ 25, 000 g ____
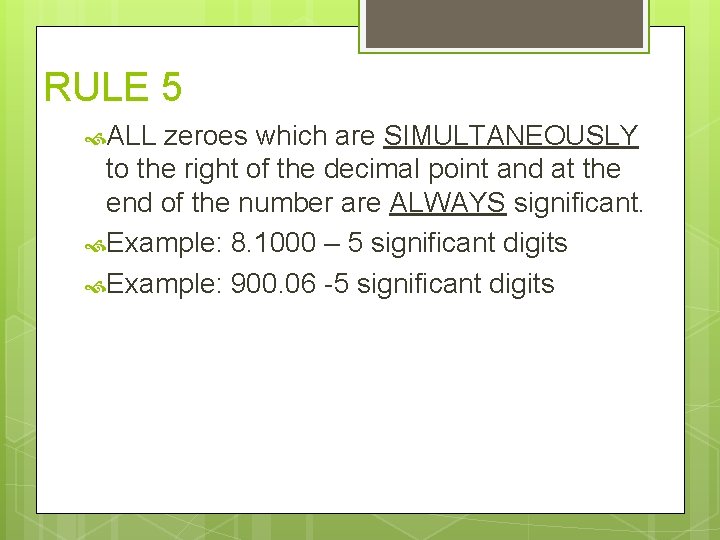
RULE 5 ALL zeroes which are SIMULTANEOUSLY to the right of the decimal point and at the end of the number are ALWAYS significant. Example: 8. 1000 – 5 significant digits Example: 900. 06 -5 significant digits
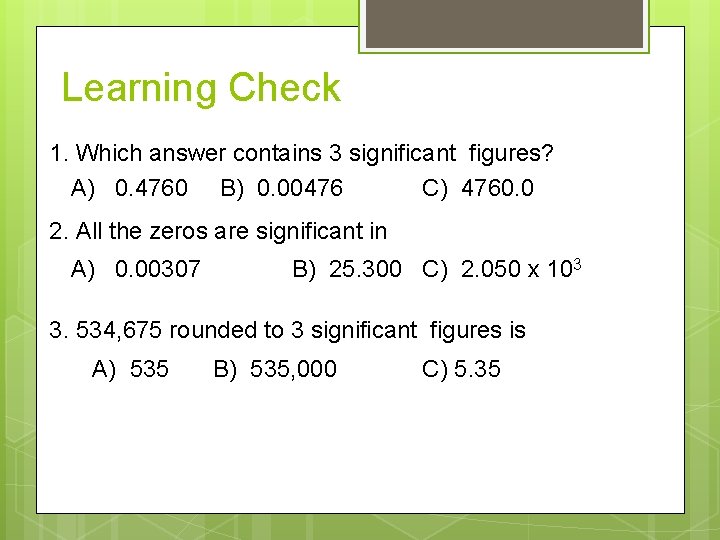
Learning Check 1. Which answer contains 3 significant figures? A) 0. 4760 B) 0. 00476 C) 4760. 0 2. All the zeros are significant in A) 0. 00307 B) 25. 300 C) 2. 050 x 103 3. 534, 675 rounded to 3 significant figures is A) 535 B) 535, 000 C) 5. 35
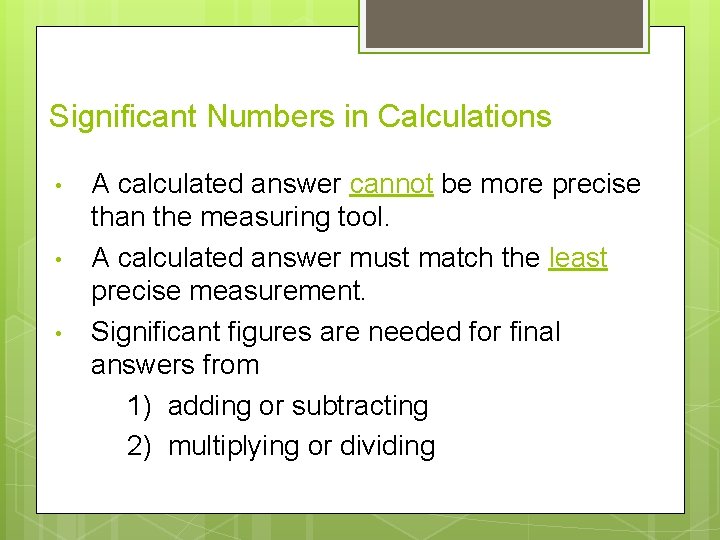
Significant Numbers in Calculations • • • A calculated answer cannot be more precise than the measuring tool. A calculated answer must match the least precise measurement. Significant figures are needed for final answers from 1) adding or subtracting 2) multiplying or dividing
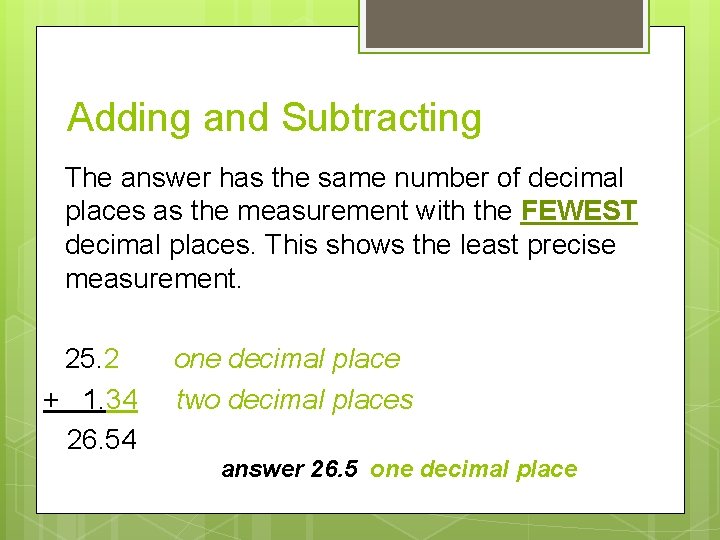
Adding and Subtracting The answer has the same number of decimal places as the measurement with the FEWEST decimal places. This shows the least precise measurement. 25. 2 one decimal place + 1. 34 two decimal places 26. 54 answer 26. 5 one decimal place
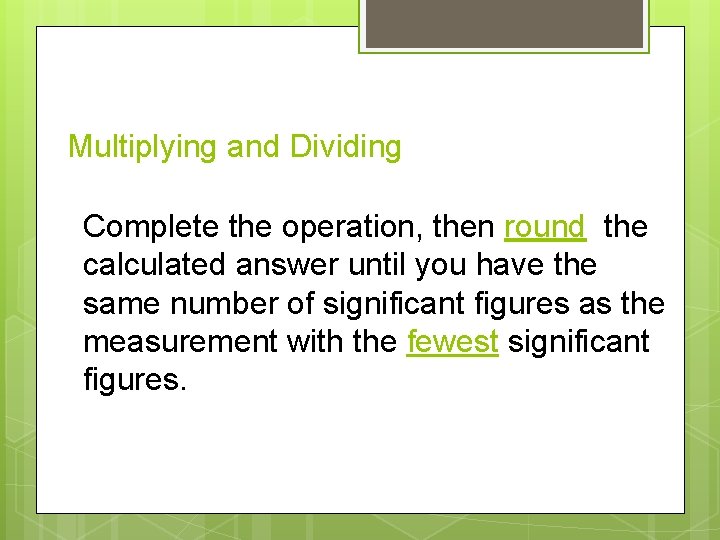
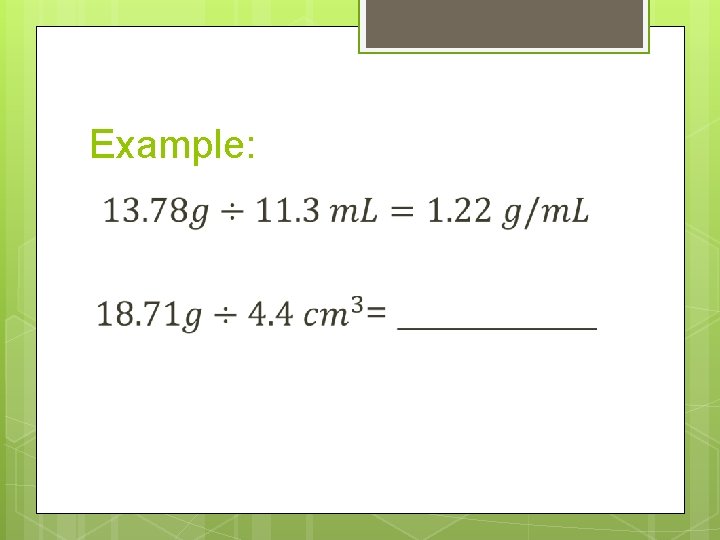
Multiplying and Dividing Complete the operation, then round the calculated answer until you have the same number of significant figures as the measurement with the fewest significant figures.
Example:
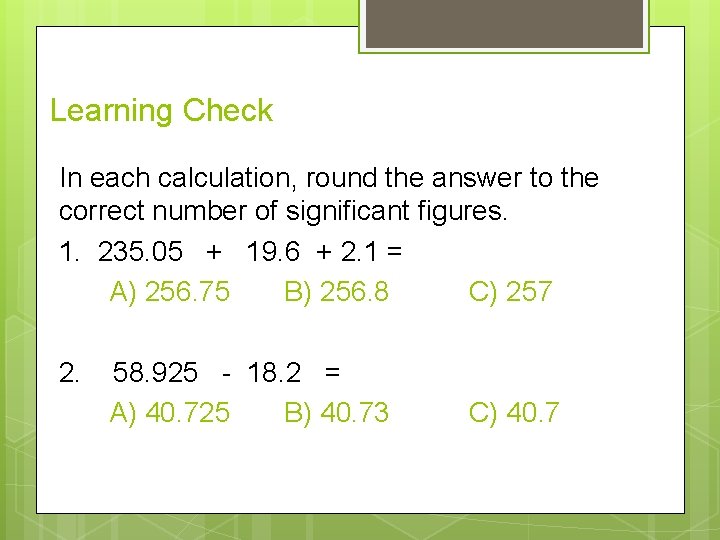
Learning Check In each calculation, round the answer to the correct number of significant figures. 1. 235. 05 + 19. 6 + 2. 1 = A) 256. 75 B) 256. 8 C) 257 2. 58. 925 - 18. 2 = A) 40. 725 B) 40. 73 C) 40. 7
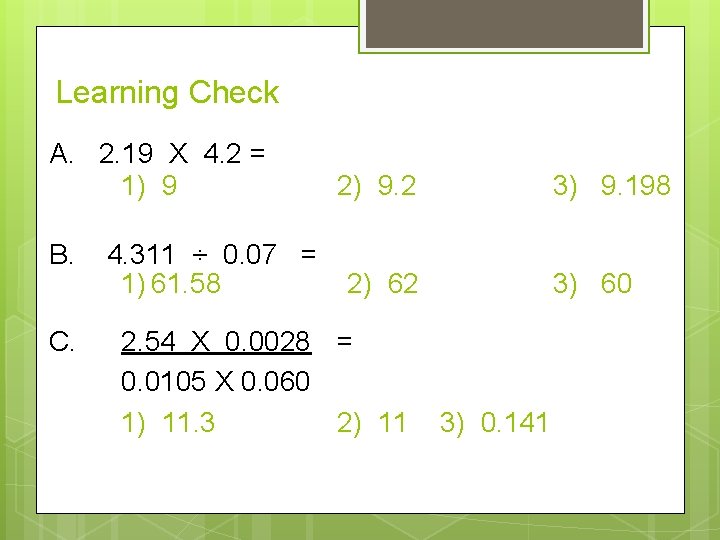
Learning Check A. 2. 19 X 4. 2 = 1) 9 2) 9. 2 B. 4. 311 ÷ 0. 07 = 2) 62 1) 61. 58 C. 2. 54 X 0. 0028 = 0. 0105 X 0. 060 1) 11. 3 2) 11 3) 0. 141 3) 9. 198 3) 60
Graphing § § A mathematical picture Graphs are used to show information quickly and simply Change one variable at a time to determine relationships Relationships we will study include linear, quadratic, and inverse
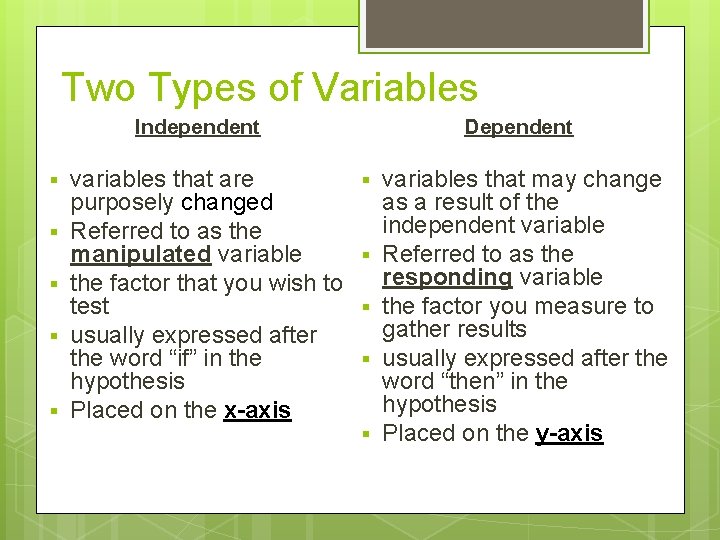
Two Types of Variables Independent § § § variables that are purposely changed Referred to as the manipulated variable the factor that you wish to test usually expressed after the word “if” in the hypothesis Placed on the x-axis Dependent § § § variables that may change as a result of the independent variable Referred to as the responding variable the factor you measure to gather results usually expressed after the word “then” in the hypothesis Placed on the y-axis
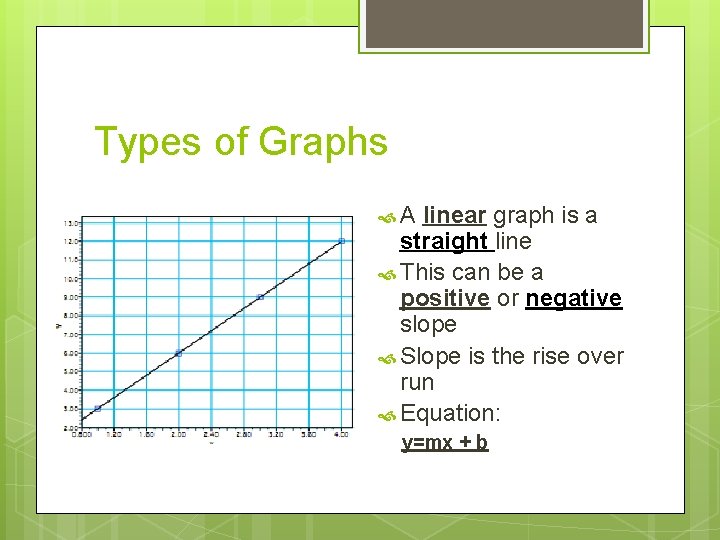
Types of Graphs A linear graph is a straight line This can be a positive or negative slope Slope is the rise over run Equation: y=mx + b
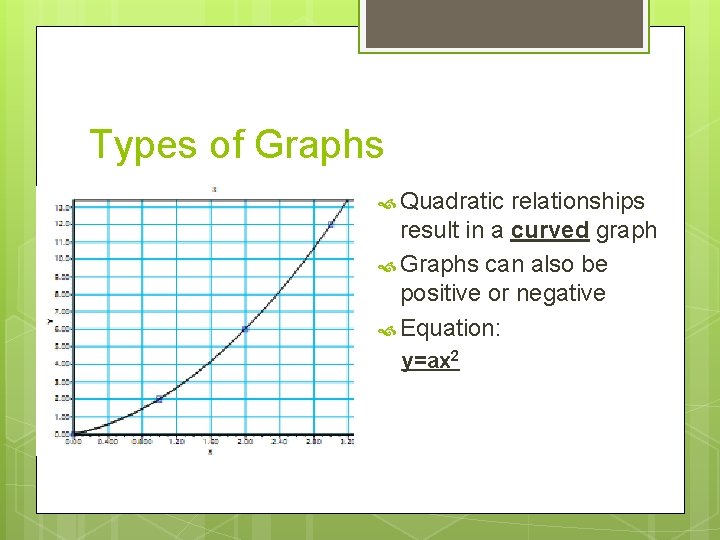
Types of Graphs Quadratic relationships result in a curved graph Graphs can also be positive or negative Equation: y=ax 2
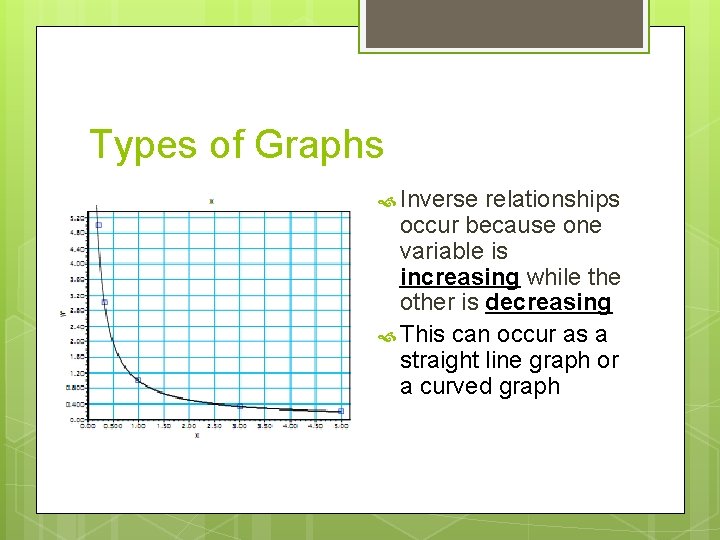
Types of Graphs Inverse relationships occur because one variable is increasing while the other is decreasing This can occur as a straight line graph or a curved graph
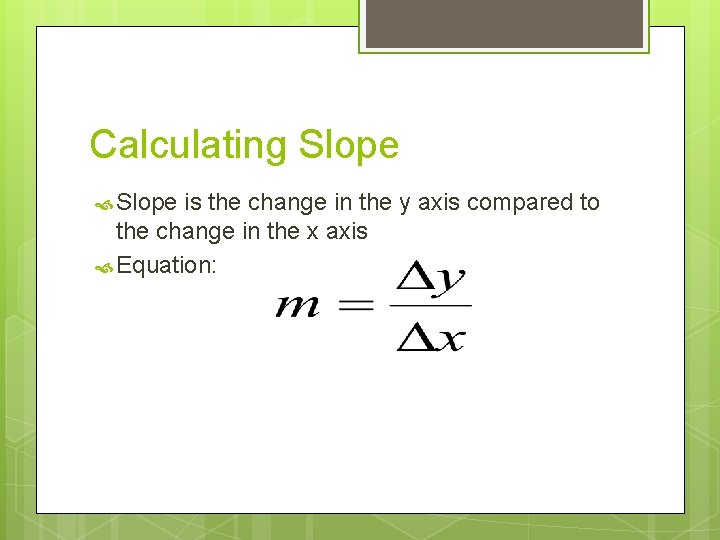
Calculating Slope is the change in the y axis compared to the change in the x axis Equation:
Graph Lab Analysis 1. 2. 3. 4. Complete 3 graphs Find the slope of the graph for Part 1 Using the graph from part 1, determine the diameter of a circular object that has a circumference of 60 cm. Are you interpolating or extrapolating? Explain. Write a summary paragraph indicating the relationship shown in each graph. Explain how the graph is a picture of each relationship, and associate an equation with graphs 1 -2.
Graphing Terms § Interpolation- making predictions for data points not collected that fall between those that were actually tested § Extrapolation- making predictions for data points not collected that are greater than those actually tested
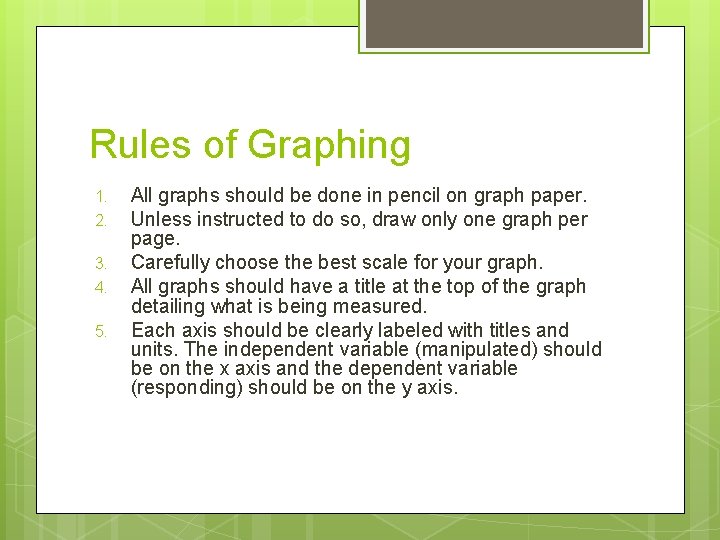
Rules of Graphing 1. 2. 3. 4. 5. All graphs should be done in pencil on graph paper. Unless instructed to do so, draw only one graph per page. Carefully choose the best scale for your graph. All graphs should have a title at the top of the graph detailing what is being measured. Each axis should be clearly labeled with titles and units. The independent variable (manipulated) should be on the x axis and the dependent variable (responding) should be on the y axis.
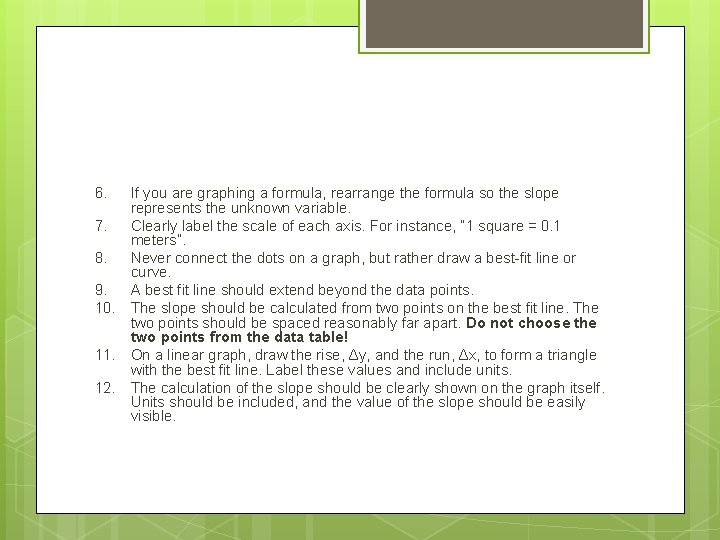
6. If you are graphing a formula, rearrange the formula so the slope represents the unknown variable. 7. Clearly label the scale of each axis. For instance, “ 1 square = 0. 1 meters”. 8. Never connect the dots on a graph, but rather draw a best-fit line or curve. 9. A best fit line should extend beyond the data points. 10. The slope should be calculated from two points on the best fit line. The two points should be spaced reasonably far apart. Do not choose the two points from the data table! 11. On a linear graph, draw the rise, Δy, and the run, Δx, to form a triangle with the best fit line. Label these values and include units. 12. The calculation of the slope should be clearly shown on the graph itself. Units should be included, and the value of the slope should be easily visible.
Bellwork Scientific Method Short Video
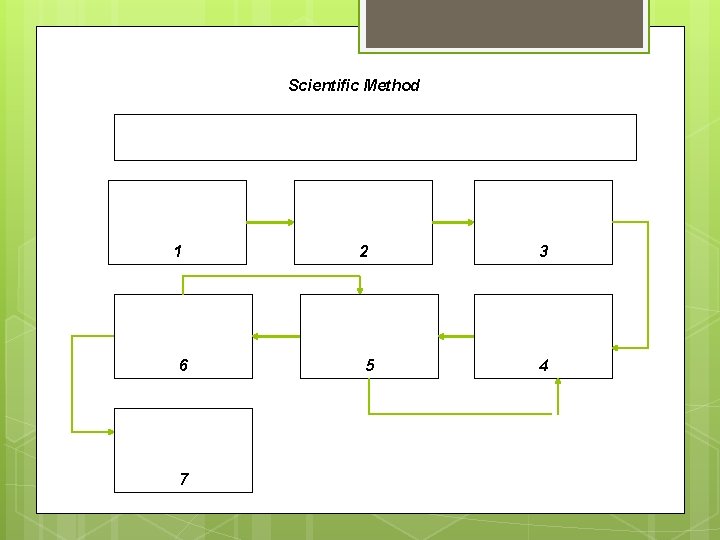
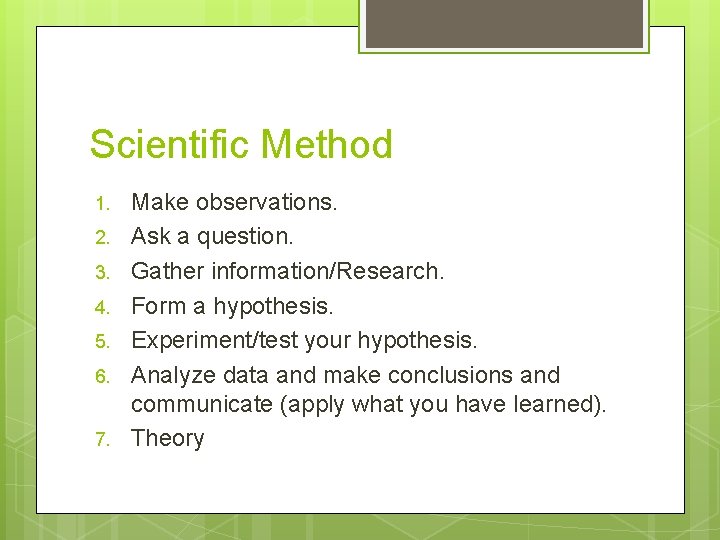
Scientific Method 1 6 7 2 5 3 4
Scientific Method 1. 2. 3. 4. 5. 6. 7. Make observations. Ask a question. Gather information/Research. Form a hypothesis. Experiment/test your hypothesis. Analyze data and make conclusions and communicate (apply what you have learned). Theory
Observations Gathered through your senses A scientist notices something in their natural world
Ask a question Observations lead to a question that you would like to have answered.
Gather Information Research should be collected in order to help you find a possible solution to the problem. For example: you might want to research salamanders, the environment in which they live, and make additional observations about the pond.
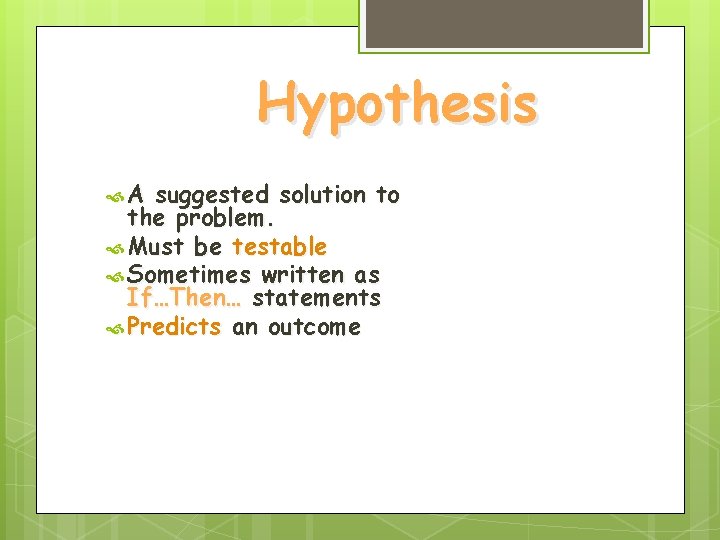
Hypothesis A suggested solution to the problem. Must be testable Sometimes written as If…Then… statements Predicts an outcome
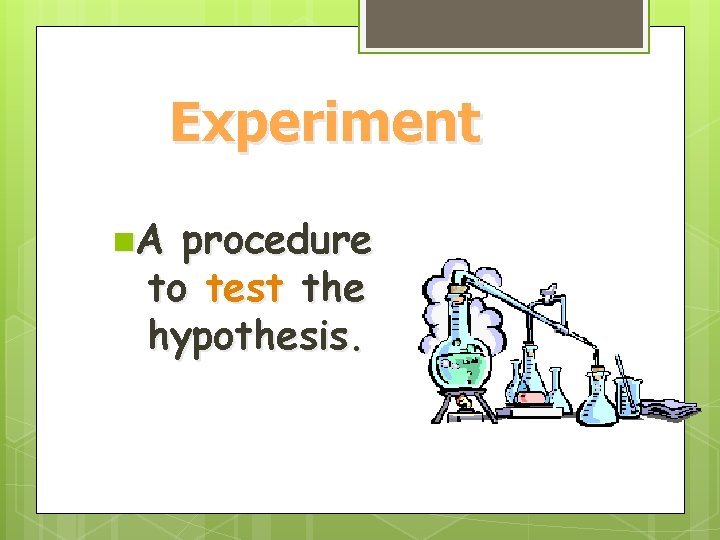
Experiment n. A procedure to test the hypothesis.
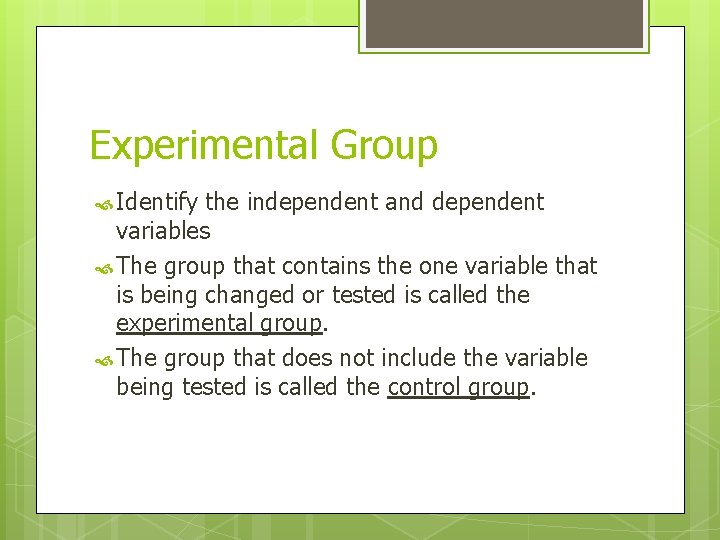
Experimental Group Identify the independent and dependent variables The group that contains the one variable that is being changed or tested is called the experimental group. The group that does not include the variable being tested is called the control group.
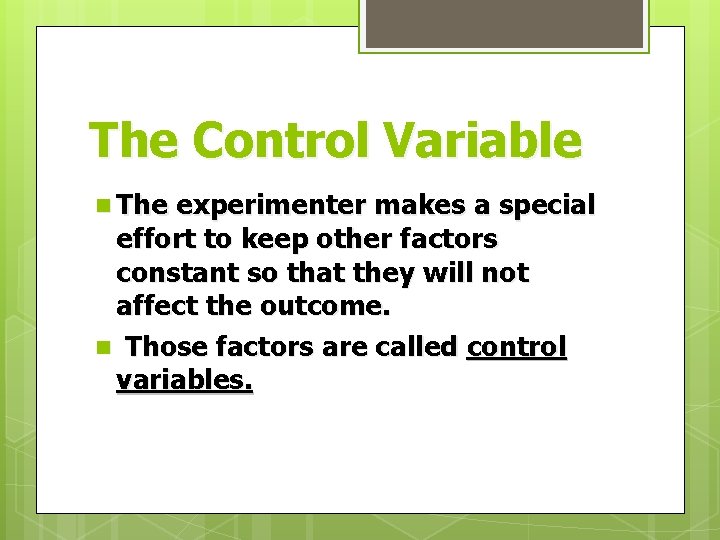
The Control Variable n The experimenter makes a special effort to keep other factors constant so that they will not affect the outcome. n Those factors are called control variables.
Analyze Data and Draw Conclusions A conclusion is a judgement based on the data obtained from the experiment
Retest In order to verify the results, experiments must be retested and hypotheses revised.
Solving a Problem 1) 2) 3) 4) 5) 6) 7) Make Observations Ask a question. Research: Gather Information about the problem Form a Hypothesis about the problem (if…then…) Design an Experiment to test the hypothesis Form a Conclusion Form a theory