PC Insurance Industry Overview Outlook Casualty Actuaries of








- Slides: 48
P/C Insurance Industry Overview & Outlook Casualty Actuaries of Greater New York May 24, 2018 James Lynch, FCAS, MAAA, Chief Actuary and Vice President, Research and Education Insurance Information Institute 110 William Street New York, NY 10038 jamesl@iii. org www. iii. org
2 Who We Are and What We Do The mission of the Insurance Information Institute is to improve public understanding of insurance—what it does and how it works. We Are… A voice for the property/casualty insurance industry. The go-to source for credible and unbiased insurance information for the media, the industry and consumers. Dedicated to ensuring the media covers our business fairly and accurately. Ready to assist our member companies with their communications, research and planning needs. We do not lobby. 2
P/C Financials, 2017 Q 4
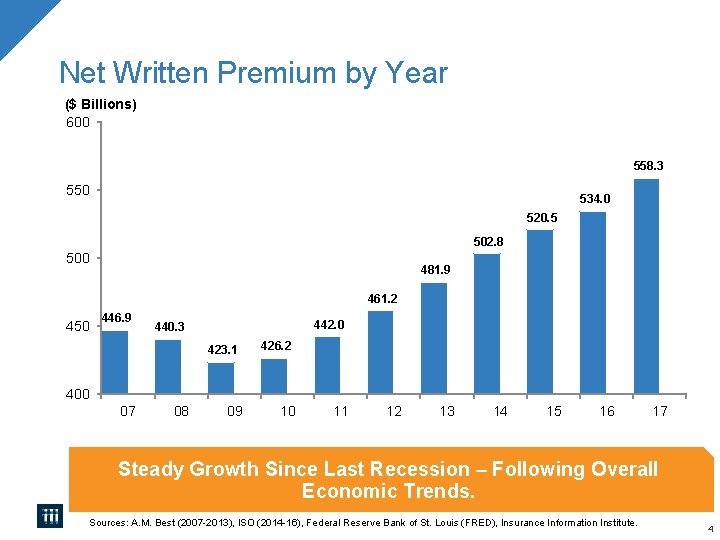
Net Written Premium by Year ($ Billions) 600 558. 3 550 534. 0 520. 5 502. 8 500 481. 9 461. 2 450 446. 9 442. 0 440. 3 423. 1 426. 2 400 07 08 09 10 11 12 13 14 15 16 17 Steady Growth Since Last Recession – Following Overall Economic Trends. Sources: A. M. Best (2007 -2013), ISO (2014 -16), Federal Reserve Bank of St. Louis (FRED), Insurance Information Institute. 4
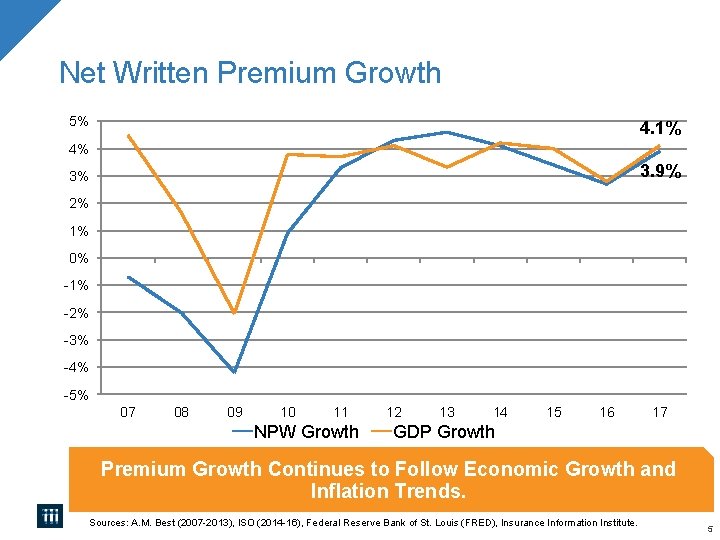
Net Written Premium Growth 5% 4. 1% 4% 3. 9% 3% 2% 1% 0% -1% -2% -3% -4% -5% 07 08 09 10 11 NPW Growth 12 13 14 15 16 17 GDP Growth Premium Growth Continues to Follow Economic Growth and Inflation Trends. Sources: A. M. Best (2007 -2013), ISO (2014 -16), Federal Reserve Bank of St. Louis (FRED), Insurance Information Institute. 5
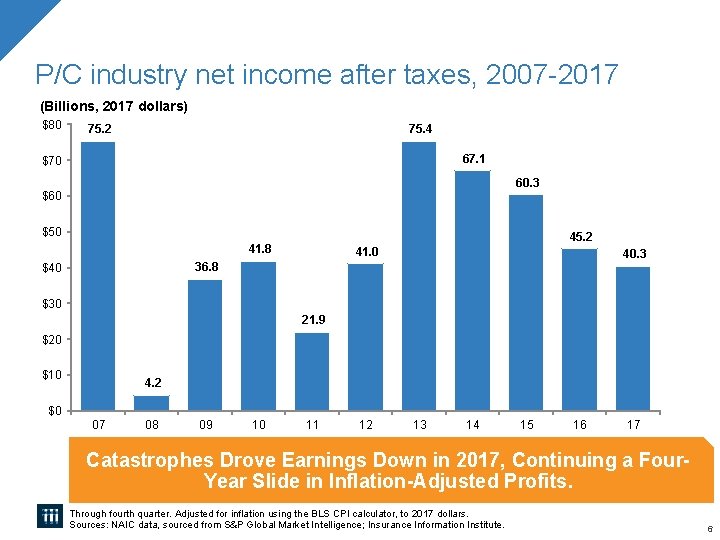
P/C industry net income after taxes, 2007 -2017 (Billions, 2017 dollars) $80 75. 4 75. 2 67. 1 $70 60. 3 $60 $50 45. 2 41. 8 41. 0 40. 3 36. 8 $40 $30 21. 9 $20 $10 4. 2 $0 07 08 09 10 11 12 13 14 15 16 17 Catastrophes Drove Earnings Down in 2017, Continuing a Four. Year Slide in Inflation-Adjusted Profits. Through fourth quarter. Adjusted for inflation using the BLS CPI calculator, to 2017 dollars. Sources: NAIC data, sourced from S&P Global Market Intelligence; Insurance Information Institute. 6
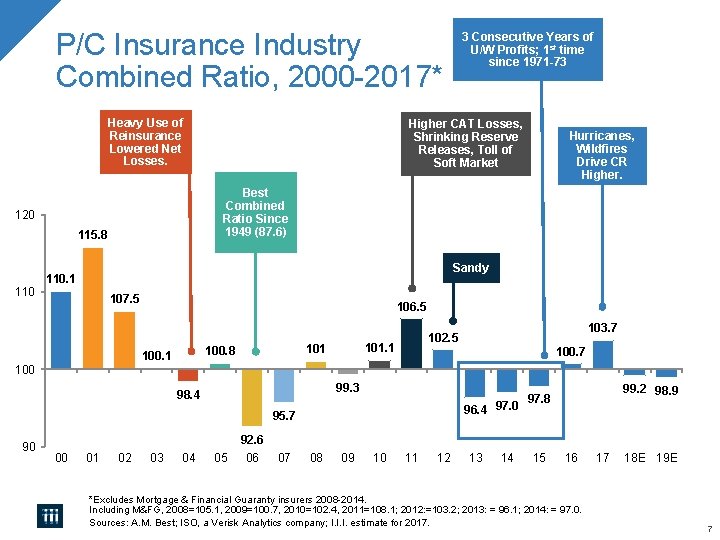
P/C Insurance Industry Combined Ratio, 2000 -2017* Heavy Use of Reinsurance Lowered Net Losses. 3 Consecutive Years of U/W Profits; 1 st time since 1971 -73 Higher CAT Losses, Shrinking Reserve Releases, Toll of Soft Market Hurricanes, Wildfires Drive CR Higher. Best Combined Ratio Since 1949 (87. 6) 120 115. 8 Sandy 110. 1 110 107. 5 106. 5 101. 1 100. 8 100. 1 103. 7 102. 5 100. 7 100 99. 3 98. 4 96. 4 97. 0 95. 7 90 99. 2 98. 9 97. 8 92. 6 00 01 02 03 04 05 06 07 08 09 10 11 12 13 14 15 16 *Excludes Mortgage & Financial Guaranty insurers 2008 -2014. Including M&FG, 2008=105. 1, 2009=100. 7, 2010=102. 4, 2011=108. 1; 2012: =103. 2; 2013: = 96. 1; 2014: = 97. 0. Sources: A. M. Best; ISO, a Verisk Analytics company; I. I. I. estimate for 2017. 17 18 E 19 E 7
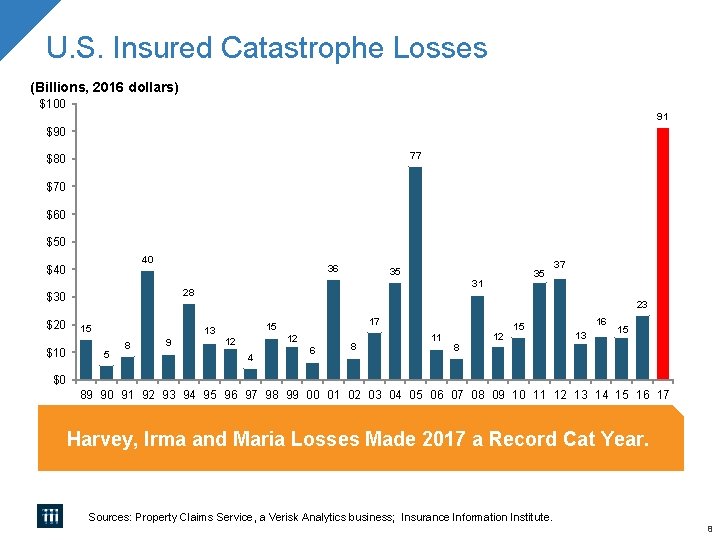
U. S. Insured Catastrophe Losses (Billions, 2016 dollars) $100 91 $90 77 $80 $70 $60 $50 40 $40 36 $10 35 31 28 $30 $20 35 37 23 15 13 5 8 9 17 15 12 12 4 6 8 11 8 12 15 16 13 15 $0 89 90 91 92 93 94 95 96 97 98 99 00 01 02 03 04 05 06 07 08 09 10 11 12 13 14 15 16 17 Harvey, Irma and Maria Losses Made 2017 a Record Cat Year. Sources: Property Claims Service, a Verisk Analytics business; Insurance Information Institute. 8
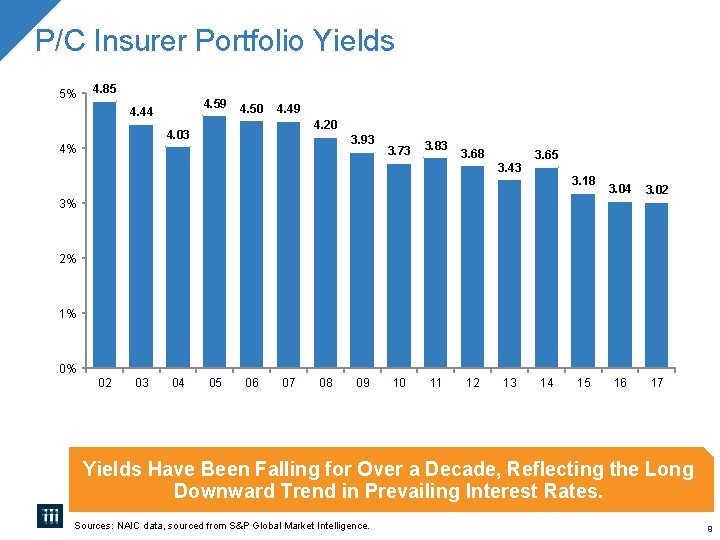
P/C Insurer Portfolio Yields 5% 4. 85 4. 59 4. 44 4. 50 4. 49 4. 20 4. 03 3. 93 4% 3. 73 3. 83 3. 68 3. 43 3. 65 3. 18 3. 04 3. 02 16 17 3% 2% 1% 0% 02 03 04 05 06 07 08 09 10 11 12 13 14 15 Yields Have Been Falling for Over a Decade, Reflecting the Long Downward Trend in Prevailing Interest Rates. Sources: NAIC data, sourced from S&P Global Market Intelligence. 9
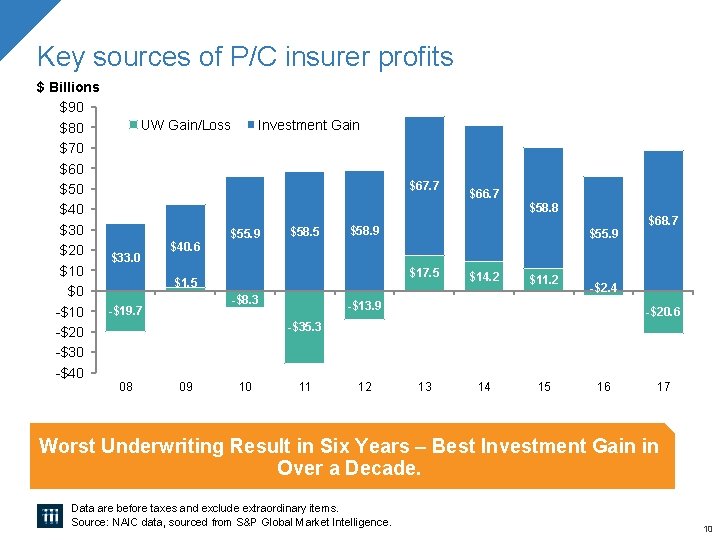
Key sources of P/C insurer profits $ Billions $90 UW Gain/Loss Investment Gain $80 $70 $60 $50 $40 $30 $58. 9 $58. 5 $55. 9 $40. 6 $20 $33. 0 $1. 5 $0 -$8. 3 -$13. 9 -$19. 7 -$10 -$35. 3 -$20 -$30 -$40 08 09 10 11 12 $67. 7 $66. 7 $58. 8 $55. 9 $17. 5 $14. 2 $11. 2 $68. 7 -$2. 4 -$20. 6 13 14 15 16 17 Worst Underwriting Result in Six Years – Best Investment Gain in Over a Decade. Data are before taxes and exclude extraordinary items. Source: NAIC data, sourced from S&P Global Market Intelligence. 10
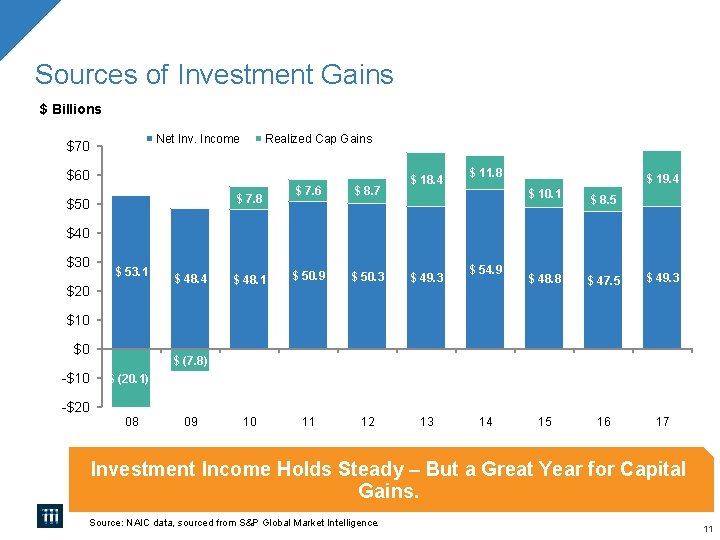
Sources of Investment Gains $ Billions Net Inv. Income $70 Realized Cap Gains $60 $ 7. 6 $ 8. 7 $ 48. 1 $ 50. 9 $ 50. 3 $ 49. 3 10 11 12 13 $ 7. 8 $50 $ 18. 4 $ 11. 8 $ 19. 4 $ 10. 1 $ 8. 5 $40 $30 $ 53. 1 $20 $ 48. 4 $ 54. 9 $ 48. 8 $ 47. 5 $ 49. 3 15 16 17 $10 $0 -$10 -$20 $ (7. 8) $ (20. 1) 08 09 14 Investment Income Holds Steady – But a Great Year for Capital Gains. Source: NAIC data, sourced from S&P Global Market Intelligence. 11
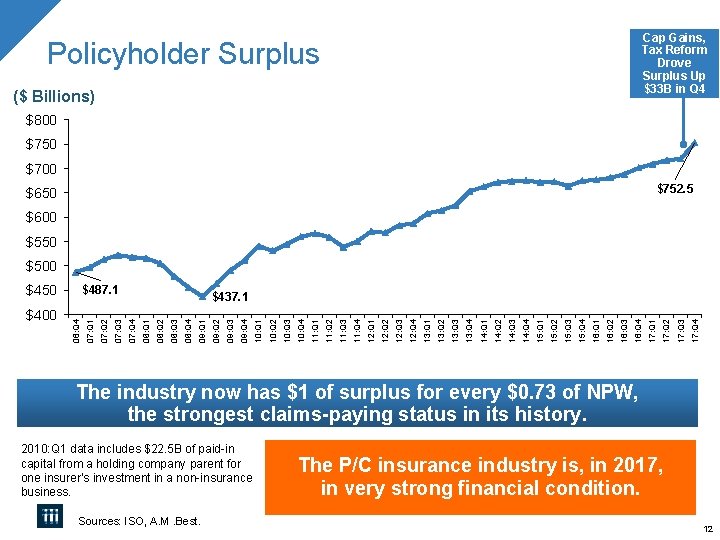
Cap Gains, Tax Reform Drove Surplus Up $33 B in Q 4 Policyholder Surplus ($ Billions) $800 $750 $700 $752. 5 $650 $600 $550 $500 17: Q 4 17: Q 3 17: Q 2 17: Q 1 16: Q 4 16: Q 3 16: Q 2 16: Q 1 15: Q 4 15: Q 3 15: Q 2 15: Q 1 14: Q 4 14: Q 3 14: Q 2 13: Q 4 14: Q 1 13: Q 3 13: Q 2 13: Q 1 12: Q 4 12: Q 3 12: Q 2 12: Q 1 11: Q 4 11: Q 3 11: Q 1 11: Q 2 10: Q 3 10: Q 4 10: Q 2 10: Q 1 09: Q 3 09: Q 4 09: Q 1 09: Q 2 08: Q 4 08: Q 3 08: Q 2 08: Q 1 $437. 1 07: Q 4 07: Q 3 07: Q 2 06: Q 4 $400 07: Q 1 $487. 1 $450 The industry now has $1 of surplus for every $0. 73 of NPW, the strongest claims-paying status in its history. 2010: Q 1 data includes $22. 5 B of paid-in capital from a holding company parent for one insurer’s investment in a non-insurance business. Sources: ISO, A. M. Best. The P/C insurance industry is, in 2017, in very strong financial condition. 12
Commercial Rates
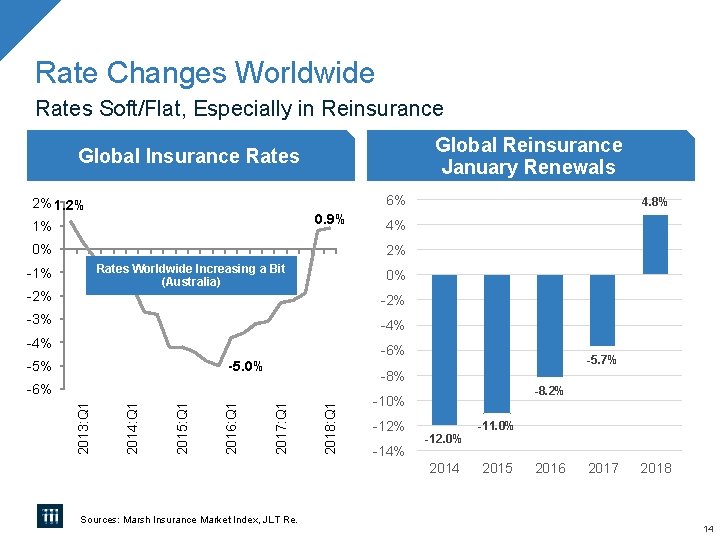
Rate Changes Worldwide Rates Soft/Flat, Especially in Reinsurance Global Reinsurance January Renewals Global Insurance Rates 6% 2% 1. 2% 0. 9% 1% 0% 4. 8% 4% 2% Rates Worldwide Increasing a Bit (Australia) -1% -2% 0% -2% -3% -4% -5% -6% -5. 0% -8% 2018: Q 1 2017: Q 1 2016: Q 1 2015: Q 1 2014: Q 1 -6% 2013: Q 1 -5. 7% -8. 2% -10% -12% -14% -12. 0% 2014 Sources: Marsh Insurance Market Index, JLT Re. -11. 0% 2015 2016 2017 2018 14
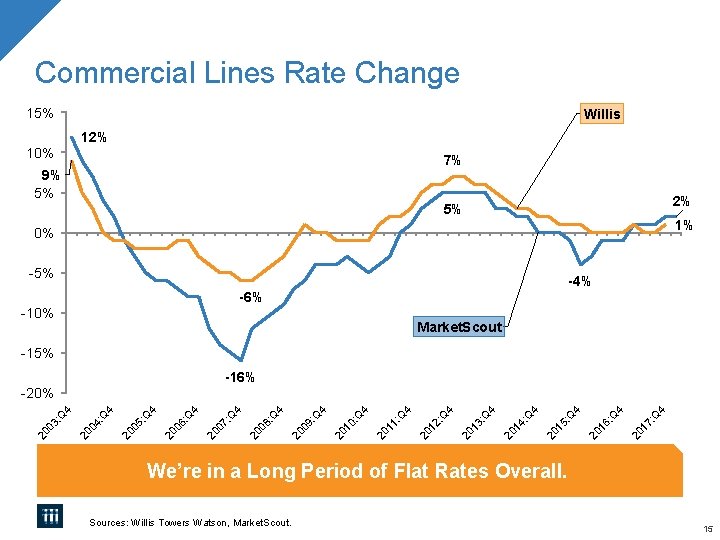
Commercial Lines Rate Change 15% Willis 12% 10% 7% 9% 5% 2% 5% 1% 0% -5% -4% -6% -10% Market. Scout -15% -16% 20 1 7: Q 4 4 Q 6: 20 1 5: Q 4 4 Q 4: 20 1 4 Q 3: 20 1 4 Q 2: 20 1 4 Q 1: 20 1 0: Q 4 4 9: 20 0 8: Q Q 4 4 Q 7: 20 0 6: Q 4 4 Q 5: 20 0 4 Q 4: 20 0 3: Q 4 -20% We’re in a Long Period of Flat Rates Overall. Sources: Willis Towers Watson, Market. Scout. 15
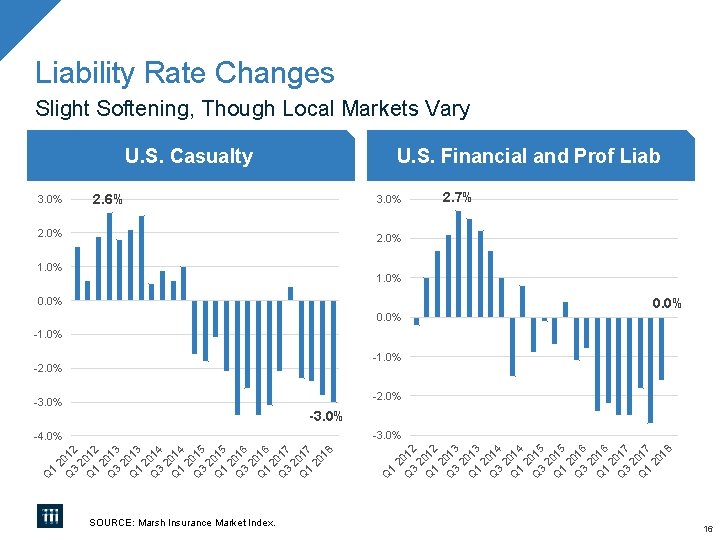
Liability Rate Changes Slight Softening, Though Local Markets Vary U. S. Casualty 3. 0% U. S. Financial and Prof Liab 2. 6% 3. 0% 2. 7% 2. 0% 1. 0% 0. 0% -1. 0% -2. 0% -3. 0% Q 1 2 Q 012 3 2 Q 012 1 2 Q 013 3 2 Q 013 1 2 Q 014 3 2 Q 014 1 2 Q 015 3 2 Q 015 1 2 Q 016 3 2 Q 016 1 2 Q 017 3 2 Q 017 1 20 18 SOURCE: Marsh Insurance Market Index. Q 1 2 Q 012 3 2 Q 012 1 2 Q 013 3 2 Q 013 1 2 Q 014 3 2 Q 014 1 2 Q 015 3 2 Q 015 1 2 Q 016 3 2 Q 016 1 2 Q 017 3 2 Q 017 1 20 18 -3. 0% -4. 0% 16
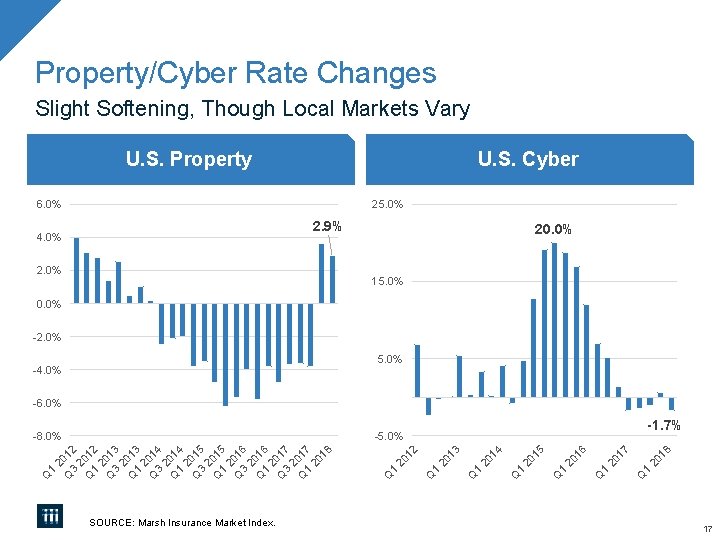
Property/Cyber Rate Changes Slight Softening, Though Local Markets Vary U. S. Property U. S. Cyber 6. 0% 25. 0% 2. 9% 4. 0% 20. 0% 15. 0% 0. 0% -2. 0% 5. 0% -4. 0% -6. 0% -1. 7% Q 1 20 18 17 20 Q 1 16 20 Q 1 15 20 Q 1 20 14 13 20 Q 1 Q 1 2 Q 012 3 2 Q 012 1 2 Q 013 3 2 Q 013 1 2 Q 014 3 2 Q 014 1 2 Q 015 3 2 Q 015 1 2 Q 016 3 2 Q 016 1 2 Q 017 3 2 Q 017 1 20 18 SOURCE: Marsh Insurance Market Index. 12 -5. 0% -8. 0% 17
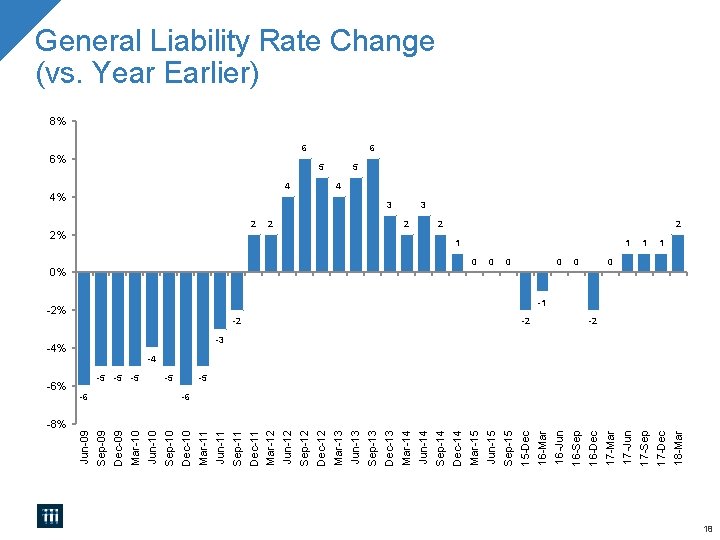
-8% 0 -1 -2 -3 -4 -5 -6 2 1 18 -Mar 1 17 -Dec 0 1 17 -Sep 1 17 -Jun 17 -Mar -2 16 -Dec 0 16 -Sep 0 16 -Jun 16 -Mar -2 15 -Dec 0 Sep-15 0 Jun-15 0% Mar-15 Dec-14 2 Sep-14 3 Jun-14 2 Mar-14 Dec-13 6 Sep-13 5 Jun-13 4 Mar-13 Dec-12 6% Sep-12 4% Jun-12 2 Mar-12 2% Dec-11 -2% Sep-11 Jun-11 -5 Mar-11 -6 Dec-10 -5 -5 -5 Sep-10 -4% Jun-10 Mar-10 Dec-09 Sep-09 -6% Jun-09 General Liability Rate Change (vs. Year Earlier) 8% 6 5 4 3 2 18
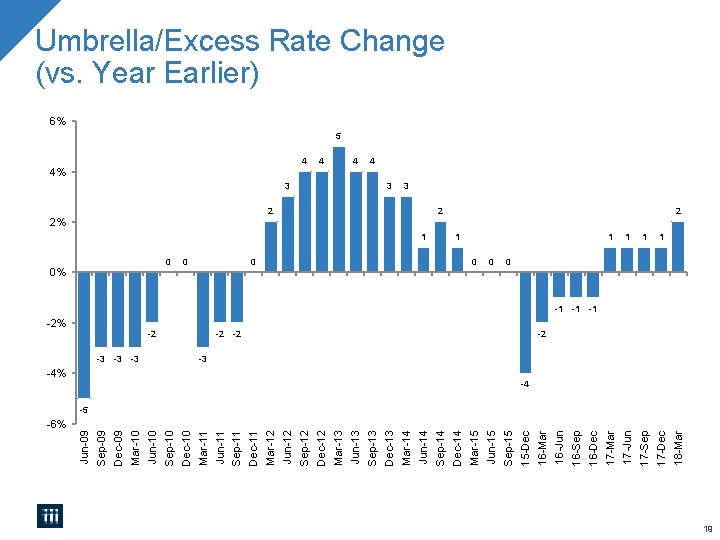
-6% -2 -3 -4 -5 2 1 18 -Mar 1 17 -Dec -1 -1 -1 1 17 -Sep 0 1 17 -Jun 1 17 -Mar 16 -Dec 16 -Sep 16 -Jun -2 -2 16 -Mar -4% 15 -Dec 0 Sep-15 0 Jun-15 0 Mar-15 1 Dec-14 2 Sep-14 Jun-14 3 Mar-14 3 Dec-13 4 Sep-13 4 Jun-13 Mar-13 4 Dec-12 4% Sep-12 Jun-12 2% Mar-12 0 Dec-11 Sep-11 -2 Jun-11 -3 -3 -3 Mar-11 0 Dec-10 0% Sep-10 -2% Jun-10 Mar-10 Dec-09 Sep-09 Jun-09 Umbrella/Excess Rate Change (vs. Year Earlier) 6% 5 4 3 2 19
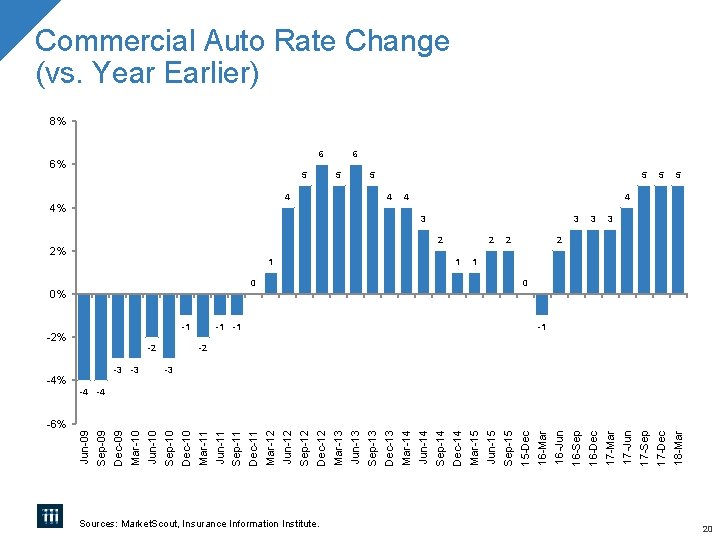
-6% Sources: Market. Scout, Insurance Information Institute. 2 1 0 -1 -2 -3 -4 -4 4 3 5 5 18 -Mar 4 5 17 -Dec 5 17 -Sep 17 -Jun 3 17 -Mar 2 3 16 -Dec 3 16 -Sep 16 -Jun -1 -1 16 -Mar 0 15 -Dec 2 Sep-15 2 Jun-15 1 Mar-15 1 Dec-14 Sep-14 Jun-14 4 Mar-14 4 Dec-13 5 Sep-13 6 Jun-13 5 Mar-13 Dec-12 6% Sep-12 4% Jun-12 2% Mar-12 0% Dec-11 Sep-11 -1 Jun-11 -2 Mar-11 Dec-10 -3 -3 Sep-10 -2% Jun-10 Mar-10 Dec-09 Sep-09 -4% Jun-09 Commercial Auto Rate Change (vs. Year Earlier) 8% 6 20
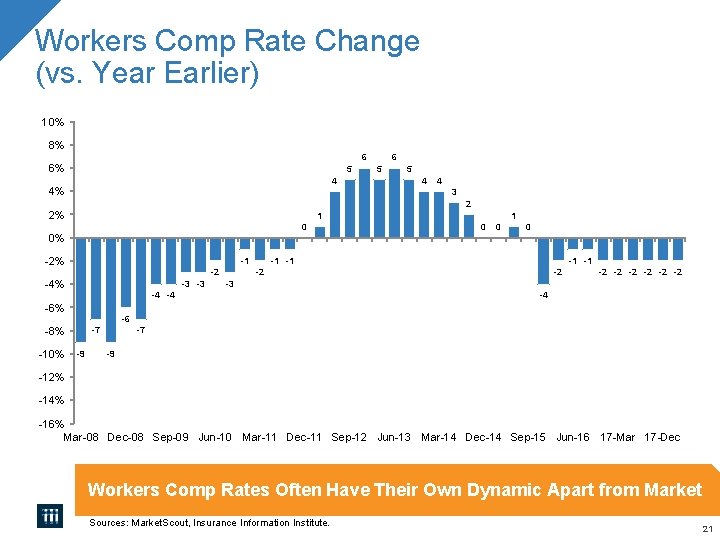
Workers Comp Rate Change (vs. Year Earlier) 10% 8% 6 6% 5 4 4 3 2 2% 1 0 0% -2% -1 -2 -4% -3 -3 1 0 0 0 -1 -1 -2 -2 -3 -4 -4 -6% -4 -6 -8% -10% 6 5 -7 -9 -12% -14% -16% Mar-08 Dec-08 Sep-09 Jun-10 Mar-11 Dec-11 Sep-12 Jun-13 Mar-14 Dec-14 Sep-15 Jun-16 17 -Mar 17 -Dec Workers Comp Rates Often Have Their Own Dynamic Apart from Market Sources: Market. Scout, Insurance Information Institute. 21
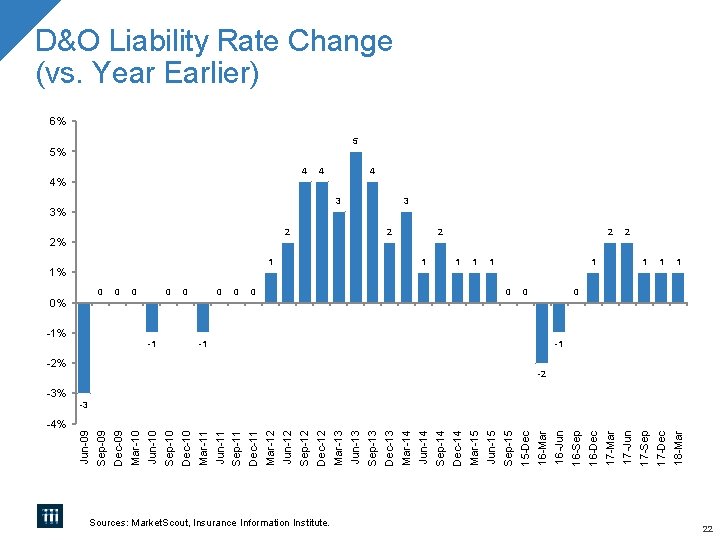
-4% Sources: Market. Scout, Insurance Information Institute. -1 -2 -3 1 1 18 -Mar 0 1 17 -Dec 1 17 -Sep 2 17 -Jun 2 17 -Mar 1 16 -Dec 0 16 -Sep -1 16 -Jun -2% 16 -Mar 0 15 -Dec 0 Sep-15 1 Jun-15 1 Mar-15 1 Dec-14 2 Sep-14 1 Jun-14 3 Mar-14 2 Dec-13 4 Sep-13 5% Jun-13 3% Mar-13 4 Dec-12 4% Sep-12 2% Jun-12 1% Mar-12 0 Dec-11 0 Sep-11 0 Jun-11 -1 Mar-11 0 Dec-10 0 Sep-10 -1% Jun-10 0 Mar-10 0 Dec-09 0% Sep-09 -3% Jun-09 D&O Liability Rate Change (vs. Year Earlier) 6% 5 4 3 2 22
Hard Market/Soft Market
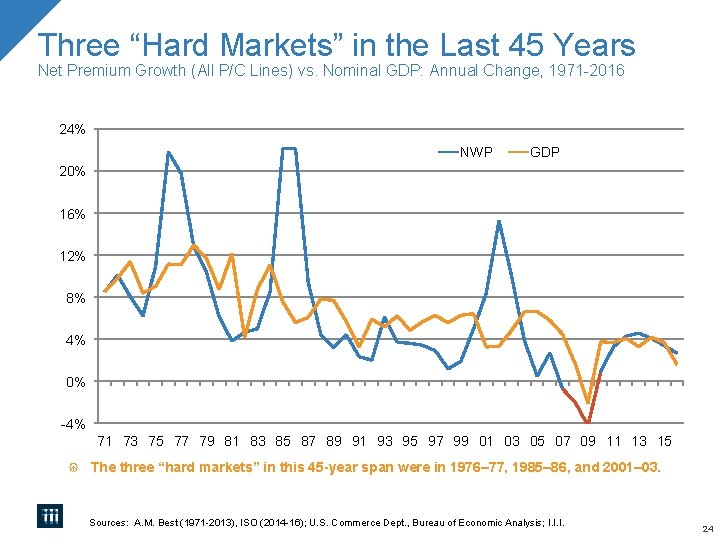
Three “Hard Markets” in the Last 45 Years Net Premium Growth (All P/C Lines) vs. Nominal GDP: Annual Change, 1971 -2016 24% NWP GDP 20% 16% 12% 8% 4% 0% -4% 71 73 75 77 79 81 83 85 87 89 91 93 95 97 99 01 03 05 07 09 11 13 15 The three “hard markets” in this 45 -year span were in 1976– 77, 1985– 86, and 2001– 03. Sources: A. M. Best (1971 -2013), ISO (2014 -16); U. S. Commerce Dept. , Bureau of Economic Analysis; I. I. I. 24
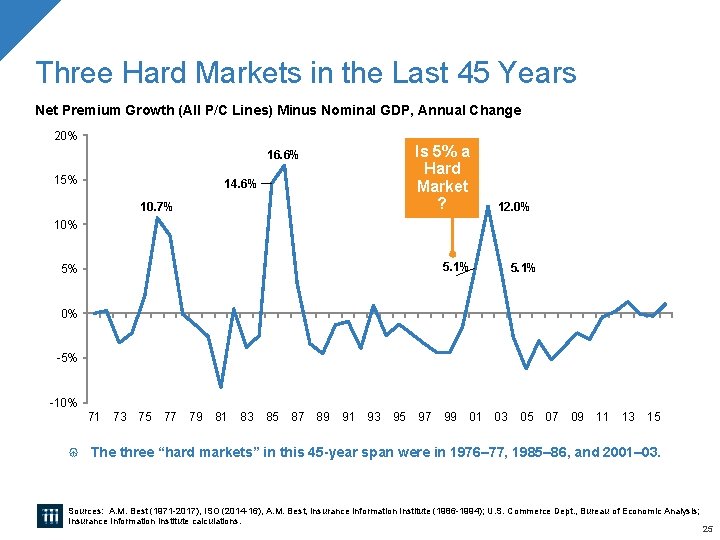
Three Hard Markets in the Last 45 Years Net Premium Growth (All P/C Lines) Minus Nominal GDP, Annual Change 20% Is 5% a Hard Market ? 16. 6% 15% 14. 6% 10. 7% 12. 0% 10% 5. 1% 5% 5. 1% 0% -5% -10% 71 73 75 77 79 81 83 85 87 89 91 93 95 97 99 01 03 05 07 09 11 13 15 The three “hard markets” in this 45 -year span were in 1976– 77, 1985– 86, and 2001– 03. Sources: A. M. Best (1971 -2017), ISO (2014 -16), A. M. Best, Insurance Information Institute (1986 -1994); U. S. Commerce Dept. , Bureau of Economic Analysis; Insurance Information Institute calculations. 25
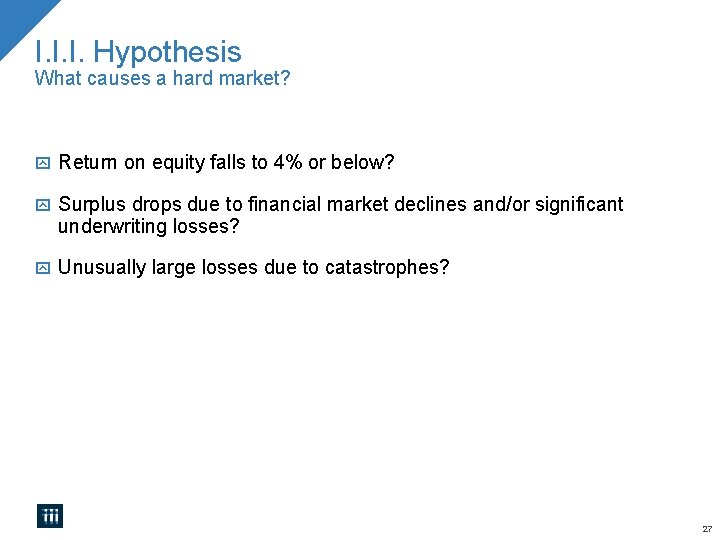
I. I. I. Hypothesis What causes a hard market? Return on equity falls to 4% or below? Surplus drops due to financial market declines and/or significant underwriting losses? Unusually large losses due to catastrophes? 27
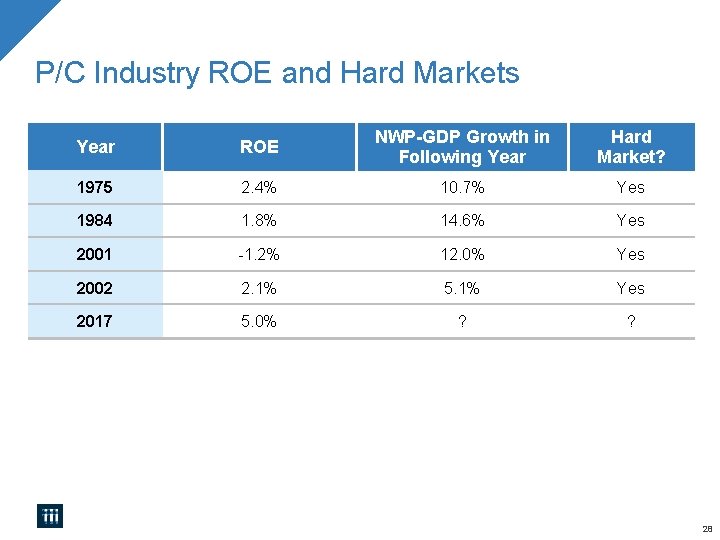
P/C Industry ROE and Hard Markets Year ROE NWP-GDP Growth in Following Year Hard Market? 1975 2. 4% 10. 7% Yes 1984 1. 8% 14. 6% Yes 2001 -1. 2% 12. 0% Yes 2002 2. 1% 5. 1% Yes 2017 5. 0% ? ? 28
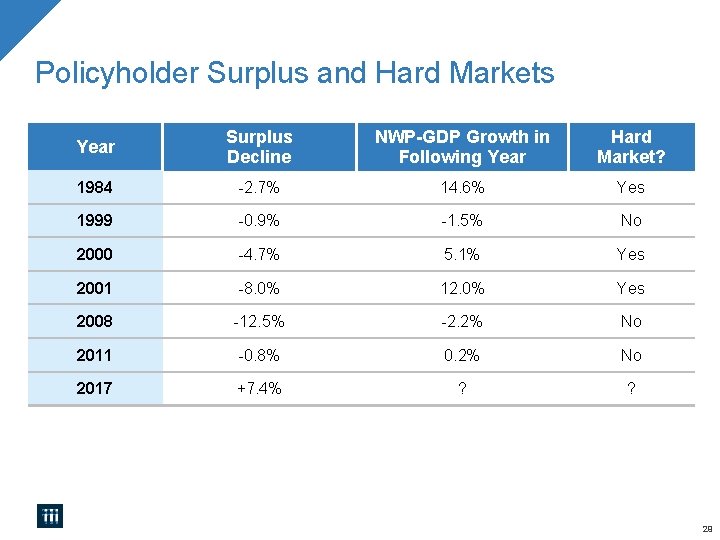
Policyholder Surplus and Hard Markets Year Surplus Decline NWP-GDP Growth in Following Year Hard Market? 1984 -2. 7% 14. 6% Yes 1999 -0. 9% -1. 5% No 2000 -4. 7% 5. 1% Yes 2001 -8. 0% 12. 0% Yes 2008 -12. 5% -2. 2% No 2011 -0. 8% 0. 2% No 2017 +7. 4% ? ? 29
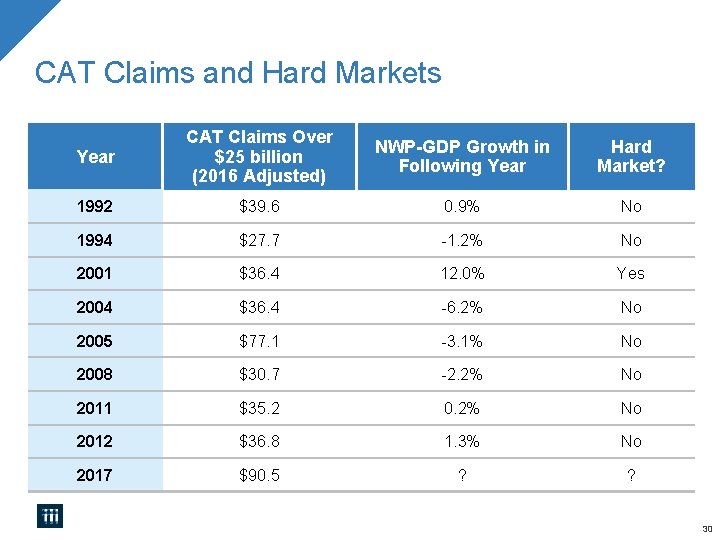
CAT Claims and Hard Markets Year CAT Claims Over $25 billion (2016 Adjusted) NWP-GDP Growth in Following Year Hard Market? 1992 $39. 6 0. 9% No 1994 $27. 7 -1. 2% No 2001 $36. 4 12. 0% Yes 2004 $36. 4 -6. 2% No 2005 $77. 1 -3. 1% No 2008 $30. 7 -2. 2% No 2011 $35. 2 0. 2% No 2012 $36. 8 1. 3% No 2017 $90. 5 ? ? 30
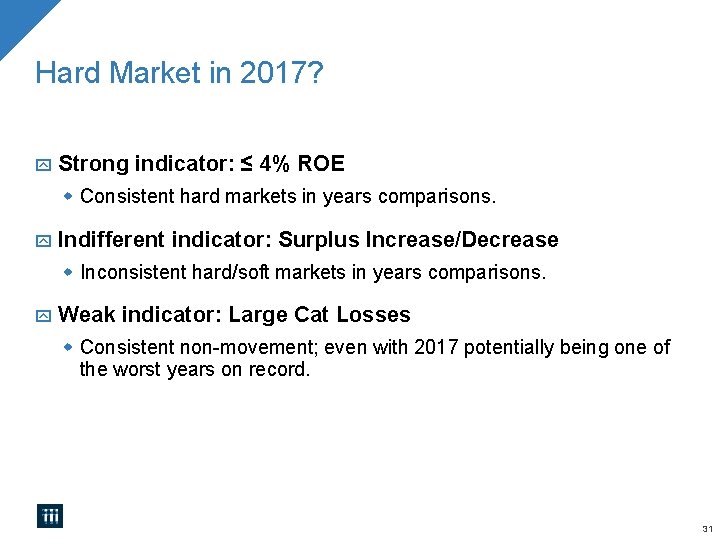
Hard Market in 2017? Strong indicator: ≤ 4% ROE Consistent hard markets in years comparisons. Indifferent indicator: Surplus Increase/Decrease Inconsistent hard/soft markets in years comparisons. Weak indicator: Large Cat Losses Consistent non-movement; even with 2017 potentially being one of the worst years on record. 31
Marijuana and Auto Insurance
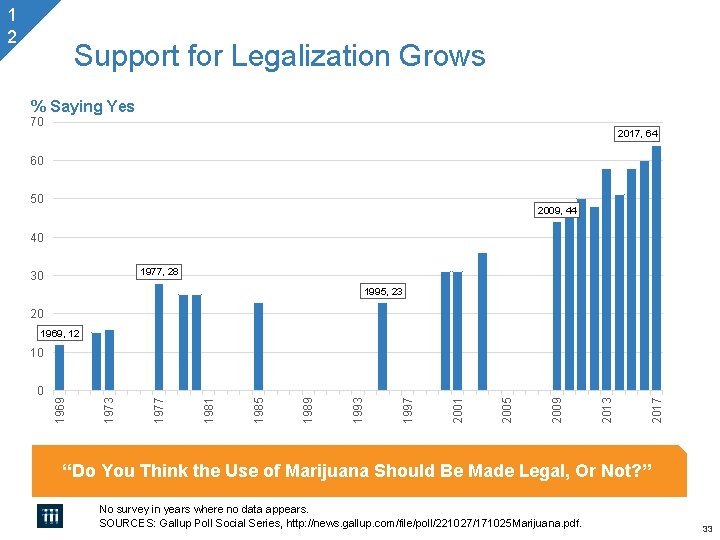
1 2 / 0 1 % Saying Yes / 70 0 9 60 Support for Legalization Grows 2009, 44 40 1977, 28 30 1995, 23 20 1969, 12 2017 2013 2009 2005 2001 1997 1993 1989 1985 1981 0 1977 10 1973 9 p m 50 1969 - 2017, 64 “Do You Think the Use of Marijuana Should Be Made Legal, Or Not? ” No survey in years where no data appears. SOURCES: Gallup Poll Social Series, http: //news. gallup. com/file/poll/221027/171025 Marijuana. pdf. 33
1 2 / 0 1 % Saying Yes / 0 80 9 Support for Legalization Grows Democrats Independents Republicans 72 67 Democrats 70 60 50 51 Independents 49 Republicans 40 2017 2016 2015 2014 2013 2012 2011 20 28 2010 30 2009 9 p m 54 “Do You Think the Use of Marijuana Should Be Made Legal, Or Not? ” SOURCES: Gallup Poll Social Series, http: //news. gallup. com/poll/221018/record-high-support-legalizingmarijuana. aspx 34
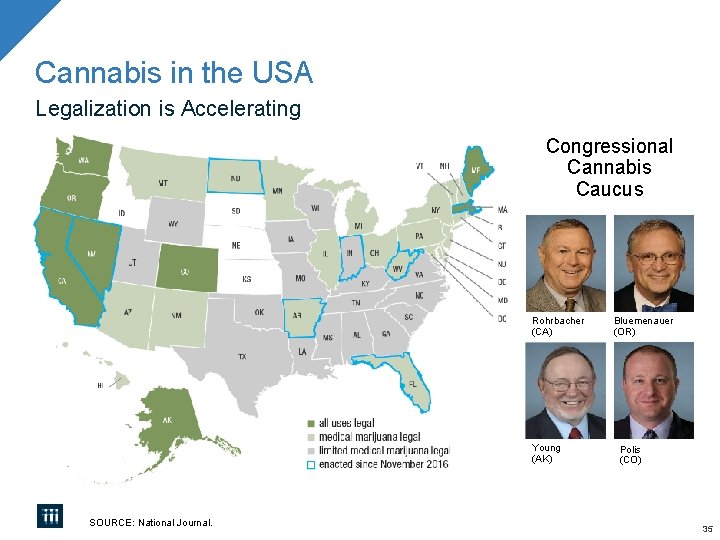
Cannabis in the USA Legalization is Accelerating Congressional Cannabis Caucus Rohrbacher (CA) Young (AK) SOURCE: National Journal. Bluemenauer (OR) Polis (CO) 35
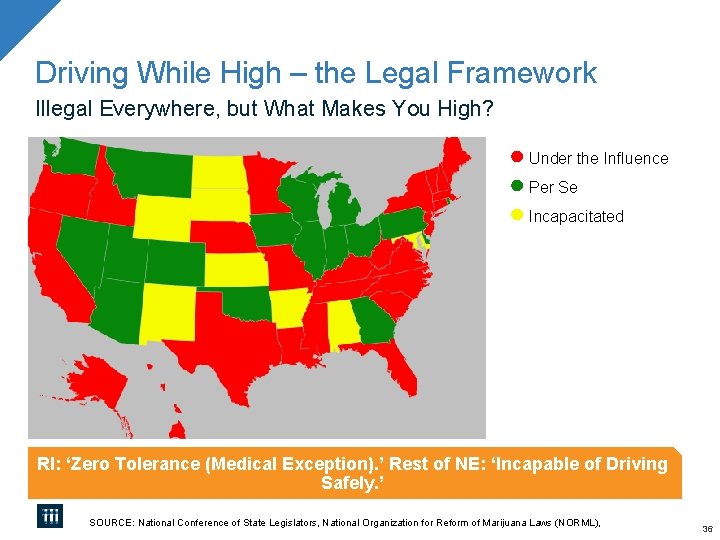
Driving While High – the Legal Framework Illegal Everywhere, but What Makes You High? ● Under the Influence ● Per Se ● Incapacitated RI: ‘Zero Tolerance (Medical Exception). ’ Rest of NE: ‘Incapable of Driving Safely. ’ SOURCE: National Conference of State Legislators, National Organization for Reform of Marijuana Laws (NORML), 36
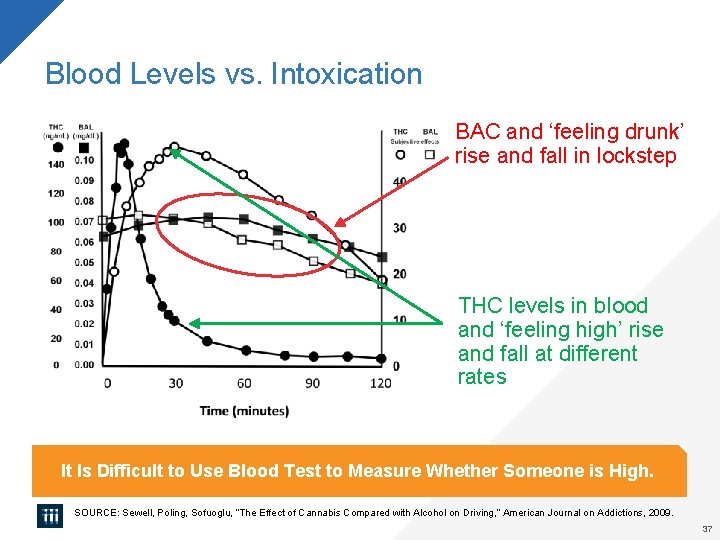
Blood Levels vs. Intoxication BAC and ‘feeling drunk’ rise and fall in lockstep THC levels in blood and ‘feeling high’ rise and fall at different rates It Is Difficult to Use Blood Test to Measure Whether Someone is High. SOURCE: Sewell, Poling, Sofuoglu, “The Effect of Cannabis Compared with Alcohol on Driving, ” American Journal on Addictions, 2009. 37
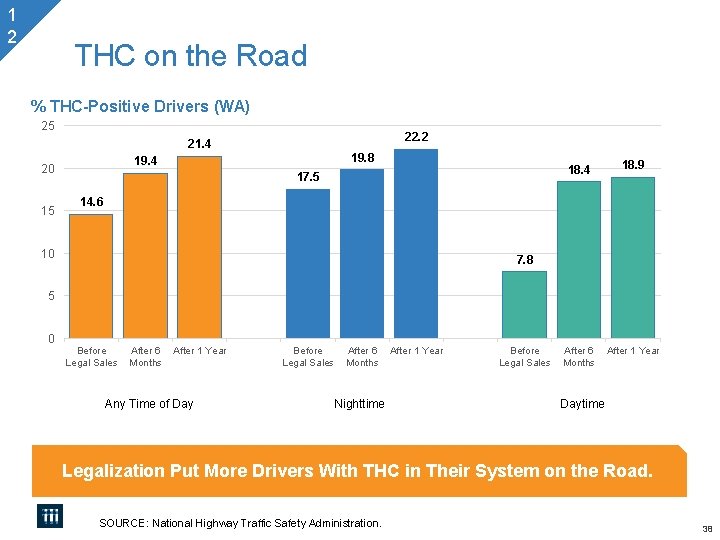
1 2 / 0 1 % THC-Positive Drivers (WA) / 25 21. 4 0 19. 4 9 20 THC on the Road - 15 9 p m 10 22. 2 19. 8 17. 5 18. 4 18. 9 After 6 Months After 1 Year 14. 6 7. 8 5 0 Before Legal Sales After 6 Months After 1 Year Any Time of Day Before Legal Sales After 6 Months Nighttime After 1 Year Before Legal Sales Daytime Legalization Put More Drivers With THC in Their System on the Road. SOURCE: National Highway Traffic Safety Administration. 38
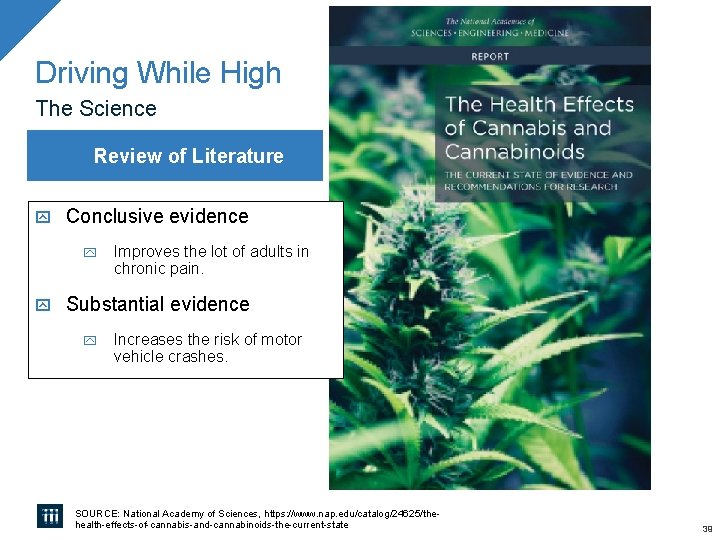
Driving While High The Science Review of Literature Conclusive evidence Improves the lot of adults in chronic pain. Substantial evidence Increases the risk of motor vehicle crashes. SOURCE: National Academy of Sciences, https: //www. nap. edu/catalog/24625/thehealth-effects-of-cannabis-and-cannabinoids-the-current-state 39
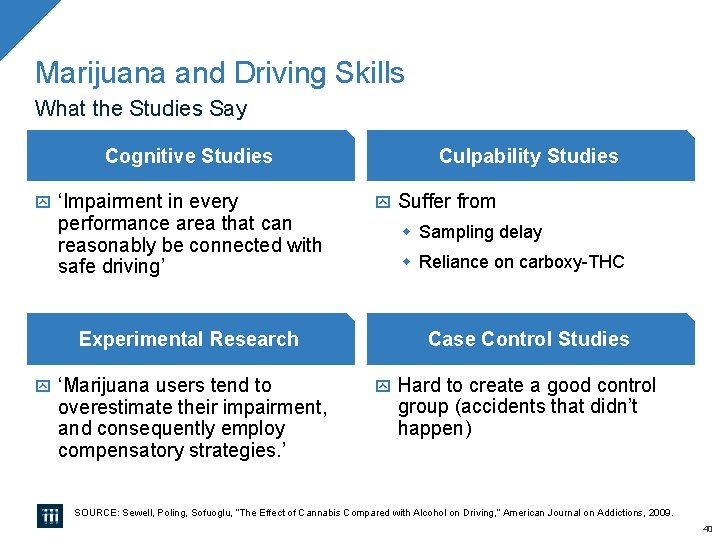
Marijuana and Driving Skills What the Studies Say Cognitive Studies ‘Impairment in every performance area that can reasonably be connected with safe driving’ Culpability Studies Sampling delay Reliance on carboxy-THC Experimental Research ‘Marijuana users tend to overestimate their impairment, and consequently employ compensatory strategies. ’ Suffer from Case Control Studies Hard to create a good control group (accidents that didn’t happen) SOURCE: Sewell, Poling, Sofuoglu, “The Effect of Cannabis Compared with Alcohol on Driving, ” American Journal on Addictions, 2009. 40
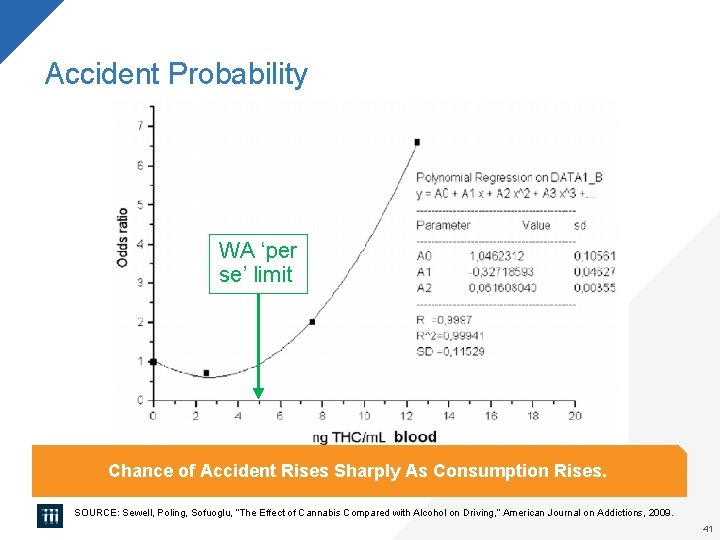
Accident Probability WA ‘per se’ limit Chance of Accident Rises Sharply As Consumption Rises. SOURCE: Sewell, Poling, Sofuoglu, “The Effect of Cannabis Compared with Alcohol on Driving, ” American Journal on Addictions, 2009. 41
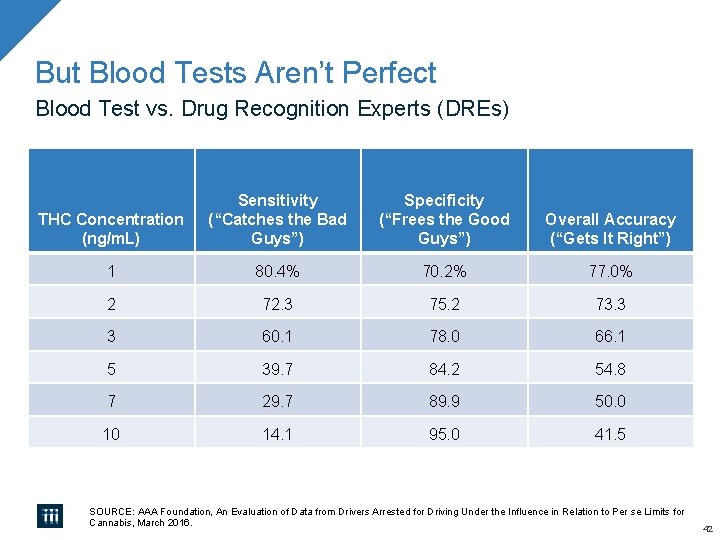
But Blood Tests Aren’t Perfect Blood Test vs. Drug Recognition Experts (DREs) THC Concentration (ng/m. L) Sensitivity (“Catches the Bad Guys”) Specificity (“Frees the Good Guys”) Overall Accuracy (“Gets It Right”) 1 80. 4% 70. 2% 77. 0% 2 72. 3 75. 2 73. 3 3 60. 1 78. 0 66. 1 5 39. 7 84. 2 54. 8 7 29. 7 89. 9 50. 0 10 14. 1 95. 0 41. 5 SOURCE: AAA Foundation, An Evaluation of Data from Drivers Arrested for Driving Under the Influence in Relation to Per se Limits for Cannabis, March 2016. 42
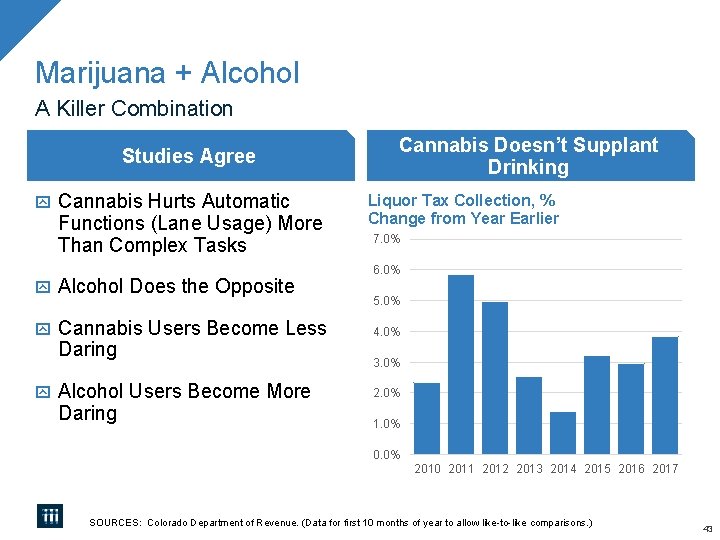
Marijuana + Alcohol A Killer Combination Studies Agree Cannabis Hurts Automatic Functions (Lane Usage) More Than Complex Tasks Alcohol Does the Opposite Cannabis Users Become Less Daring Alcohol Users Become More Daring Cannabis Doesn’t Supplant Drinking Liquor Tax Collection, % Change from Year Earlier 7. 0% 6. 0% 5. 0% 4. 0% 3. 0% 2. 0% 1. 0% 0. 0% 2010 2011 2012 2013 2014 2015 2016 2017 SOURCES: Colorado Department of Revenue. (Data for first 10 months of year to allow like-to-like comparisons. ) 43
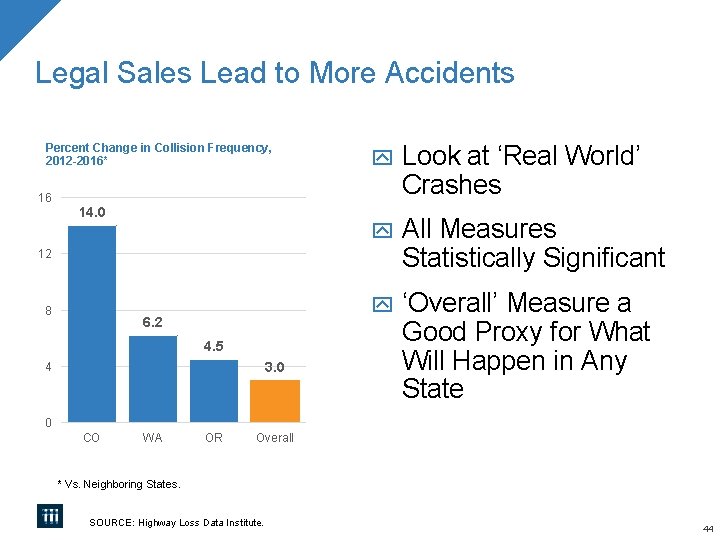
Legal Sales Lead to More Accidents Percent Change in Collision Frequency, 2012 -2016* 16 14. 0 Look at ‘Real World’ Crashes All Measures Statistically Significant ‘Overall’ Measure a Good Proxy for What Will Happen in Any State 12 8 6. 2 4. 5 3. 0 4 0 CO WA OR Overall * Vs. Neighboring States. SOURCE: Highway Loss Data Institute. 44
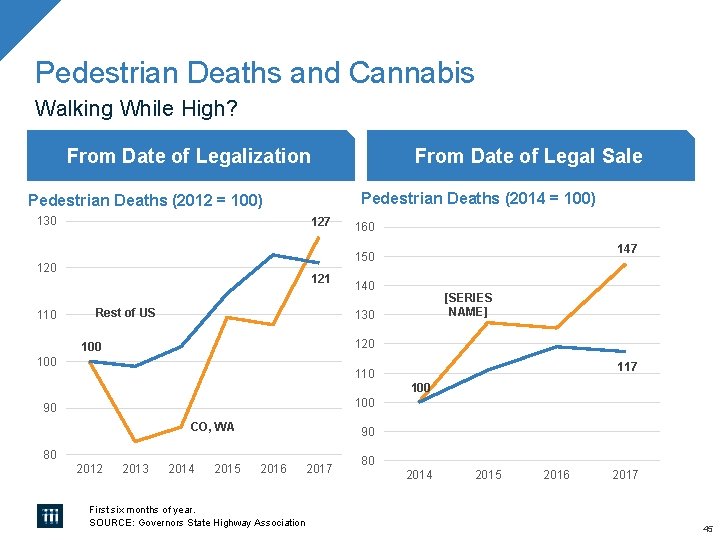
Pedestrian Deaths and Cannabis Walking While High? From Date of Legalization Pedestrian Deaths (2014 = 100) Pedestrian Deaths (2012 = 100) 130 127 160 147 150 120 110 From Date of Legal Sale 121 Rest of US 140 [SERIES NAME] 130 120 100 117 110 100 90 CO, WA 90 80 2012 2013 2014 2015 2016 First six months of year. SOURCE: Governors State Highway Association 2017 80 2014 2015 2016 2017 45
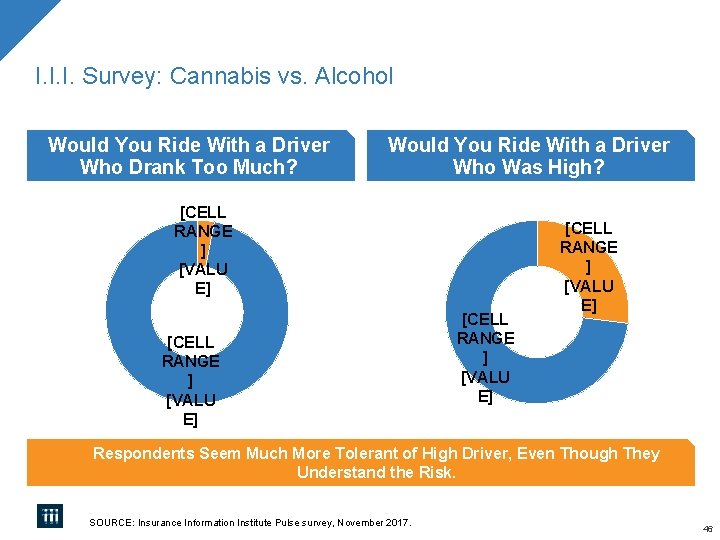
I. I. I. Survey: Cannabis vs. Alcohol Would You Ride With a Driver Who Drank Too Much? Would You Ride With a Driver Who Was High? [CELL RANGE ] [VALU E] Respondents Seem Much More Tolerant of High Driver, Even Though They Understand the Risk. SOURCE: Insurance Information Institute Pulse survey, November 2017. 46
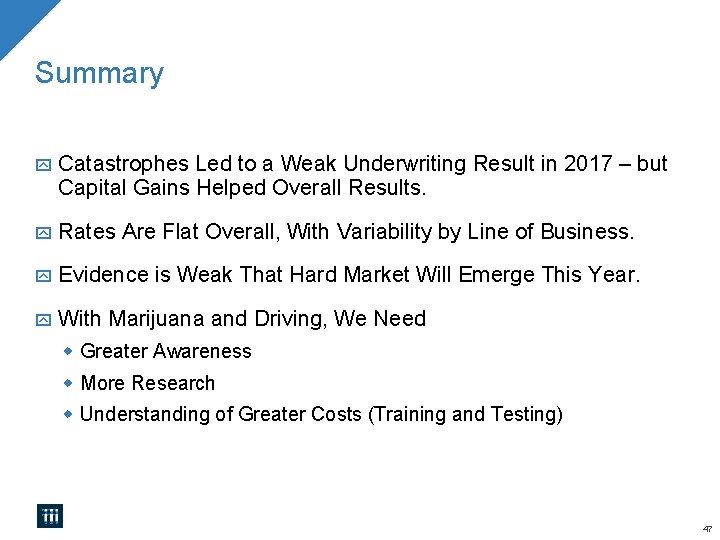
Summary Catastrophes Led to a Weak Underwriting Result in 2017 – but Capital Gains Helped Overall Results. Rates Are Flat Overall, With Variability by Line of Business. Evidence With is Weak That Hard Market Will Emerge This Year. Marijuana and Driving, We Need Greater Awareness More Research Understanding of Greater Costs (Training and Testing) 47
The Insurance Information Institute Improving public understanding of insurance. . . …what it does and how it works 48
Thank you for your time and your attention! www. iii. org