
2018 Global Aerospace Defense Outlook On a solid
2018 Global Aerospace & Defense Outlook On a solid profitable growth path September 2018
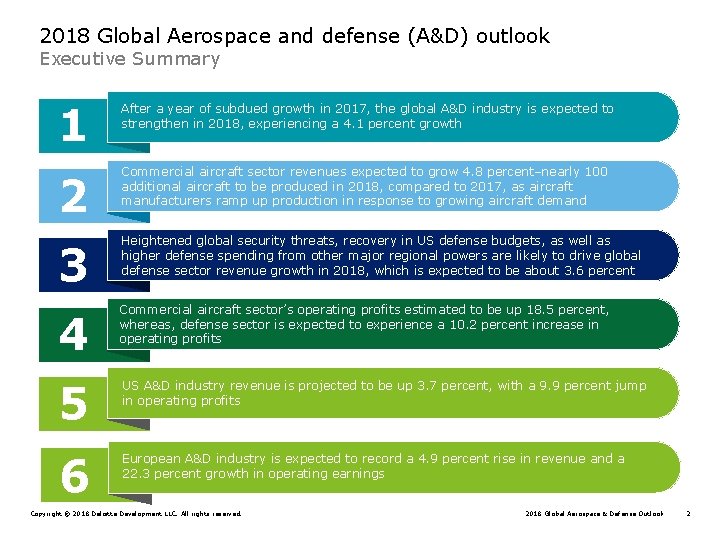
2018 Global Aerospace and defense (A&D) outlook Executive Summary 1 After a year of subdued growth in 2017, the global A&D industry is expected to strengthen in 2018, experiencing a 4. 1 percent growth 2 Commercial aircraft sector revenues expected to grow 4. 8 percent–nearly 100 additional aircraft to be produced in 2018, compared to 2017, as aircraft manufacturers ramp up production in response to growing aircraft demand 3 Heightened global security threats, recovery in US defense budgets, as well as higher defense spending from other major regional powers are likely to drive global defense sector revenue growth in 2018, which is expected to be about 3. 6 percent 4 Commercial aircraft sector’s operating profits estimated to be up 18. 5 percent, whereas, defense sector is expected to experience a 10. 2 percent increase in operating profits 5 US A&D industry revenue is projected to be up 3. 7 percent, with a 9. 9 percent jump in operating profits 6 European A&D industry is expected to record a 4. 9 percent rise in revenue and a 22. 3 percent growth in operating earnings Copyright © 2018 Deloitte Development LLC. All rights reserved. 2018 Global Aerospace & Defense Outlook 2
Commercial Aircraft Sector Trends Copyright © 2018 Deloitte Development LLC. All rights reserved. 2018 Global Aerospace & Defense Outlook 3
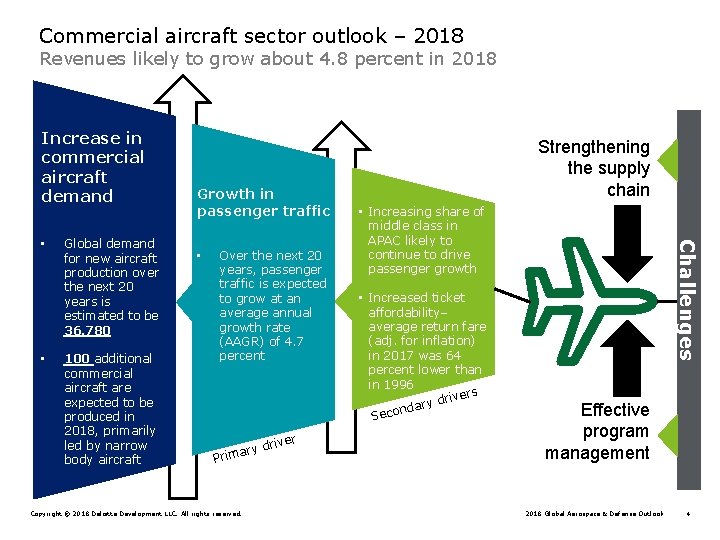
Commercial aircraft sector outlook – 2018 Revenues likely to grow about 4. 8 percent in 2018 Increase in commercial aircraft demand • 100 additional commercial aircraft are expected to be produced in 2018, primarily led by narrow body aircraft • , Global demand for new aircraft production over the next 20 years is estimated to be 36, 780 Over the next 20 years, passenger traffic is expected to grow at an average annual growth rate (AAGR) of 4. 7 percent ve y dri r a m i Pr Copyright © 2018 Deloitte Development LLC. All rights reserved. r • Increasing share of middle class in APAC likely to continue to drive passenger growth • Increased ticket affordability– average return fare (adj. for inflation) in 2017 was 64 percent lower than in 1996 rs drive y r a nd Seco Challenges • Growth in passenger traffic Strengthening the supply chain Effective program management 2018 Global Aerospace & Defense Outlook 4
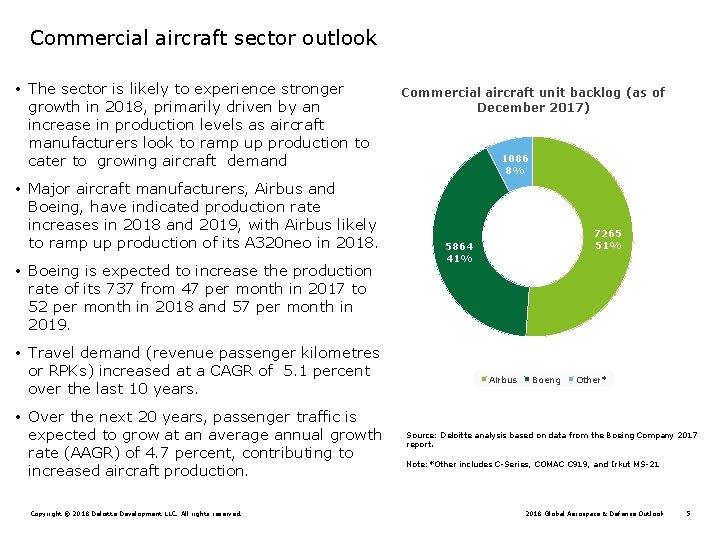
Commercial aircraft sector outlook • The sector is likely to experience stronger growth in 2018, primarily driven by an increase in production levels as aircraft manufacturers look to ramp up production to cater to growing aircraft demand • Major aircraft manufacturers, Airbus and Boeing, have indicated production rate increases in 2018 and 2019, with Airbus likely to ramp up production of its A 320 neo in 2018. • Boeing is expected to increase the production rate of its 737 from 47 per month in 2017 to 52 per month in 2018 and 57 per month in 2019. • Travel demand (revenue passenger kilometres or RPKs) increased at a CAGR of 5. 1 percent over the last 10 years. • Over the next 20 years, passenger traffic is expected to grow at an average annual growth rate (AAGR) of 4. 7 percent, contributing to increased aircraft production. Copyright © 2018 Deloitte Development LLC. All rights reserved. Commercial aircraft unit backlog (as of December 2017) 1086 8% 7265 51% 5864 41% Airbus Boeng Other* Source: Deloitte analysis based on data from the Boeing Company 2017 report. Note: *Other includes C-Series, COMAC C 919, and Irkut MS-21 2018 Global Aerospace & Defense Outlook 5

Defence Sector Trends Copyright © 2018 Deloitte Development LLC. All rights reserved. 2018 Global Aerospace & Defense Outlook 7
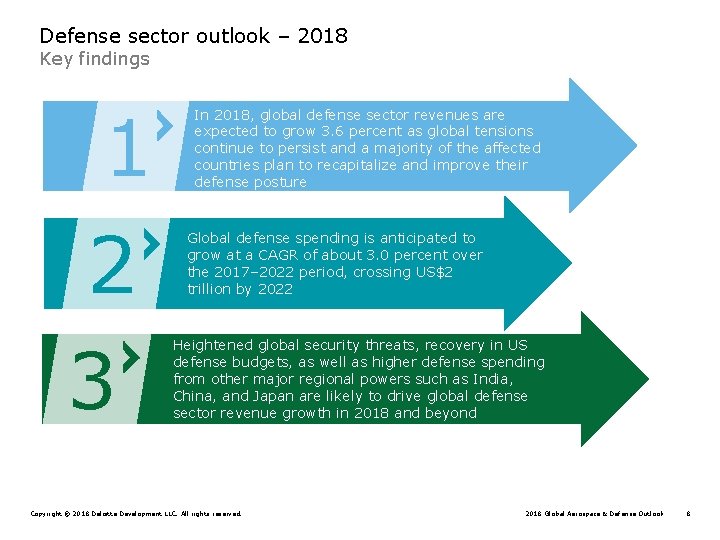
Defense sector outlook – 2018 Key findings 1 2 3 In 2018, global defense sector revenues are expected to grow 3. 6 percent as global tensions continue to persist and a majority of the affected countries plan to recapitalize and improve their defense posture Global defense spending is anticipated to grow at a CAGR of about 3. 0 percent over the 2017– 2022 period, crossing US$2 trillion by 2022 Heightened global security threats, recovery in US defense budgets, as well as higher defense spending from other major regional powers such as India, China, and Japan are likely to drive global defense sector revenue growth in 2018 and beyond Copyright © 2018 Deloitte Development LLC. All rights reserved. 2018 Global Aerospace & Defense Outlook 8
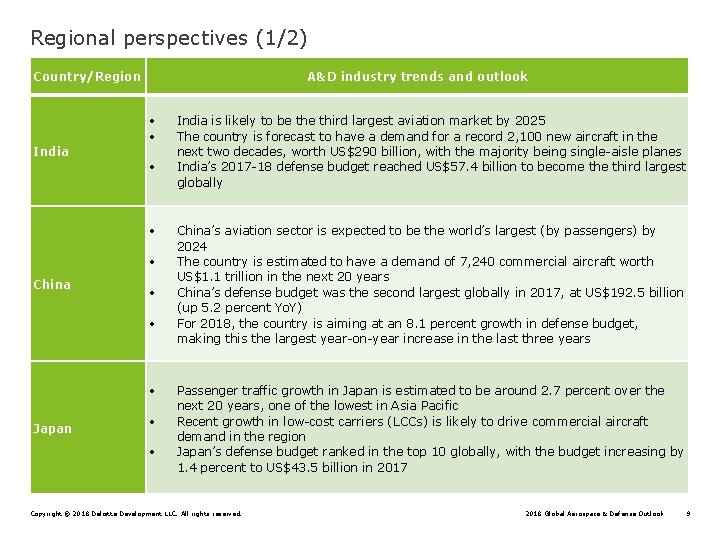
Regional perspectives (1/2) Country/Region A&D industry trends and outlook India China Japan India is likely to be third largest aviation market by 2025 The country is forecast to have a demand for a record 2, 100 new aircraft in the next two decades, worth US$290 billion, with the majority being single-aisle planes India’s 2017 -18 defense budget reached US$57. 4 billion to become third largest globally China’s aviation sector is expected to be the world’s largest (by passengers) by 2024 The country is estimated to have a demand of 7, 240 commercial aircraft worth US$1. 1 trillion in the next 20 years China’s defense budget was the second largest globally in 2017, at US$192. 5 billion (up 5. 2 percent Yo. Y) For 2018, the country is aiming at an 8. 1 percent growth in defense budget, making this the largest year-on-year increase in the last three years Passenger traffic growth in Japan is estimated to be around 2. 7 percent over the next 20 years, one of the lowest in Asia Pacific Recent growth in low-cost carriers (LCCs) is likely to drive commercial aircraft demand in the region Japan’s defense budget ranked in the top 10 globally, with the budget increasing by 1. 4 percent to US$43. 5 billion in 2017 Copyright © 2018 Deloitte Development LLC. All rights reserved. 2018 Global Aerospace & Defense Outlook 9
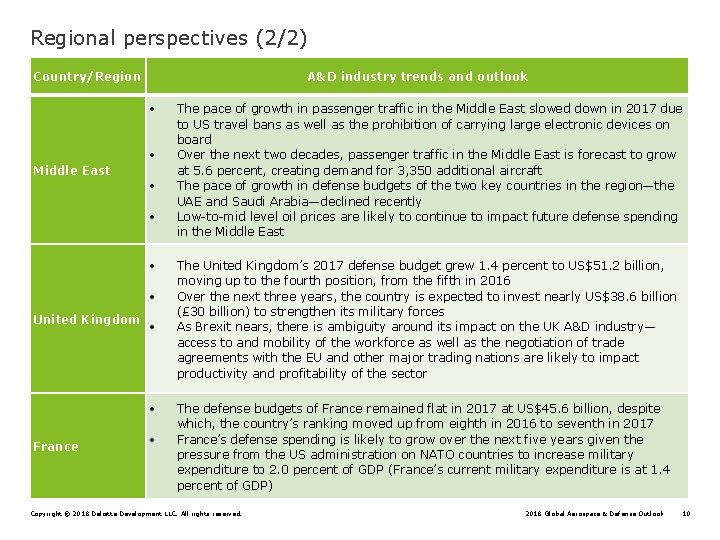
Regional perspectives (2/2) Country/Region A&D industry trends and outlook Middle East United Kingdom France The pace of growth in passenger traffic in the Middle East slowed down in 2017 due to US travel bans as well as the prohibition of carrying large electronic devices on board Over the next two decades, passenger traffic in the Middle East is forecast to grow at 5. 6 percent, creating demand for 3, 350 additional aircraft The pace of growth in defense budgets of the two key countries in the region—the UAE and Saudi Arabia—declined recently Low-to-mid level oil prices are likely to continue to impact future defense spending in the Middle East The United Kingdom’s 2017 defense budget grew 1. 4 percent to US$51. 2 billion, moving up to the fourth position, from the fifth in 2016 Over the next three years, the country is expected to invest nearly US$38. 6 billion (£ 30 billion) to strengthen its military forces As Brexit nears, there is ambiguity around its impact on the UK A&D industry— access to and mobility of the workforce as well as the negotiation of trade agreements with the EU and other major trading nations are likely to impact productivity and profitability of the sector The defense budgets of France remained flat in 2017 at US$45. 6 billion, despite which, the country’s ranking moved up from eighth in 2016 to seventh in 2017 France’s defense spending is likely to grow over the next five years given the pressure from the US administration on NATO countries to increase military expenditure to 2. 0 percent of GDP (France’s current military expenditure is at 1. 4 percent of GDP) Copyright © 2018 Deloitte Development LLC. All rights reserved. 2018 Global Aerospace & Defense Outlook 10
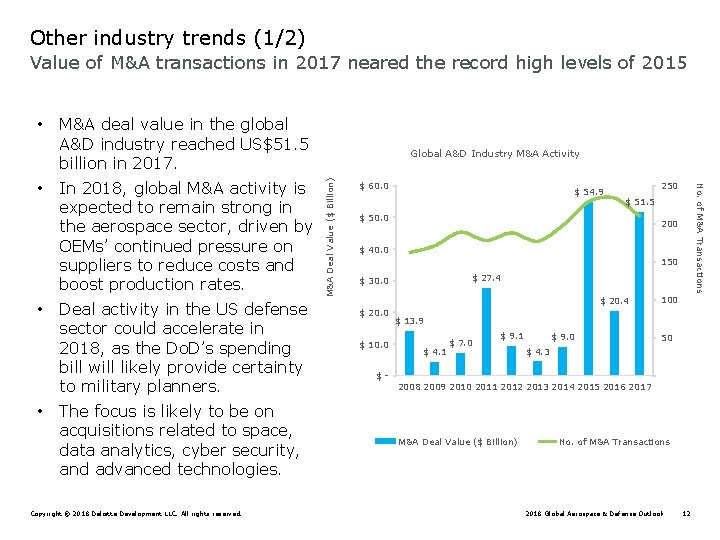
Other industry trends (1/2) Value of M&A transactions in 2017 neared the record high levels of 2015 • • In 2018, global M&A activity is expected to remain strong in the aerospace sector, driven by OEMs’ continued pressure on suppliers to reduce costs and boost production rates. Deal activity in the US defense sector could accelerate in 2018, as the Do. D’s spending bill will likely provide certainty to military planners. The focus is likely to be on acquisitions related to space, data analytics, cyber security, and advanced technologies. Copyright © 2018 Deloitte Development LLC. All rights reserved. Global A&D Industry M&A Activity $ 60. 0 $ 54. 9 250 No. of M&A Transactions • M&A deal value in the global A&D industry reached US$51. 5 billion in 2017. M&A Deal Value ($ Billion) • $ 51. 5 $ 50. 0 200 $ 40. 0 150 $ 27. 4 $ 30. 0 $ 20. 4 $ 20. 0 $ 10. 0 $- 100 $ 13. 9 $ 4. 1 $ 7. 0 $ 9. 1 $ 9. 0 50 $ 4. 3 2008 2009 2010 2011 2012 2013 2014 2015 2016 2017 M&A Deal Value ($ Billion) No. of M&A Transactions 2018 Global Aerospace & Defense Outlook 12
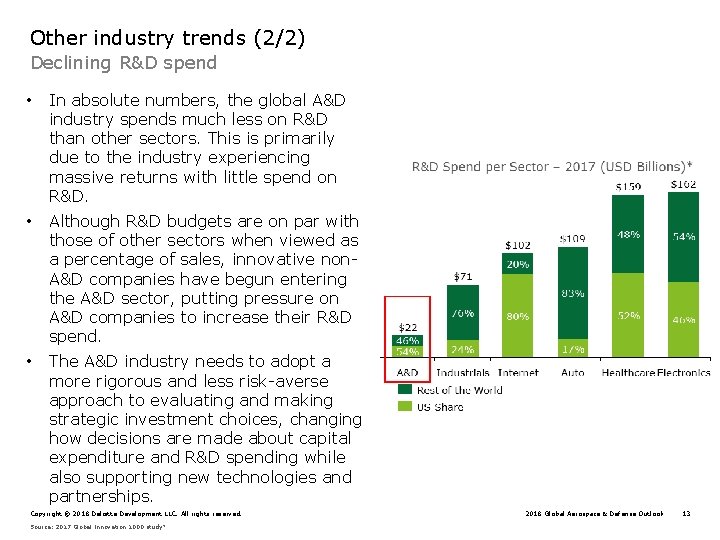
Other industry trends (2/2) Declining R&D spend • In absolute numbers, the global A&D industry spends much less on R&D than other sectors. This is primarily due to the industry experiencing massive returns with little spend on R&D. • Although R&D budgets are on par with those of other sectors when viewed as a percentage of sales, innovative non. A&D companies have begun entering the A&D sector, putting pressure on A&D companies to increase their R&D spend. • The A&D industry needs to adopt a more rigorous and less risk-averse approach to evaluating and making strategic investment choices, changing how decisions are made about capital expenditure and R&D spending while also supporting new technologies and partnerships. Copyright © 2018 Deloitte Development LLC. All rights reserved. Source: 2017 Global Innovation 1000 study* 2018 Global Aerospace & Defense Outlook 13
Defence Spend & Financial Performance Copyright © 2018 Deloitte Development LLC. All rights reserved. 2018 Global Aerospace & Defense Outlook 14
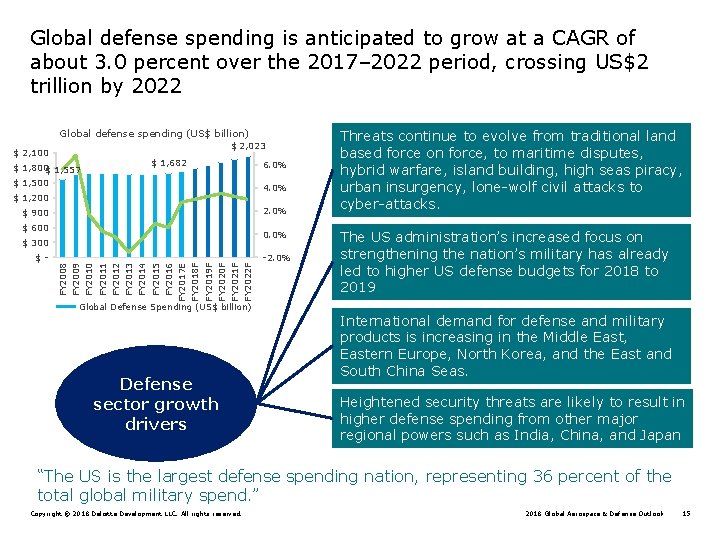
Global defense spending is anticipated to grow at a CAGR of about 3. 0 percent over the 2017– 2022 period, crossing US$2 trillion by 2022 Global defense spending (US$ billion) $ 2, 023 $ 2, 100 $ 1, 800$ 1, 557 $ 1, 682 $ 1, 500 6. 0% 4. 0% $ 1, 200 2. 0% $ 900 $ 600 0. 0% $ 300 -2. 0% FY 2008 FY 2009 FY 2010 FY 2011 FY 2012 FY 2013 FY 2014 FY 2015 FY 2016 FY 2017 E FY 2018 F FY 2019 F FY 2020 F FY 2021 F FY 2022 F $- Global Defense Spending (US$ billion) Defense sector growth drivers Threats continue to evolve from traditional land based force on force, to maritime disputes, hybrid warfare, island building, high seas piracy, urban insurgency, lone-wolf civil attacks to cyber-attacks. The US administration’s increased focus on strengthening the nation’s military has already led to higher US defense budgets for 2018 to 2019 International demand for defense and military products is increasing in the Middle East, Eastern Europe, North Korea, and the East and South China Seas. Heightened security threats are likely to result in higher defense spending from other major regional powers such as India, China, and Japan “The US is the largest defense spending nation, representing 36 percent of the total global military spend. ” Copyright © 2018 Deloitte Development LLC. All rights reserved. 2018 Global Aerospace & Defense Outlook 15
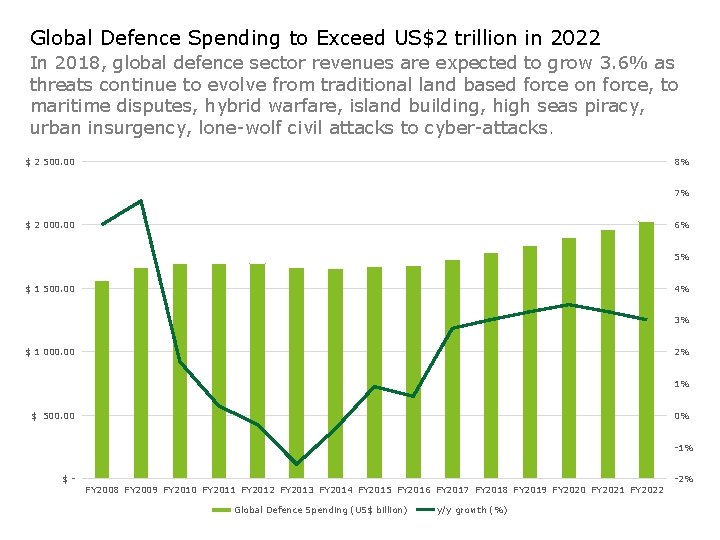
Global Defence Spending to Exceed US$2 trillion in 2022 In 2018, global defence sector revenues are expected to grow 3. 6% as threats continue to evolve from traditional land based force on force, to maritime disputes, hybrid warfare, island building, high seas piracy, urban insurgency, lone-wolf civil attacks to cyber-attacks. $ 2 500. 00 8% 7% $ 2 000. 00 6% 5% $ 1 500. 00 4% 3% $ 1 000. 00 2% 1% $ 500. 00 0% -1% $- FY 2008 FY 2009 FY 2010 FY 2011 FY 2012 FY 2013 FY 2014 FY 2015 FY 2016 FY 2017 FY 2018 FY 2019 FY 2020 FY 2021 FY 2022 Global Defence Spending (US$ billion) Copyright © 2018 Deloitte Development LLC. All rights reserved. y/y growth (%) 2018 Global Aerospace & Defense Outlook -2% 16
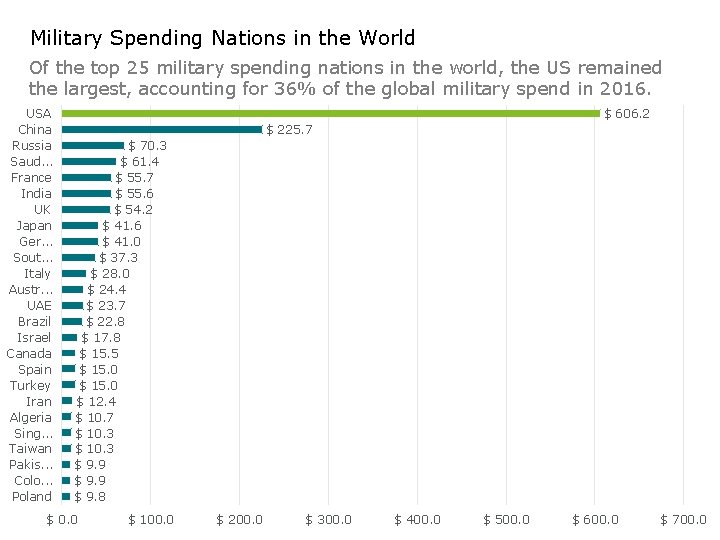
Military Spending Nations in the World Of the top 25 military spending nations in the world, the US remained the largest, accounting for 36% of the global military spend in 2016. USA China Russia Saud. . . France India UK Japan Ger. . . Sout. . . Italy Austr. . . UAE Brazil Israel Canada Spain Turkey Iran Algeria Sing. . . Taiwan Pakis. . . Colo. . . Poland $ 606. 2 $ 225. 7 $ 70. 3 $ 61. 4 $ 55. 7 $ 55. 6 $ 54. 2 $ 41. 6 $ 41. 0 $ 37. 3 $ 28. 0 $ 24. 4 $ 23. 7 $ 22. 8 $ 17. 8 $ 15. 5 $ 15. 0 $ 12. 4 $ 10. 7 $ 10. 3 $ 9. 9 $ 9. 8 Copyright © 2018 Deloitte Development LLC. All rights reserved. $ 0. 0 $ 100. 0 $ 200. 0 $ 300. 0 $ 400. 0 2018 Global Aerospace & Defense Outlook $ 500. 0 $ 600. 0 17 $ 700. 0
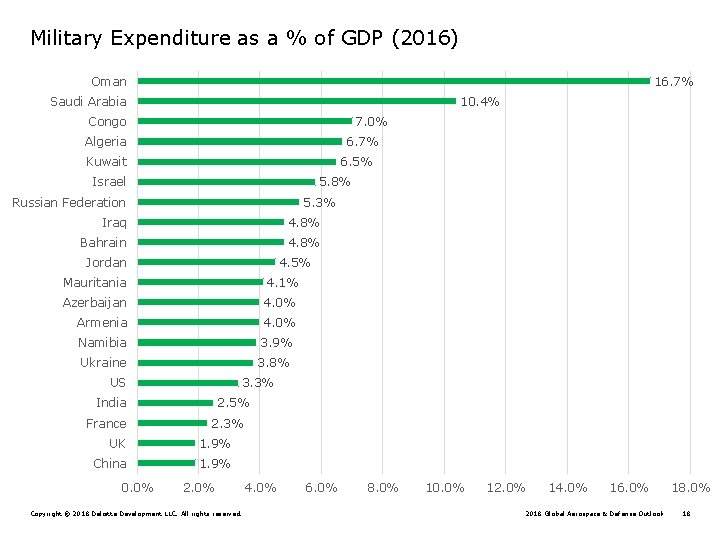
Military Expenditure as a % of GDP (2016) 16. 7% Oman 10. 4% Saudi Arabia 7. 0% Congo 6. 7% Algeria Kuwait 6. 5% Israel 5. 8% Russian Federation 5. 3% Iraq 4. 8% Bahrain 4. 8% Jordan 4. 5% Mauritania 4. 1% Azerbaijan 4. 0% Armenia 4. 0% Namibia 3. 9% Ukraine 3. 8% US 3. 3% India France 2. 5% 2. 3% UK 1. 9% China 1. 9% 0. 0% 2. 0% Copyright © 2018 Deloitte Development LLC. All rights reserved. 4. 0% 6. 0% 8. 0% 10. 0% 12. 0% 14. 0% 16. 0% 2018 Global Aerospace & Defense Outlook 18. 0% 18
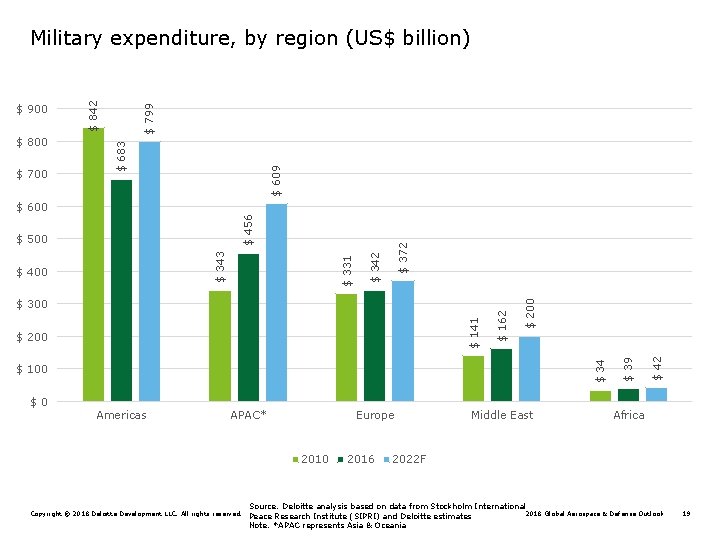
$ 609 $ 700 $ 799 $ 800 $ 683 $ 900 $ 842 Military expenditure, by region (US$ billion) $ 42 $ 100 $ 39 $ 34 $ 200 $ 141 $ 300 $ 162 $ 342 $ 400 $ 331 $ 343 $ 500 $ 372 $ 456 $ 600 $0 Americas APAC* Europe 2010 Copyright © 2018 Deloitte Development LLC. All rights reserved. 2016 Middle East Africa 2022 F Source: Deloitte analysis based on data from Stockholm International 2018 Global Aerospace & Defense Outlook Peace Research Institute (SIPRI) and Deloitte estimates Note: *APAC represents Asia & Oceania 19

2. 1% 2. 4% 2. 0% 9. 9% 10. 0% 9. 6% 8. 3% 18. 4% 20. 0% 20. 3% 30. 1% 19. 6% 20. 3% 30. 0% 27. 1% 40. 0% 39. 5% 50. 0% 40. 6% 60. 0% 49. 8% Military expenditure percentage contribution, by region 0. 0% Americas APAC* Europe 2010 Copyright © 2018 Deloitte Development LLC. All rights reserved. 2016 Middle East Africa 2022 F Source: Deloitte analysis based on data from Stockholm International 2018 Global Aerospace & Defense Outlook Peace Research Institute (SIPRI) and Deloitte estimates Note: *APAC represents Asia & Oceania 20

Global A&D industry indices’ performance (2006 to 2018 YTD) Copyright © 2018 Deloitte Development LLC. All rights reserved. 2018 Global Aerospace & Defense Outlook 21
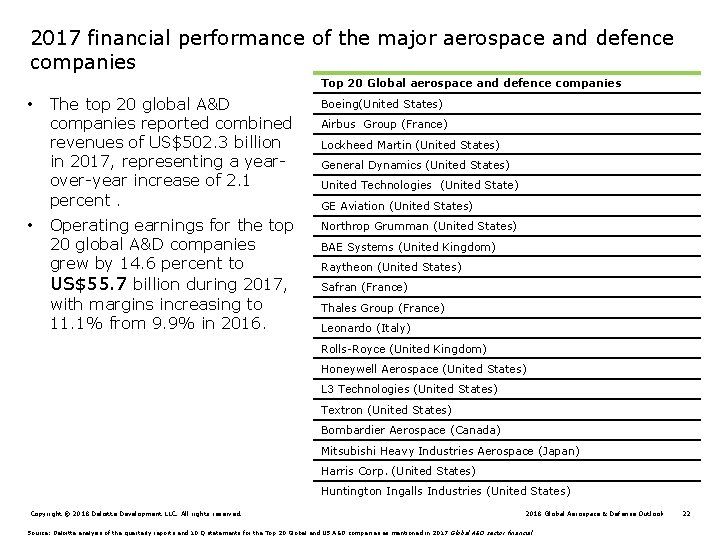
2017 financial performance of the major aerospace and defence companies Top 20 Global aerospace and defence companies • • The top 20 global A&D companies reported combined revenues of US$502. 3 billion in 2017, representing a yearover-year increase of 2. 1 percent. Boeing(United States) Operating earnings for the top 20 global A&D companies grew by 14. 6 percent to US$55. 7 billion during 2017, with margins increasing to 11. 1% from 9. 9% in 2016. Northrop Grumman (United States) Airbus Group (France) Lockheed Martin (United States) General Dynamics (United States) United Technologies (United State) GE Aviation (United States) BAE Systems (United Kingdom) Raytheon (United States) Safran (France) Thales Group (France) Leonardo (Italy) Rolls-Royce (United Kingdom) Honeywell Aerospace (United States) L 3 Technologies (United States) Textron (United States) Bombardier Aerospace (Canada) Mitsubishi Heavy Industries Aerospace (Japan) Harris Corp. (United States) Huntington Ingalls Industries (United States) Copyright © 2018 Deloitte Development LLC. All rights reserved. 2018 Global Aerospace & Defense Outlook Source: Deloitte analysis of the quarterly reports and 10 Q statements for the Top 20 Global and US A&D companies as mentioned in 2017 Global A&D sector financial 22
About Deloitte refers to one or more of Deloitte Touche Tohmatsu Limited, a UK private company limited by guarantee (“DTTL”), its network of member firms, and their related entities. DTTL and each of its member firms are legally separate and independent entities. DTTL (also referred to as “Deloitte Global”) does not provide services to clients. Please see www. deloitte. com/about for a detailed description of DTTL and its member firms. Please see www. deloitte. com/us/about for a detailed description of the legal structure of Deloitte LLP and its subsidiaries. Certain services may not be available to attest clients under the rules and regulations of public accounting. This publication contains general information only and Deloitte is not, by means of this publication, rendering accounting, business, financial, investment, legal, tax, or other professional advice or services. This publication is not a substitute for such professional advice or services, nor should it be used as a basis for any decision or action that may affect your business. Before making any decision or taking any action that may affect your business, you should consult a qualified professional advisor. Deloitte shall not be responsible for any loss sustained by any person who relies on this publication. Copyright © 2018 Deloitte Development LLC. All rights reserved.
- Slides: 21