Livestock Crop Outlook Chad Hart Iowa State University
- Slides: 28
Livestock & Crop Outlook Chad Hart Iowa State University chart@iastate. edu Livestock information from Lee Schulz, Department of Economics, Iowa State University (515) 294 -3356; lschulz@iastate. edu
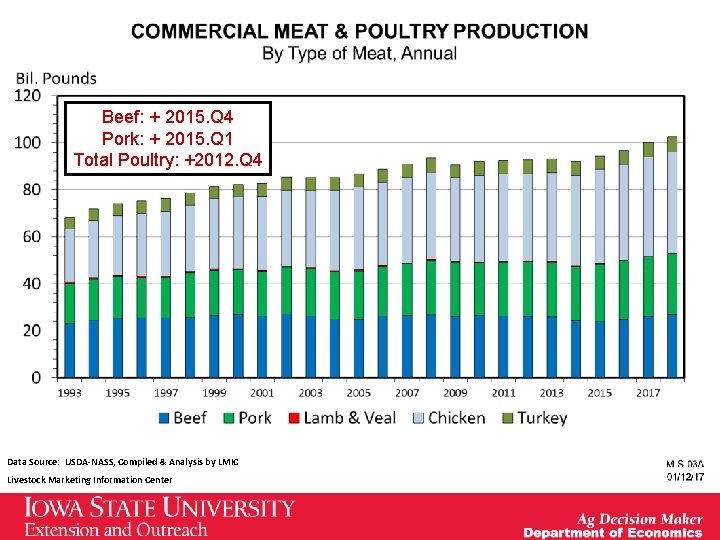
Beef: + 2015. Q 4 Pork: + 2015. Q 1 Total Poultry: +2012. Q 4 Data Source: USDA-NASS, Compiled & Analysis by LMIC Livestock Marketing Information Center
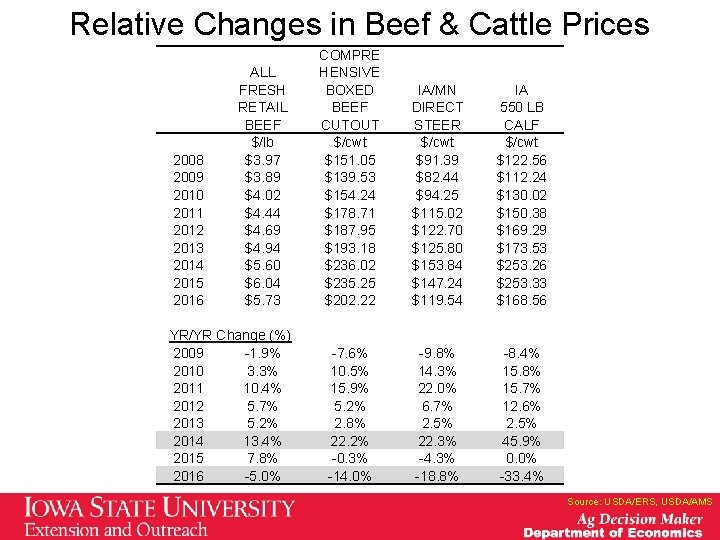
Relative Changes in Beef & Cattle Prices 2008 2009 2010 2011 2012 2013 2014 2015 2016 ALL FRESH RETAIL BEEF $/lb $3. 97 $3. 89 $4. 02 $4. 44 $4. 69 $4. 94 $5. 60 $6. 04 $5. 73 YR/YR Change (%) 2009 -1. 9% 2010 3. 3% 2011 10. 4% 2012 5. 7% 2013 5. 2% 2014 13. 4% 2015 7. 8% 2016 -5. 0% COMPRE HENSIVE BOXED BEEF CUTOUT $/cwt $151. 05 $139. 53 $154. 24 $178. 71 $187. 95 $193. 18 $236. 02 $235. 25 $202. 22 IA/MN DIRECT STEER $/cwt $91. 39 $82. 44 $94. 25 $115. 02 $122. 70 $125. 80 $153. 84 $147. 24 $119. 54 IA 550 LB CALF $/cwt $122. 56 $112. 24 $130. 02 $150. 38 $169. 29 $173. 53 $253. 26 $253. 33 $168. 56 -7. 6% 10. 5% 15. 9% 5. 2% 2. 8% 22. 2% -0. 3% -14. 0% -9. 8% 14. 3% 22. 0% 6. 7% 2. 5% 22. 3% -4. 3% -18. 8% -8. 4% 15. 8% 15. 7% 12. 6% 2. 5% 45. 9% 0. 0% -33. 4% Source: USDA/ERS, USDA/AMS
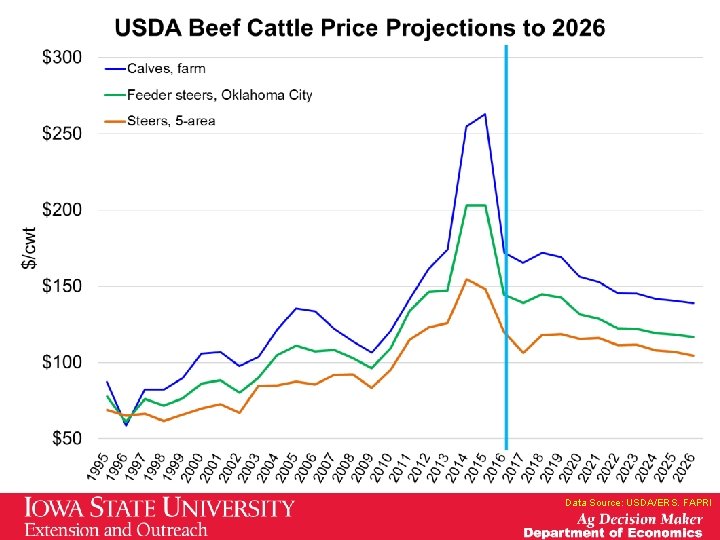
Data Source: USDA/ERS. FAPRI
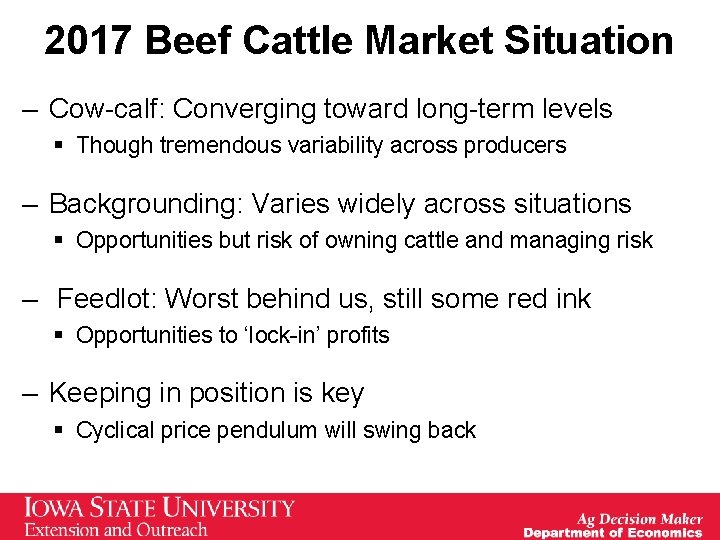
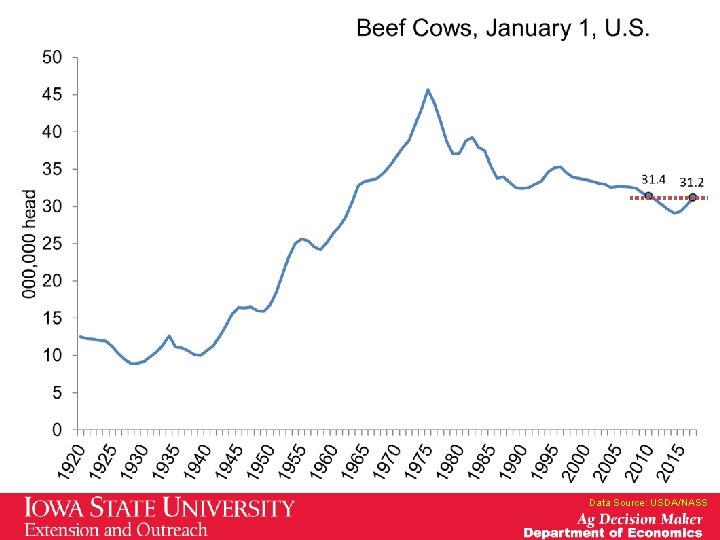
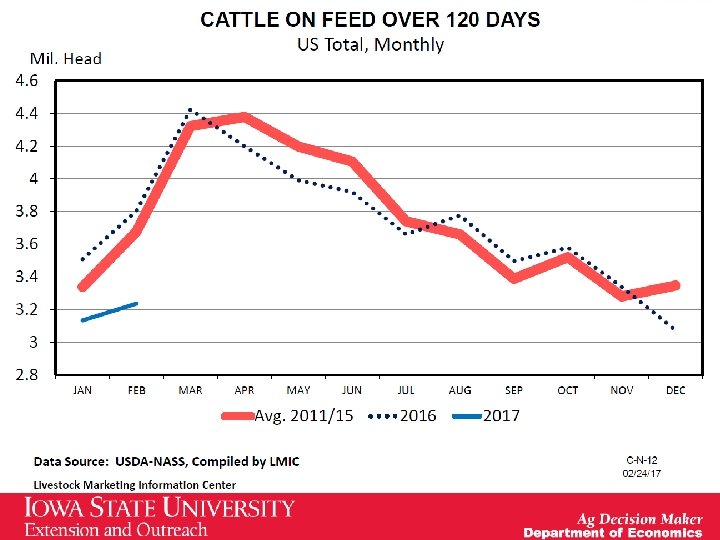
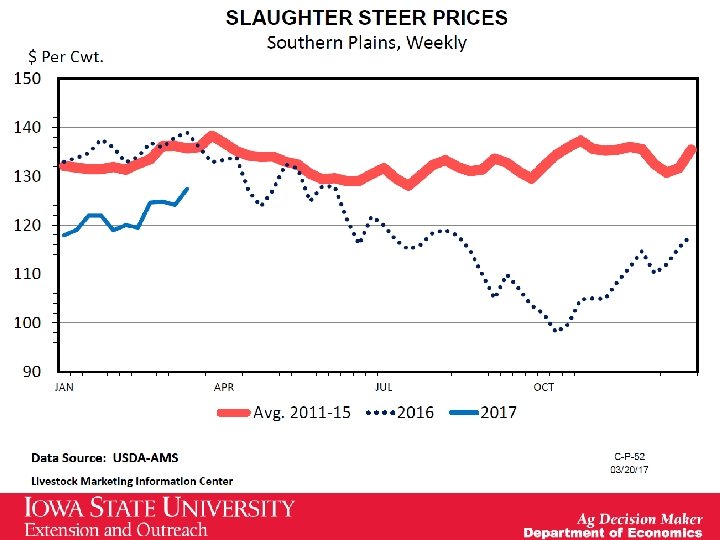
2017 Beef Cattle Market Situation – Cow-calf: Converging toward long-term levels § Though tremendous variability across producers – Backgrounding: Varies widely across situations § Opportunities but risk of owning cattle and managing risk – Feedlot: Worst behind us, still some red ink § Opportunities to ‘lock-in’ profits – Keeping in position is key § Cyclical price pendulum will swing back
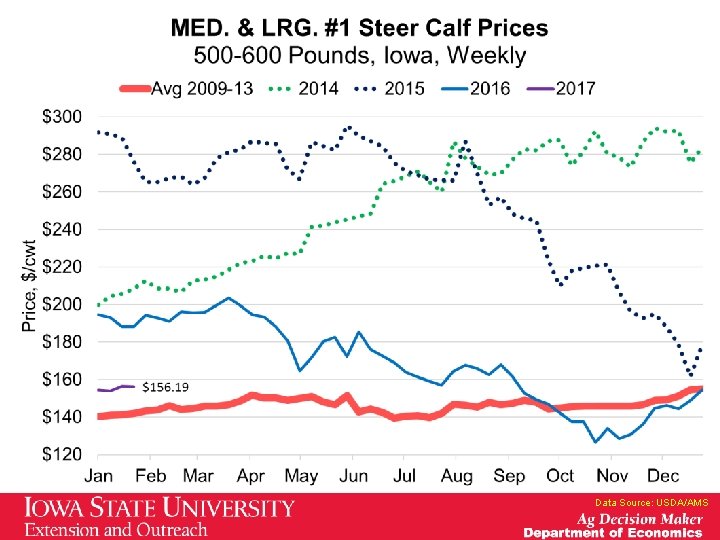
Data Source: USDA/AMS
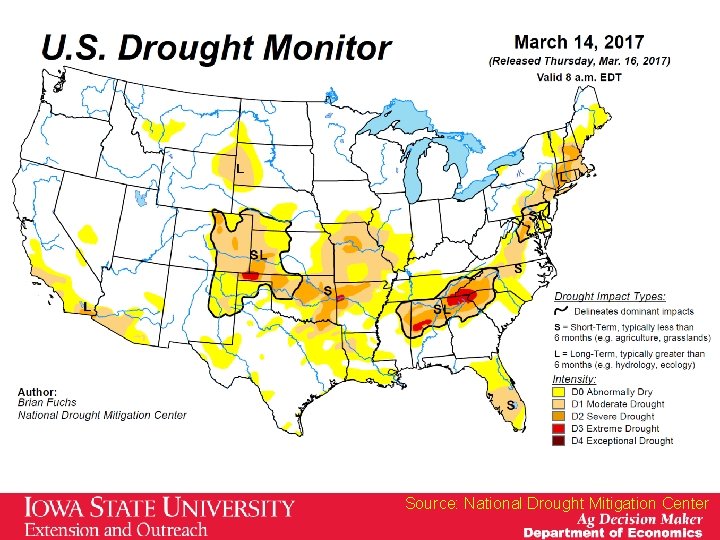
Source: National Drought Mitigation Center
Data Source: USDA/NASS
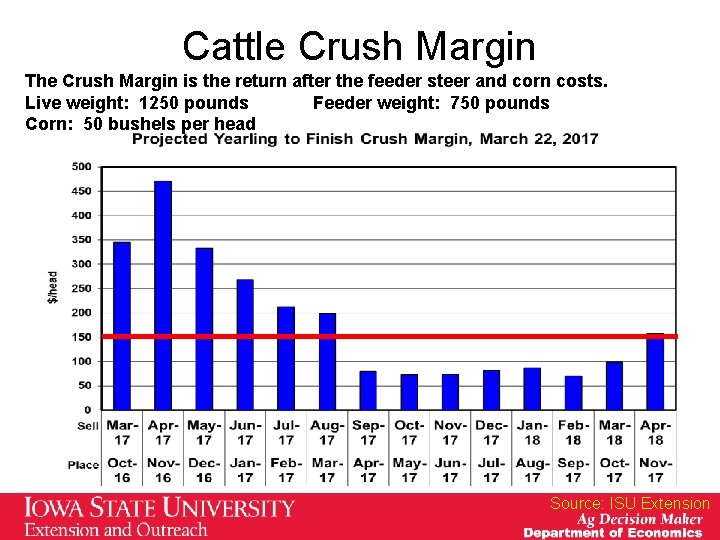
Cattle Crush Margin The Crush Margin is the return after the feeder steer and corn costs. Live weight: 1250 pounds Feeder weight: 750 pounds Corn: 50 bushels per head Source: ISU Extension
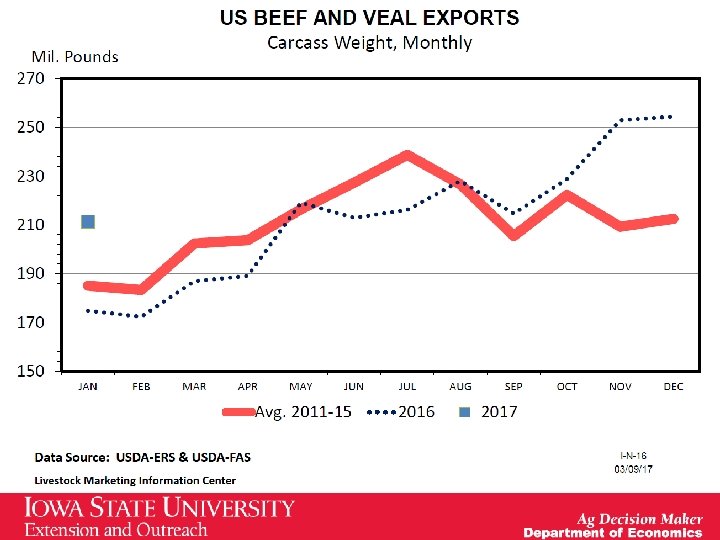
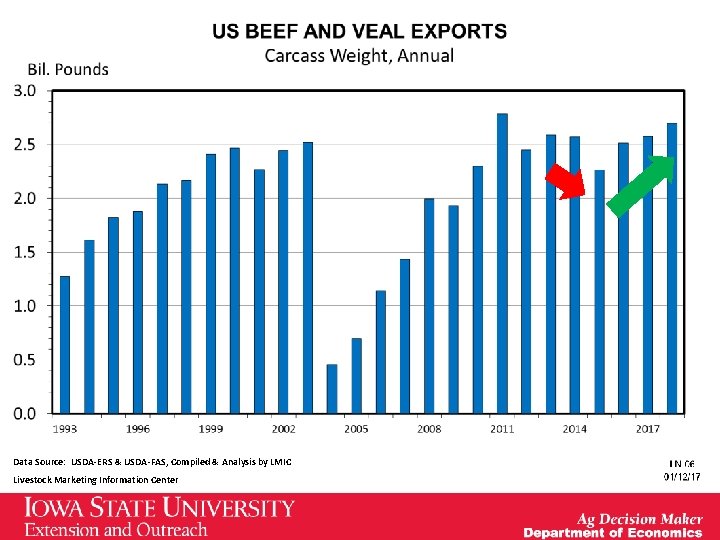
Data Source: USDA-ERS & USDA-FAS, Compiled & Analysis by LMIC Livestock Marketing Information Center
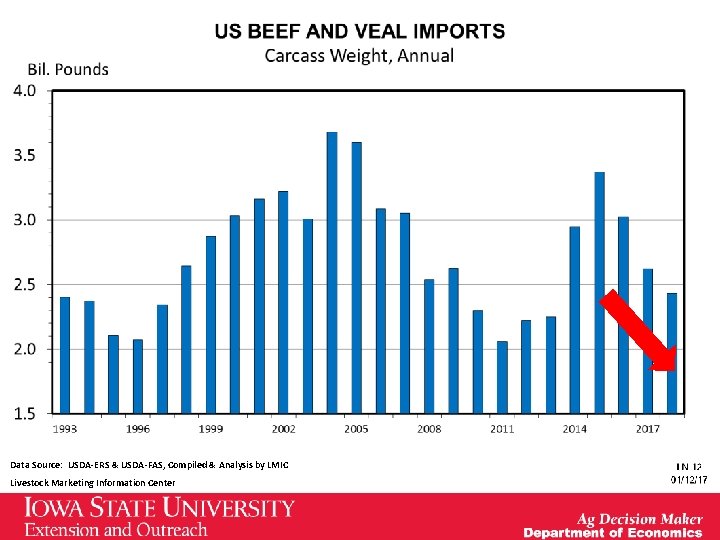
Data Source: USDA-ERS & USDA-FAS, Compiled & Analysis by LMIC Livestock Marketing Information Center
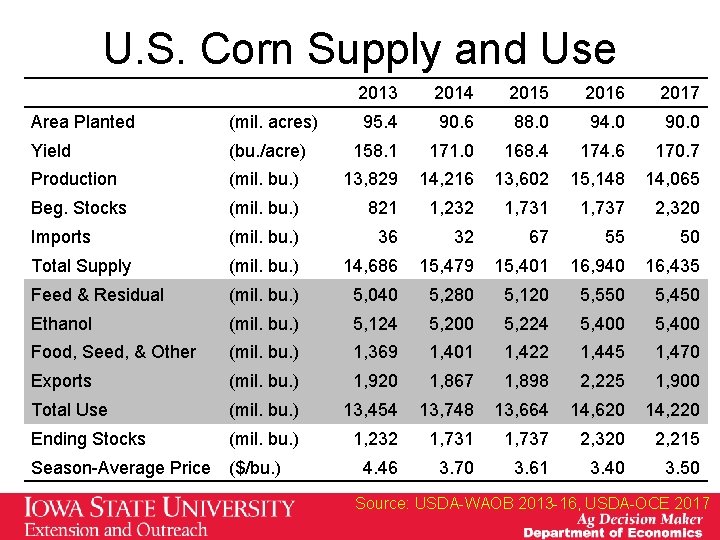
U. S. Corn Supply and Use 2013 2014 2015 2016 2017 95. 4 90. 6 88. 0 94. 0 90. 0 Area Planted (mil. acres) Yield (bu. /acre) 158. 1 171. 0 168. 4 174. 6 170. 7 Production (mil. bu. ) 13, 829 14, 216 13, 602 15, 148 14, 065 Beg. Stocks (mil. bu. ) 821 1, 232 1, 731 1, 737 2, 320 Imports (mil. bu. ) 36 32 67 55 50 Total Supply (mil. bu. ) 14, 686 15, 479 15, 401 16, 940 16, 435 Feed & Residual (mil. bu. ) 5, 040 5, 280 5, 120 5, 550 5, 450 Ethanol (mil. bu. ) 5, 124 5, 200 5, 224 5, 400 Food, Seed, & Other (mil. bu. ) 1, 369 1, 401 1, 422 1, 445 1, 470 Exports (mil. bu. ) 1, 920 1, 867 1, 898 2, 225 1, 900 Total Use (mil. bu. ) 13, 454 13, 748 13, 664 14, 620 14, 220 Ending Stocks (mil. bu. ) 1, 232 1, 731 1, 737 2, 320 2, 215 4. 46 3. 70 3. 61 3. 40 3. 50 Season-Average Price ($/bu. ) Source: USDA-WAOB 2013 -16, USDA-OCE 2017
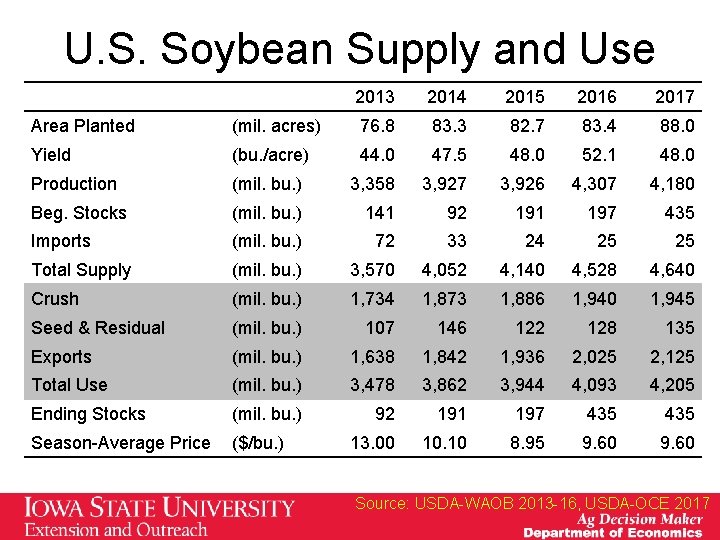
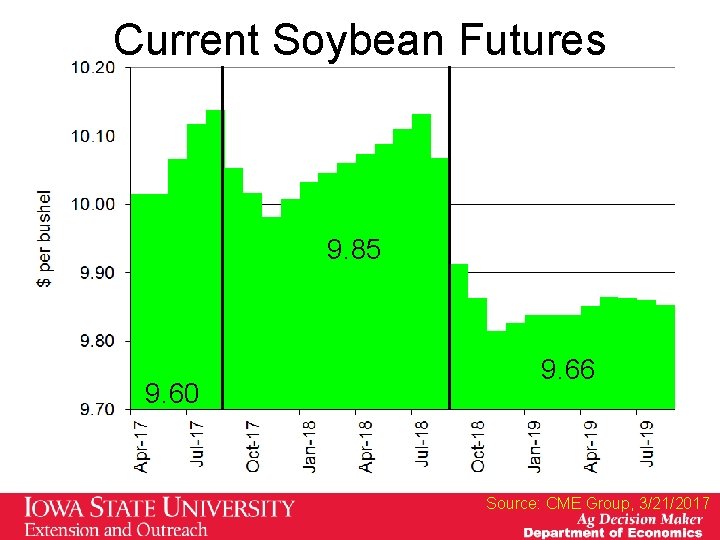
U. S. Soybean Supply and Use 2013 2014 2015 2016 2017 Area Planted (mil. acres) 76. 8 83. 3 82. 7 83. 4 88. 0 Yield (bu. /acre) 44. 0 47. 5 48. 0 52. 1 48. 0 Production (mil. bu. ) 3, 358 3, 927 3, 926 4, 307 4, 180 Beg. Stocks (mil. bu. ) 141 92 191 197 435 Imports (mil. bu. ) 72 33 24 25 25 Total Supply (mil. bu. ) 3, 570 4, 052 4, 140 4, 528 4, 640 Crush (mil. bu. ) 1, 734 1, 873 1, 886 1, 940 1, 945 Seed & Residual (mil. bu. ) 107 146 122 128 135 Exports (mil. bu. ) 1, 638 1, 842 1, 936 2, 025 2, 125 Total Use (mil. bu. ) 3, 478 3, 862 3, 944 4, 093 4, 205 Ending Stocks (mil. bu. ) 92 191 197 435 Season-Average Price ($/bu. ) 13. 00 10. 10 8. 95 9. 60 Source: USDA-WAOB 2013 -16, USDA-OCE 2017
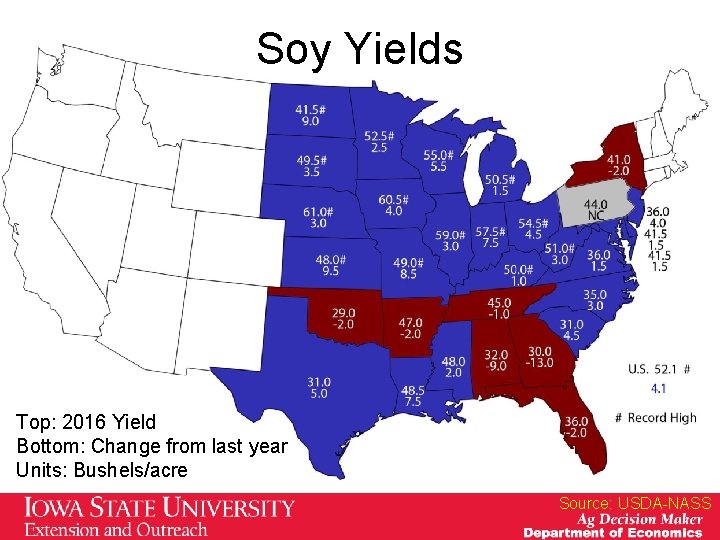
Soy Yields Top: 2016 Yield Bottom: Change from last year Units: Bushels/acre Source: USDA-NASS
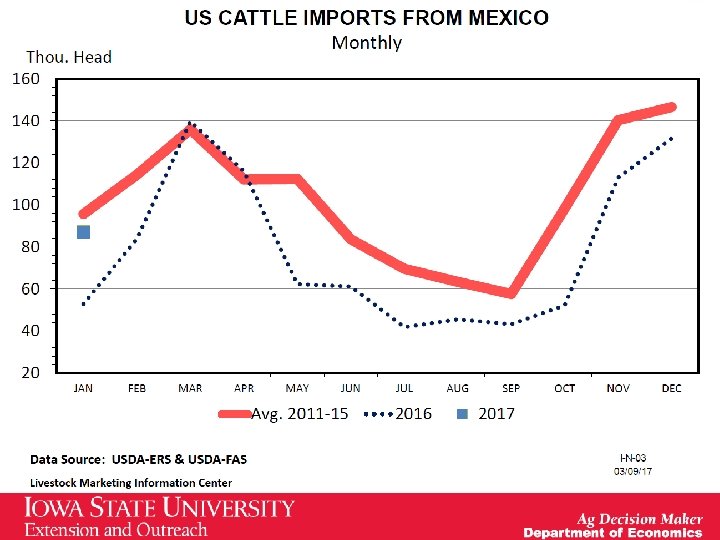
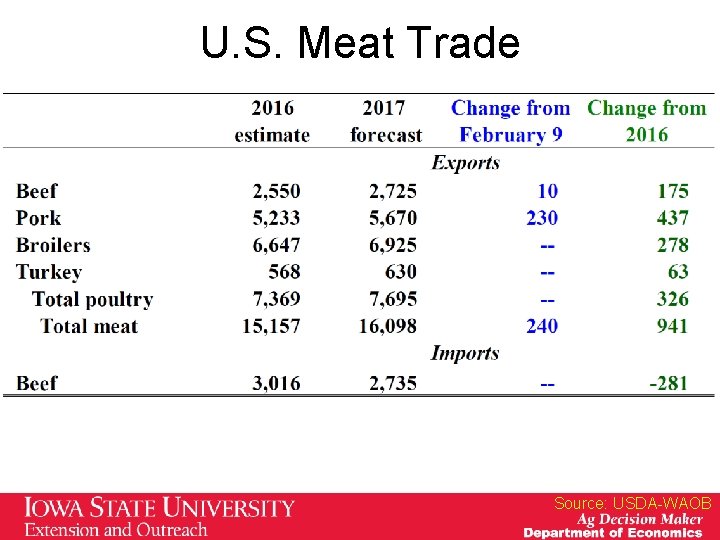
U. S. Meat Trade Source: USDA-WAOB
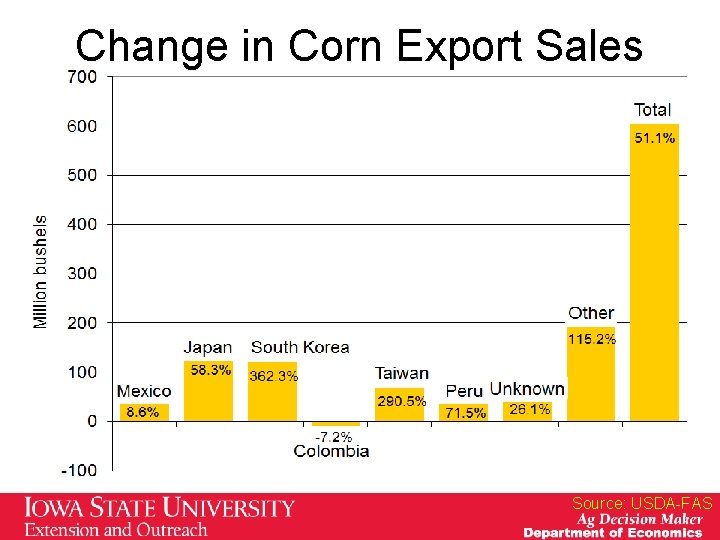
Change in Corn Export Sales Source: USDA-FAS
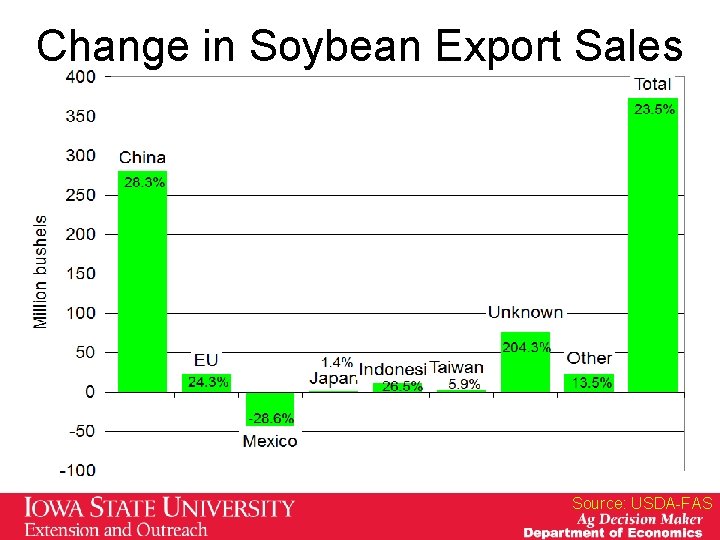
Change in Soybean Export Sales Source: USDA-FAS
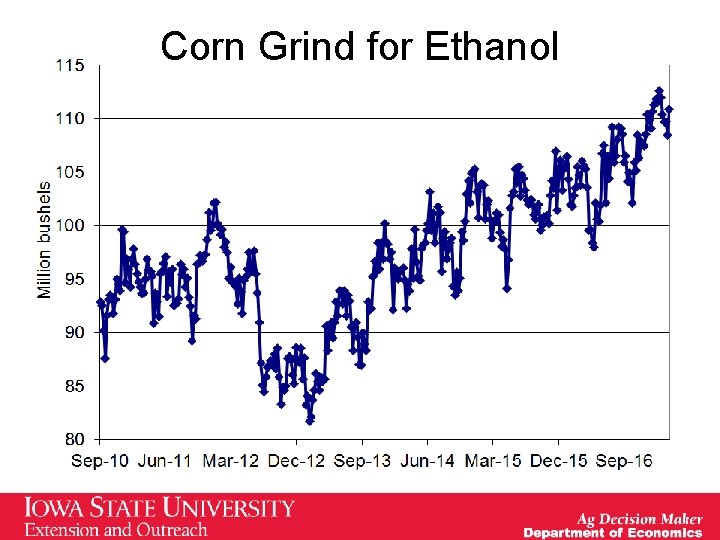
Corn Grind for Ethanol
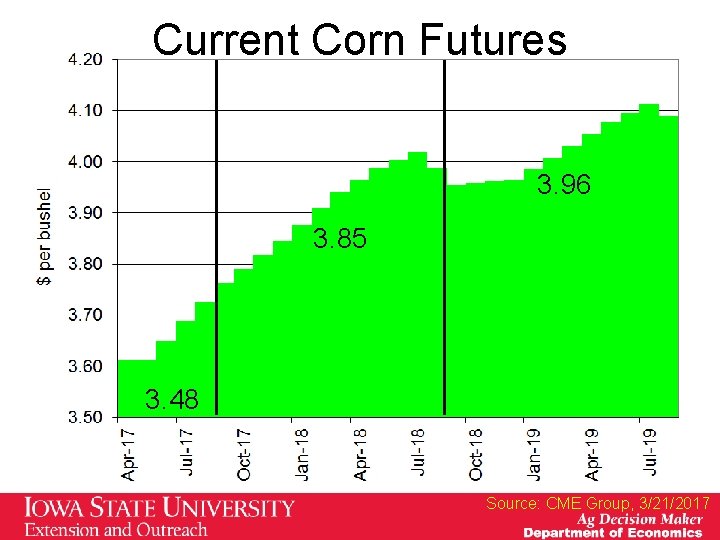
Current Corn Futures 3. 96 3. 85 3. 48 Source: CME Group, 3/21/2017
Current Soybean Futures 9. 85 9. 60 9. 66 Source: CME Group, 3/21/2017
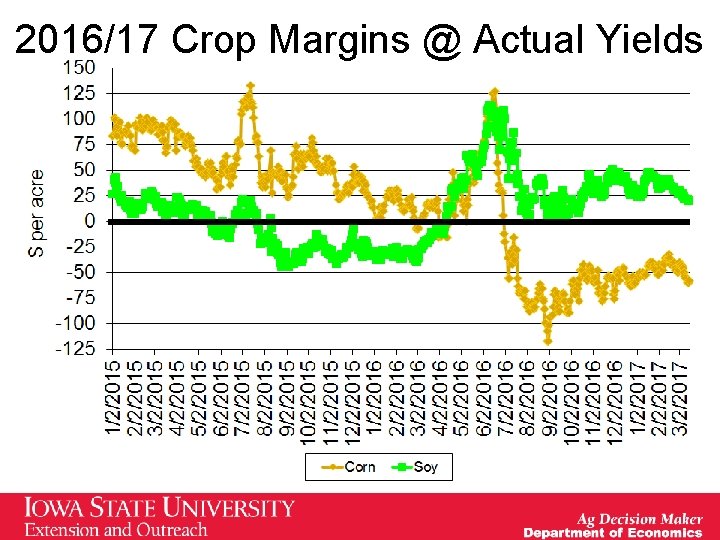
2016/17 Crop Margins @ Actual Yields
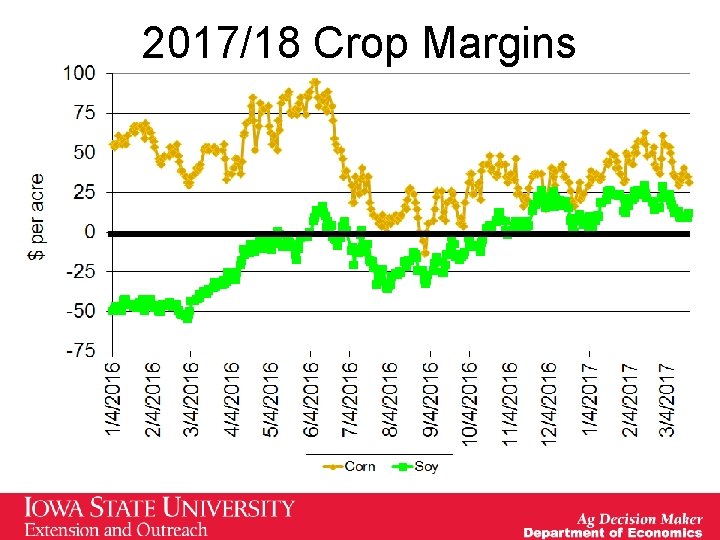
2017/18 Crop Margins
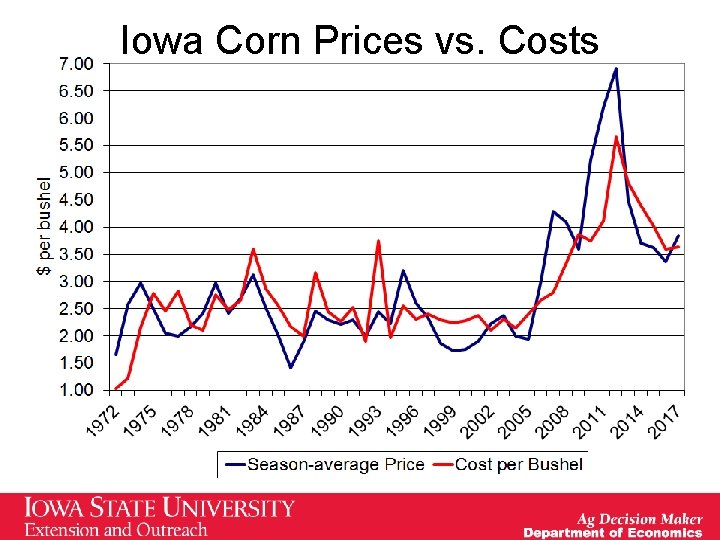
Iowa Corn Prices vs. Costs
Thank You! More information available at: Iowa Farm Outlook & News www. econ. iastate. edu/ifo/ Ag Decision Maker www. extension. iastate. edu/agdm/ ISU Estimated Livestock Returns www. econ. iastate. edu/estimated-returns/ ISU Livestock Crush Margins www. econ. iastate. edu/margins/ http: //www. iowabeefcenter. org/ http: //www. ipic. iastate. edu/