Pages 166 to 173 1 the light our


- Slides: 60

Pages 166 to 173 1

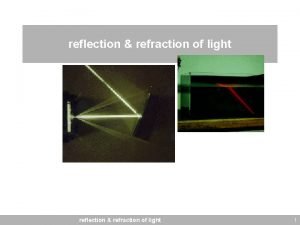
the light our eyes see is but a small part of a broad spectrum of electromagnetic radiation. On the high energy side of the visible spectrum lies the ultraviolet, and on the low energy side is the infrared. The portion of the infrared region most useful for analysis of organic compounds is that having a wavelength range from 2, 500 to 16, 000 nm Pages 166 to 173 2

Stretching and bending vibrations resulting from the absorption of infrared radiation Pages 166 to 173 3

Schematic diagram of an infrared spectrometer Pages 166 to 173 4

A typical infrared spectrum showing absorption peaks Pages 166 to 173 5

Gas Phase Infrared Spectrum of Formaldehyde, H 2 C=O Pages 166 to 173 6

Pages 166 to 173 7

Pages 166 to 173 8

INFRA-RED SPECTROSCOPY Chemical bonds vibrate at different frequencies. When infra red (IR) radiation is passed through a liquid sample of an organic molecule, some frequencies are absorbed. These correspond to the frequencies of the vibrating bonds. Most spectra are very complex due to the large number of bonds present and each molecule produces a unique spectrum. However the presence of certain absorptions can be used to identify functional groups. BOND O-H COMPOUND alcohols ABSORBANCE broad RANGE 3200 cm-1 to 3600 cm-1 O-H carboxylic acids medium to broad 2500 cm-1 to 3500 cm-1 C=O ketones, aldehydes esters and acids strong and sharp 1600 cm-1 to 1750 cm-1 Pages 166 to 173 9

INFRA-RED SPECTROSCOPY IDENTIFYING ALCOHOLS USING INFRA RED SPECTROSCOPY Differentiation Compound O-H C=O ALCOHOL YES NO NO YES YES NO YES ALDEHYDE / KETONE CARBOXYLIC ACID ESTER ALCOHOL PROPAN-1 -OL O-H absorption ALDEHYDE PROPANAL C=O absorption Pages 166 to 173 CARBOXYLIC ACID PROPANOIC ACID O-H + C=O absorption 10

propanone Pages 166 to 173 11

propanal Pages 166 to 173 12

methyl 4 -hydroxybenzoate Pages 166 to 173 13

What is the fingerprint region This is a typical infra-red spectrum: The region to the right-hand side of the diagram (from about 1500 to 500 cm-1) usually contains a very complicated series of absorptions. These are mainly due to all manner of bending vibrations within the molecule. This is called the fingerprint Pages 166 toregion. 173 14

Using the fingerprint region Compare the infra-red spectra of propan-1 -ol and propan-2 -ol. Both compounds contain exactly the same bonds. Both compounds have very similar troughs in the area around 3000 cm-1 - but compare them in the fingerprint region between 1500 and 500 cm-1. Pages 166 to 173 15

Pages 166 to 173 16

The pattern in the fingerprint region is completely different and could therefore be used to identify the compound. So. . . to positively identify an unknown compound, use its infra-red spectrum to identify what sort of compound it is by looking for specific bond absorptions. That might tell you, for example, that you had an alcohol because it contained an -OH group. You would then compare the fingerprint region of its infra-red spectrum with known spectra measured under exactly the same conditions to find out which Pages 166 to 173 17 alcohol (or whatever) you had.

ethyl ethanoate Pages 166 to 173 18

chloroethane Pages 166 to 173 19

names ethanol (ethyl alcohol) formula CH 3 CH 2 OH composition C 52. 17%; H 13. 04%; O 34. 78% description Colourless liquid that mixes completely with water to form a neutral solution Mr 46 Tm 156 K (-117 °C) Tb 352 K (79 °C) Pages 166 to 173 20

names ethanoic acid (acetic acid) formula CH 3 COOH composition C 40. 00%; H 6. 67%; O 53. 33% description Colourless liquid that mixes with water to produce a weakly acidic solution Mr 60 Tm 290 K (17 °C) Tb 391 K (118 °C Pages 166 to 173 21

names methylbenzene (toluene) formula CH 3 C 6 H 5 composition C 91. 30%; H 8. 70% description Colourless, flammable liquid that burns with a smoky flame. Immiscible with water. Mr 92 Tm 178 K (-95 °C) Tb 384 K (111 °C Pages 166 to 173 22

Infrared spectrum of methanol © Pearson Education Ltd 2008 This document may have been altered from the original Pages 166 to 173 23

Infrared spectrum of propanal © Pearson Education Ltd 2008 This document may have been altered from the original Pages 166 to 173 24

Infrared spectrum of propanoic acid © Pearson Education Ltd 2008 This document may have been altered from the original Pages 166 to 173 25

Pages 166 to 173 26

Pages 166 to 173 27

Pages 166 to 173 28

Mass spectrometry Knowledge of the mass spectrometer is not required. • Limited to ions with single charges. • Rearrangement reactions are not required. • Mass spectra limited to alkanes, alkenes and alcohols. outline the use of mass spectrometry: • in the determination of relative isotopic masses, • as a method for identifying elements, ie use in the Mars space probe and in monitoring levels of environmental pollution, such as lead; • interpret mass spectra of elements in terms of isotopic abundances; • use the molecular ion peak in a mass spectrum of an organic molecule to • determine its molecular mass; • suggest the identity of the major fragment ions, ie m/z = 29 as CH 3 CH 2+, in a given mass spectrum (limited to alkanes, alkenes and alcohols); • use molecular ion peaks and fragmentation peaks to identify structures (limited to uni positive ions – single positive charge ions); • explain that a mass spectrum is essentially a fingerprint for the molecule that can be identified by computer using a spectral database. Pages 166 to 173 29

An outline of what happens in a mass spectrometer Atoms can be deflected by magnetic fields - provided the atom is first turned into an ion. Electrically charged particles are affected by a magnetic field Pages 166 to 173 30

THE MASS SPECTRA OF ELEMENTS The mass spectrum of monatomic elements Monatomic elements - one atom. The mass spectrum for boron Pages 166 to 173 boron-10 23 boron-11 100 31

the two isotopes (with their relative abundances) are: boron-10 23 boron-11 100 Working out the relative atomic mass The relative atomic mass (RAM) of an element is given the symbol Ar A "weighted average" allows for the fact that there won't be equal amounts of the various isotopes. Suppose you had 123 typical atoms of boron. 23 of these would be 10 B and 100 would be 11 B. The total mass of these would be (23 x 10) + (100 x 11) = 1330 The average mass of these 123 atoms would be 1330 / 123 = 10. 8 (to 3 significant figures). 10. 8 is the relative atomic mass of boron Pages 166 to 173 32

The mass spectrum of magnesium Pages 166 to 173 33

The mass spectrum for zirconium The number of isotopes The 5 peaks in the mass spectrum shows that there are 5 isotopes of zirconium with relative isotopic masses of 90, 91, 92, 94 and 96 on the 12 C scale. zirconium-90 51. 5 zirconium-91 11. 2 zirconium-92 17. 1 zirconium-94 17. 4 zirconium-96 2. 8 Pages 166 to 173 34

The abundance of the isotopes the 5 isotopes (with their relative percentage abundances) are: zirconium-90 51. 5 zirconium-91 11. 2 zirconium-92 17. 1 zirconium-94 17. 4 zirconium-96 2. 8 Working out the relative atomic mass Suppose you had 100 typical atoms of zirconium. 51. 5 of these would be 91 Zr and so on. 90 Zr, 11. 2 The total mass of these 100 typical atoms would be (51. 5 x 90) + (11. 2 x 91) + (17. 1 x 92) + (17. 4 x 94) + (2. 8 x 96) = 9131. 8 The average mass of these 100 atoms would be 9131. 8 / 100 = 91. 3 (to 3 significant figures). 91. 3 is the relative atomic mass of zirconium Pages 166 to 173 35

The mass spectrum of chlorine Pages 166 to 173 36

• Use the molecular ion peak in an organic molecule’s mass spectrum to determine its molecular mass. • Explain that a mass spectrum is essentially a molecule’s fingerprint that can be identified using a spectral database. Pages 166 to 173 37

Mass spectrum of ethanol Pages 166 to 173 38

Week 20 Mass spectra of the isomers of C 5 H 12, pentane and 2 -methylbutane Pages 166 to 173 39 © Pearson Education Ltd 2008 This document may have been altered from the original

Week 20 Spectra A and B Pages 166 to 173 40 © Pearson Education Ltd 2008 This document may have been altered from the original

• Suggest the identity of the major fragment ions in a given mass spectrum. • Use molecular ion peaks and fragmentation peaks to identify structures. Pages 166 to 173 41

Pages 166 to 173 42

What causes the line at m/z = 57? How many carbon atoms are there in this ion? There can't be 5 because 5 x 12 = 60. What about 4? 4 x 12 = 48. That leaves 9 to make up a total of 57. How about C 4 H 9+ then? C 4 H 9+ would be [CH 3 CH 2 CH 2]+, this would be produced by the following fragmentation: The line at m/z = 43 can be worked out similarly. The line at m/z = 29 is typical of an ethyl ion, [CH 3 CH 2]+: Pages 166 to 173 43

Equations explaining how some of the peaks arise in the mass spectrum for hexane Pages 166 to 173 44 © Pearson Education Ltd 2008 This document may have been altered from the original

Mass spectrum for an unknown alkane Pages 166 to 173 45 © Pearson Education Ltd 2008 This document may have been altered from the original

Common Small Ions m/z composition 34 H 2 S 35(37) Cl 36(38) HCl 39 C 3 H 3 41 C 3 H 5, C 2 H 3 N C 2 H 2, CN 42 C 3 H 6, C 2 H 2 O, C 2 H 4 N 27 C 2 H 3 43 C 3 H 7, CH 3 CO 28 C 2 H 4, CO, H 2 CN 44 C 2 H 4 O 29 C 2 H 5, CHO 46 NO 2 30 CH 2 NH 2 56 C 4 H 8 31 CH 3 O 57 C 4 H 9 33 SH, CH 2 F 60 CH 4 CO 2 15 CH 3 17 OH 18 H 2 O 19 H 3 O, F 26 79(81) Br 80(82) HBr 91 C 7 H 7 127 I 128 HI Pages 166 to 173 46

Mass spectrum of pent-1 -ene Pages 166 to 173 47 © Pearson Education Ltd 2008 This document may have been altered from the original

Mass spectrum of an alkane Pages 166 to 173 48 © Pearson Education Ltd 2008 This document may have been altered from the original

C and H only – identify peaks / fragments Pages 166 to 173 49

Pages 166 to 173 50

Pages 166 to 173 51

Pages 166 to 173 52

Pages 166 to 173 53

Pages 166 to 173 54

Pages 166 to 173 55

Pages 166 to 173 56

Pages 166 to 173 57

Pages 166 to 173 58

Pages 166 to 173 59

Pages 166 to 173 60
 Printed pages vs web pages
 Words to christ be our light
 Light light light chapter 22
 Light light light chapter 22
 Light light light chapter 23
 Ley general del ambiente
 Fas 166/167
 Soneto clxvi
 Cecati 166
 Navoiy shahar 12-maktab
 Opwekking 627
 In which set does −173 belong?
 Cps 173
 Cs 173
 Cps 173
 Cps 173
 Cs 173
 Konstitutsiya bayramida mavzusida matn tuzish
 Logo smpn 173 jakarta
 Articulo 173 de la lottt
 Cs 173 uiuc
 Pg 173
 Cps 173
 Cps 173
 173-mashq
 Fluke 173
 574-173-443
 Cps 173
 Universiti teknologi mara akta 173
 Cps 173
 Cs 173
 Cs 173
 Uiuc cs 173
 Retrodatazione scissione
 Cps 173
 Cs 173
 Our awareness of ourselves and our environment
 Our future is in our hands quotes
 Thinking affects our language which then affects our
 Our census our future
 Our awareness of ourselves and our environment
 Awareness of ourselves and our environment
 Our census our future
 Our life is what our thoughts make it
 Awareness of ourselves and our environment is:
 Marcus aurelius our life is what our thoughts make it
 Money madness poem is written by
 God our father christ our brother
 We bow our hearts
 The deliverer tishani doshi
 The visible light we see from our sun comes from which part
 Primary source of light *
 Christ be our light
 The weight of glory summary
 All light is blocked by the material
 Put out the light then put out the light
 Difference between light dependent and light independent
 Bouncing off of light
 Cách giải mật thư tọa độ
 Sự nuôi và dạy con của hươu
 Tư thế worm breton là gì

