
Free Trade Agreement Theory and Practice ChongSup Kim

- Slides: 41
Free Trade Agreement -Theory and Practice. Chong-Sup Kim
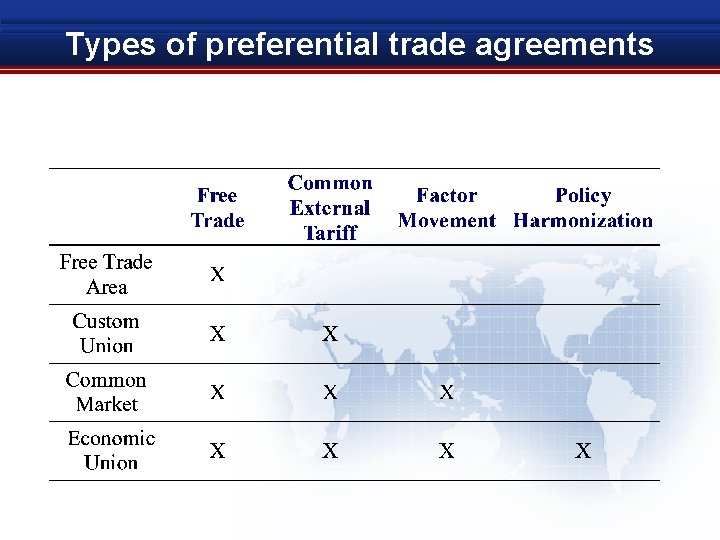
Types of preferential trade agreements
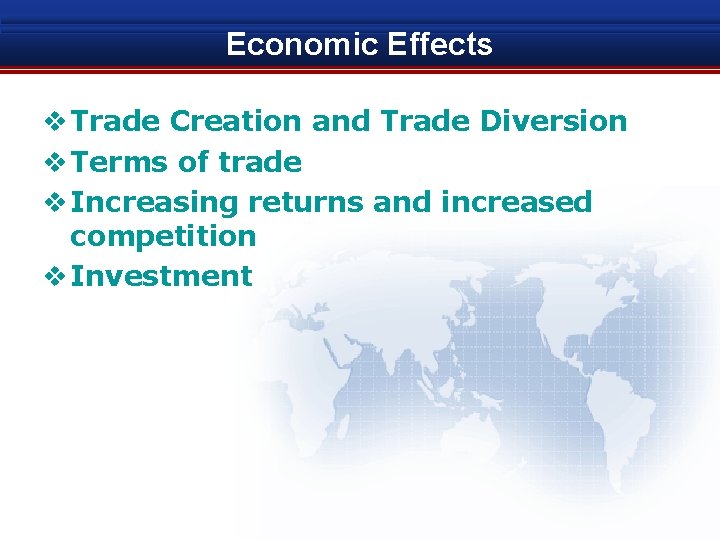
Economic Effects v Trade Creation and Trade Diversion v Terms of trade v Increasing returns and increased competition v Investment
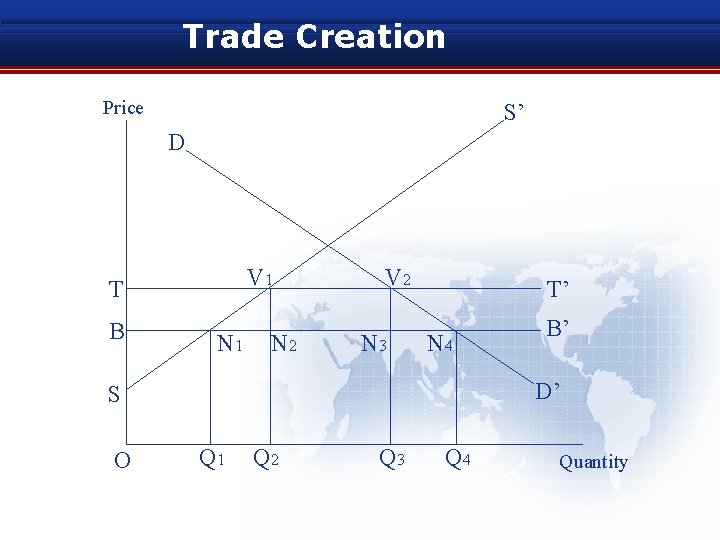
Trade Creation v Efficient production of B replaces inefficient domestic production.
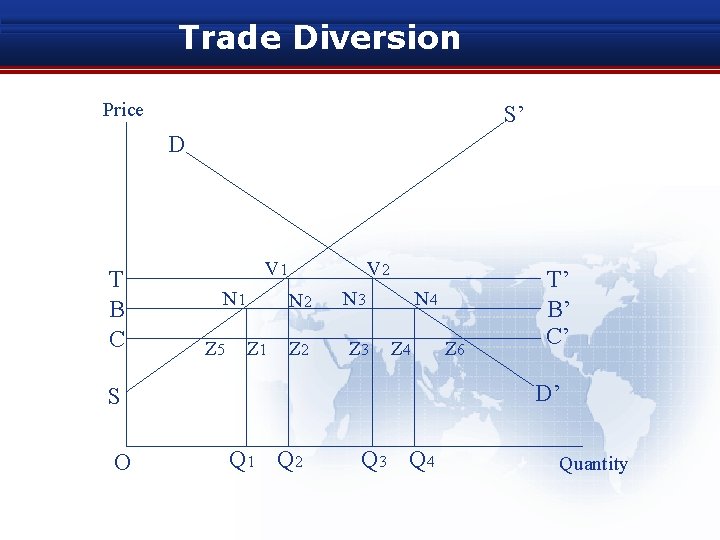
Trade Diversion v Inefficient production of B replaces efficient production of C.
Trade Creation Price S’ D V 1 T B N 1 N 2 V 2 N 3 T’ N 4 D’ S O B’ Q 1 Q 2 Q 3 Q 4 Quantity
Trade Diversion Price S’ D T B C V 1 N 1 Z 5 Z 1 V 2 N 3 Z 2 Z 3 N 4 Z 4 D’ S O Z 6 T’ B’ C’ Q 1 Q 2 Q 3 Q 4 Quantity
IR(intra-regional exports/total exports) and Share of RI scheme in total world exports
Economic Effects of Korea-Peru FTA
- Contents - 1. Overview of the Peruvian Economy 2. Characteristics of the Peruvian Economy 3. Economic Relation between Korea and Peru 4. Economic Effects of Korea-Peru FTA
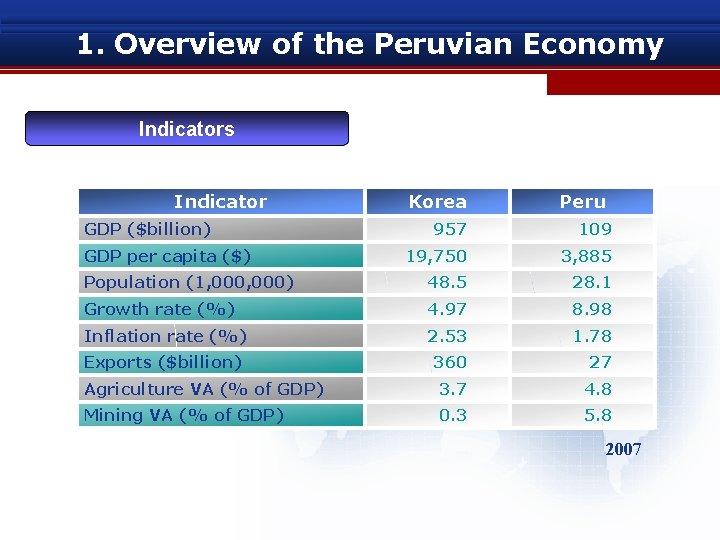
1. Overview of the Peruvian Economy Indicators Indicator GDP ($billion) Korea Peru 957 109 19, 750 3, 885 Population (1, 000) 48. 5 28. 1 Growth rate (%) 4. 97 8. 98 Inflation rate (%) 2. 53 1. 78 Exports ($billion) 360 27 Agriculture VA (% of GDP) 3. 7 4. 8 Mining VA (% of GDP) 0. 3 5. 8 GDP per capita ($) 2007
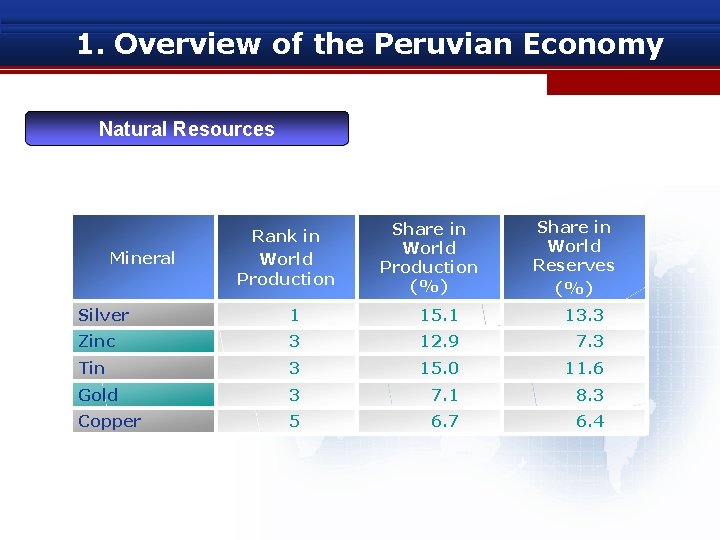
1. Overview of the Peruvian Economy Natural Resources Mineral Rank in World Production Share in World Production (%) Share in World Reserves (%) Silver 1 15. 1 13. 3 Zinc 3 12. 9 7. 3 Tin 3 15. 0 11. 6 Gold 3 7. 1 8. 3 Copper 5 6. 7 6. 4
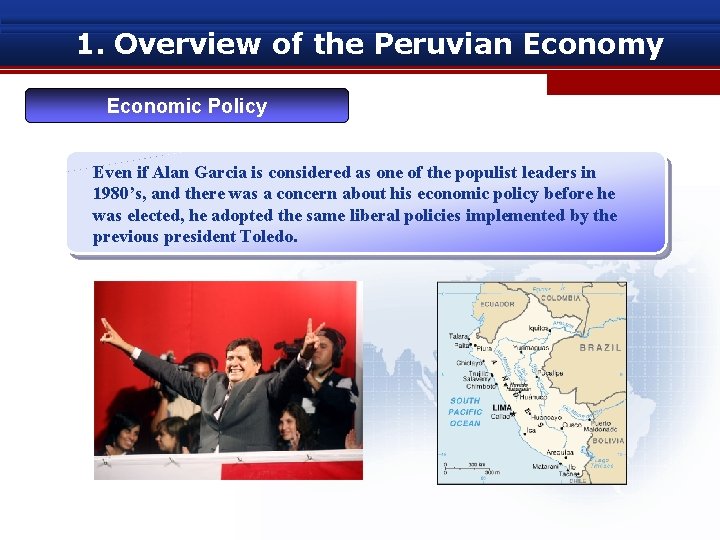
1. Overview of the Peruvian Economy Economic Policy Even if Alan Garcia is considered as one of the populist leaders in 1980’s, and there was a concern about his economic policy before he was elected, he adopted the same liberal policies implemented by the previous president Toledo.
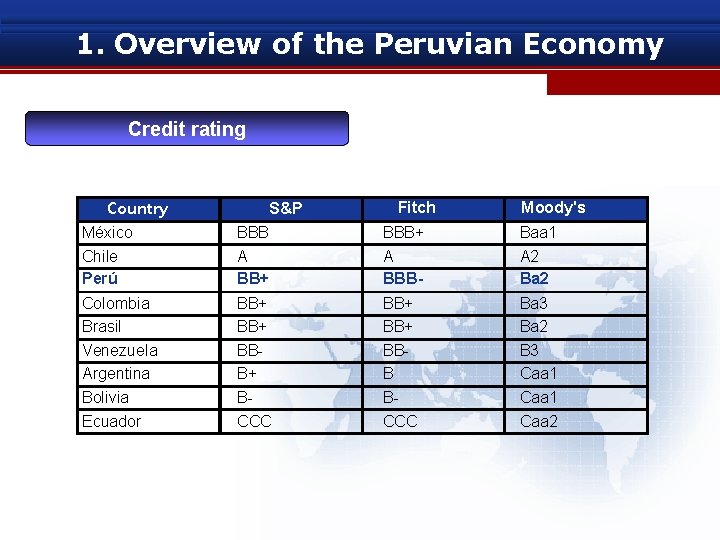
1. Overview of the Peruvian Economy Credit rating Country S&P Fitch Moody's México Chile Perú BBB A BB+ BBB+ A BBB- Baa 1 A 2 Ba 2 Colombia Brasil Venezuela Argentina Bolivia Ecuador BB+ BBB+ BCCC BB+ BBB BCCC Ba 3 Ba 2 B 3 Caa 1 Caa 2
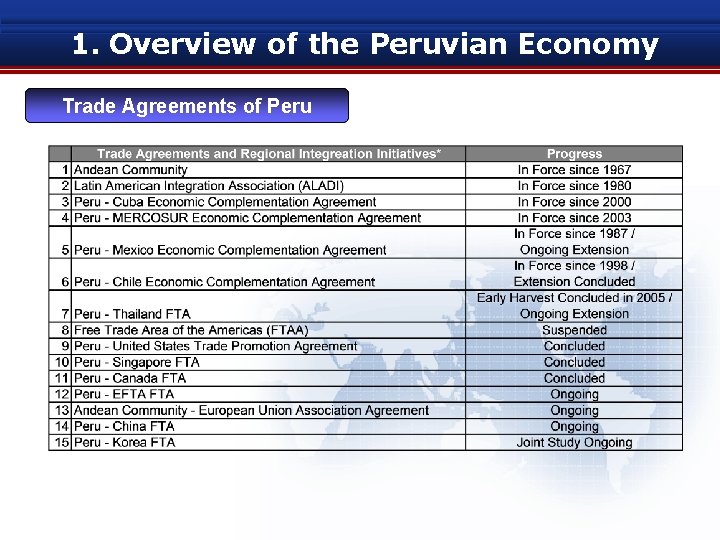
1. Overview of the Peruvian Economy Trade Agreements of Peru
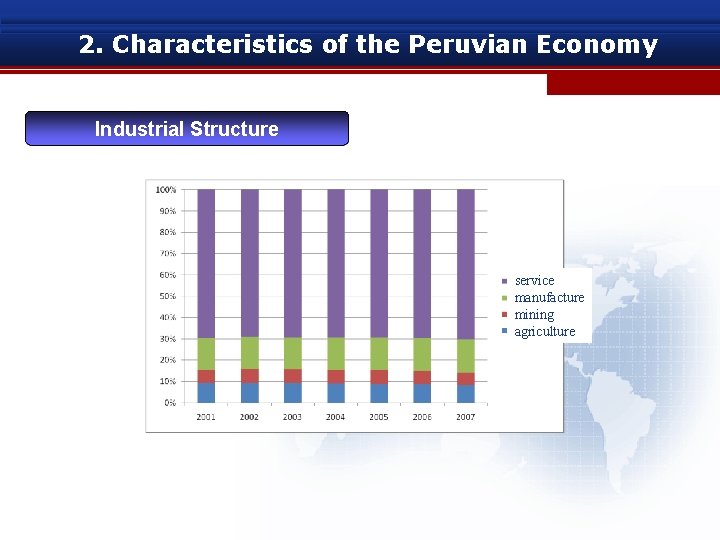
2. Characteristics of the Peruvian Economy Industrial Structure service manufacture mining agriculture
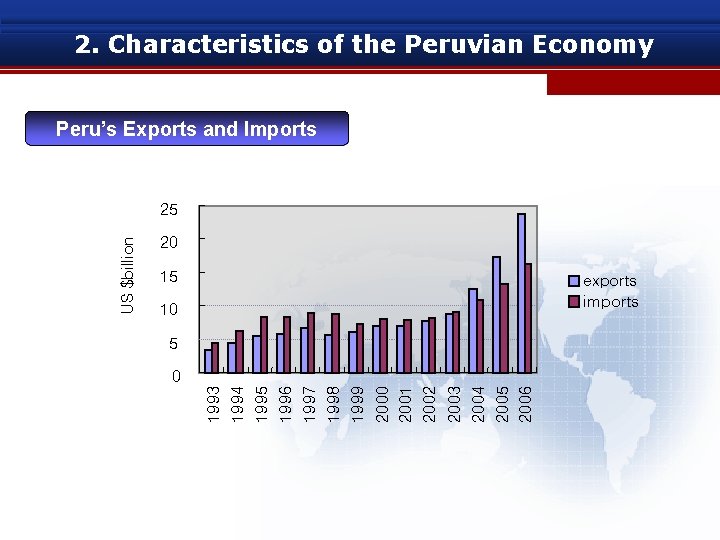
2. Characteristics of the Peruvian Economy Peru’s Exports and Imports 20 15 exports imports 10 5 2003 2004 2005 2006 2000 2001 2002 1996 1997 1998 1999 0 1993 1994 1995 US $billion 25
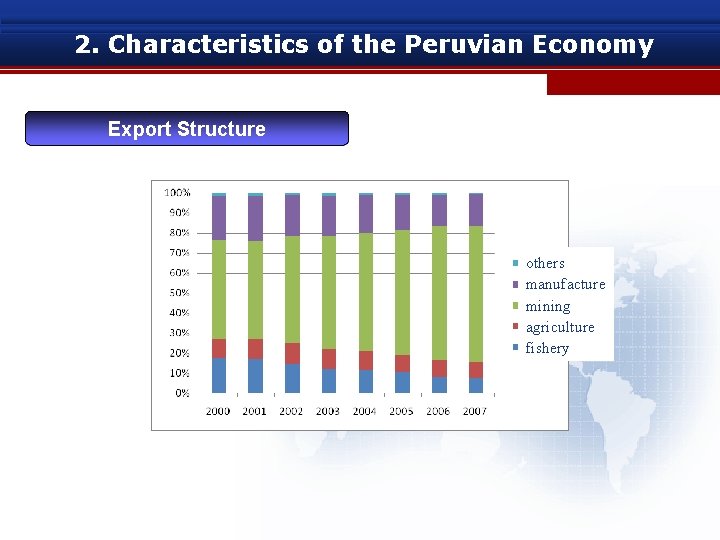
2. Characteristics of the Peruvian Economy Export Structure others manufacture mining agriculture fishery
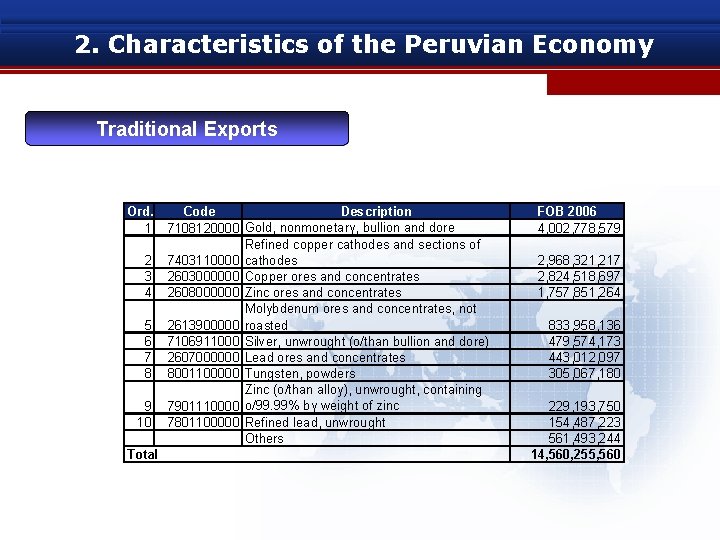
2. Characteristics of the Peruvian Economy Traditional Exports Ord. 1 2 3 4 5 6 7 8 9 10 Total Code Description 7108120000 Gold, nonmonetary, bullion and dore Refined copper cathodes and sections of 7403110000 cathodes 2603000000 Copper ores and concentrates 2608000000 Zinc ores and concentrates Molybdenum ores and concentrates, not 2613900000 roasted 7106911000 Silver, unwrought (o/than bullion and dore) 2607000000 Lead ores and concentrates 8001100000 Tungsten, powders Zinc (o/than alloy), unwrought, containing 7901110000 o/99. 99% by weight of zinc 7801100000 Refined lead, unwrought Others FOB 2006 4, 002, 778, 579 2, 968, 321, 217 2, 824, 518, 697 1, 757, 851, 264 833, 958, 136 479, 574, 173 443, 012, 097 305, 067, 180 229, 193, 750 154, 487, 223 561, 493, 244 14, 560, 255, 560
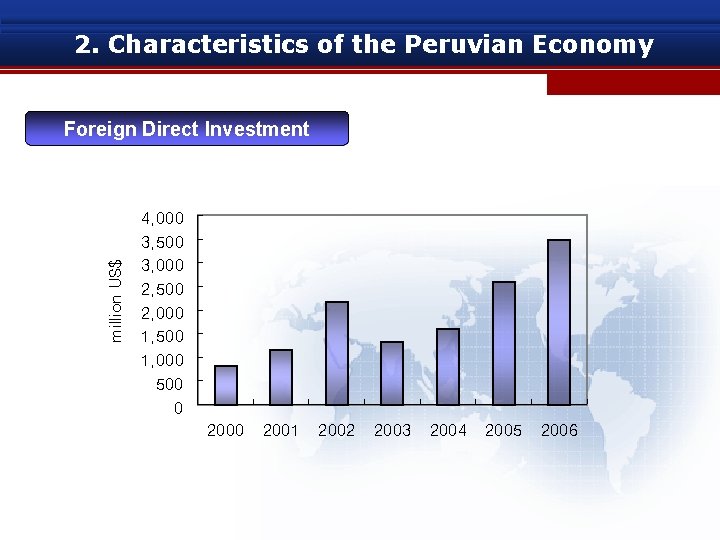
2. Characteristics of the Peruvian Economy Foreign Direct Investment million US$ 4, 000 3, 500 3, 000 2, 500 2, 000 1, 500 1, 000 500 0 2001 2002 2003 2004 2005 2006
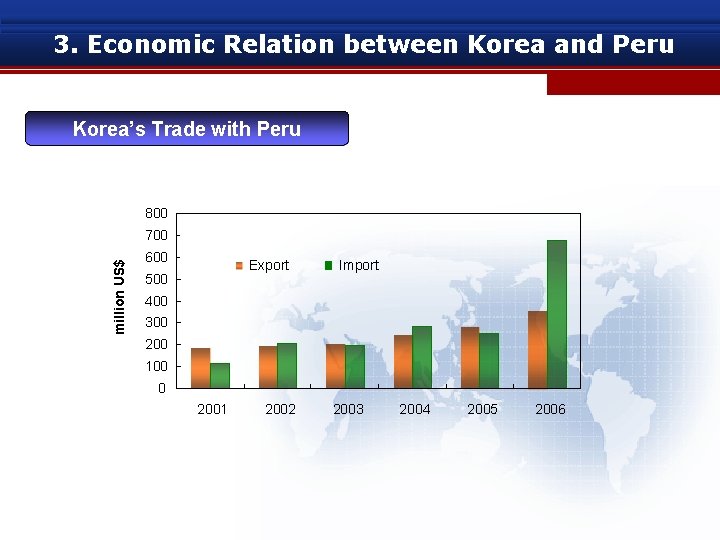
3. Economic Relation between Korea and Peru Korea’s Trade with Peru 800 million US$ 700 600 Export 500 Import 400 300 200 100 0 2001 2002 2003 2004 2005 2006
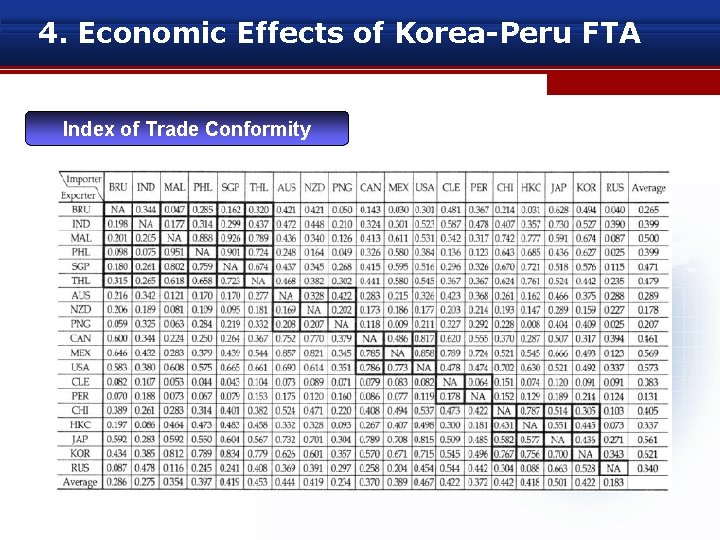
3. Economic Relation between Korea and Peru Korea-Peru Trade Intensity Index
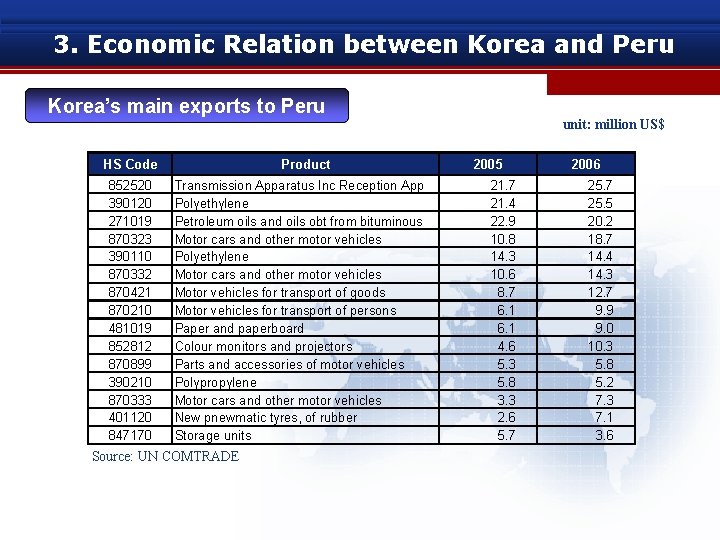
3. Economic Relation between Korea and Peru Korea’s main exports to Peru HS Code 852520 390120 271019 870323 390110 870332 870421 870210 481019 852812 870899 390210 870333 401120 847170 Product Transmission Apparatus Inc Reception App Polyethylene Petroleum oils and oils obt from bituminous Motor cars and other motor vehicles Polyethylene Motor cars and other motor vehicles Motor vehicles for transport of goods Motor vehicles for transport of persons Paper and paperboard Colour monitors and projectors Parts and accessories of motor vehicles Polypropylene Motor cars and other motor vehicles New pnewmatic tyres, of rubber Storage units Source: UN COMTRADE unit: million US$ 2005 21. 7 21. 4 22. 9 10. 8 14. 3 10. 6 8. 7 6. 1 4. 6 5. 3 5. 8 3. 3 2. 6 5. 7 2006 25. 7 25. 5 20. 2 18. 7 14. 4 14. 3 12. 7 9. 9 9. 0 10. 3 5. 8 5. 2 7. 3 7. 1 3. 6
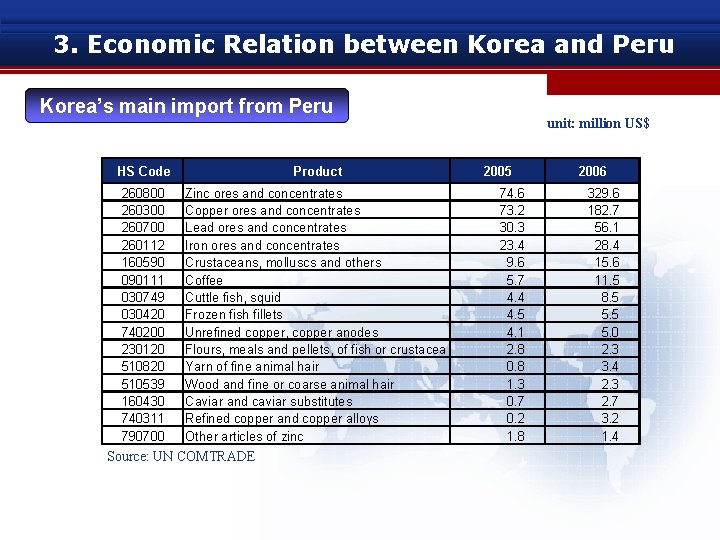
3. Economic Relation between Korea and Peru Korea’s main import from Peru HS Code Product 260800 260300 260700 260112 160590 090111 030749 030420 740200 230120 510820 510539 160430 740311 790700 Zinc ores and concentrates Copper ores and concentrates Lead ores and concentrates Iron ores and concentrates Crustaceans, molluscs and others Coffee Cuttle fish, squid Frozen fish fillets Unrefined copper, copper anodes Flours, meals and pellets, of fish or crustacea Yarn of fine animal hair Wood and fine or coarse animal hair Caviar and caviar substitutes Refined copper and copper alloys Other articles of zinc Source: UN COMTRADE unit: million US$ 2005 74. 6 73. 2 30. 3 23. 4 9. 6 5. 7 4. 4 4. 5 4. 1 2. 8 0. 8 1. 3 0. 7 0. 2 1. 8 2006 329. 6 182. 7 56. 1 28. 4 15. 6 11. 5 8. 5 5. 0 2. 3 3. 4 2. 3 2. 7 3. 2 1. 4
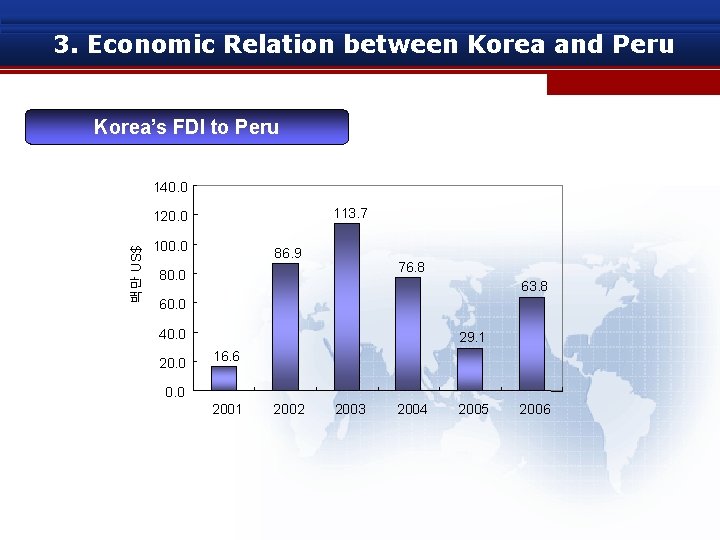
3. Economic Relation between Korea and Peru Korea’s FDI to Peru 140. 0 113. 7 백만 US$ 120. 0 100. 0 86. 9 76. 8 80. 0 63. 8 60. 0 40. 0 29. 1 16. 6 0. 0 2001 2002 2003 2004 2005 2006
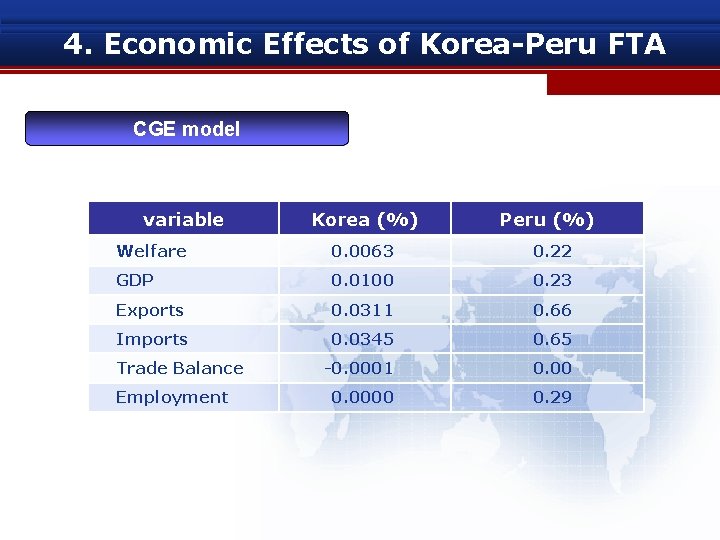
4. Economic Effects of Korea-Peru FTA CGE model variable Korea (%) Peru (%) Welfare 0. 0063 0. 22 GDP 0. 0100 0. 23 Exports 0. 0311 0. 66 Imports 0. 0345 0. 65 -0. 0001 0. 0000 0. 29 Trade Balance Employment
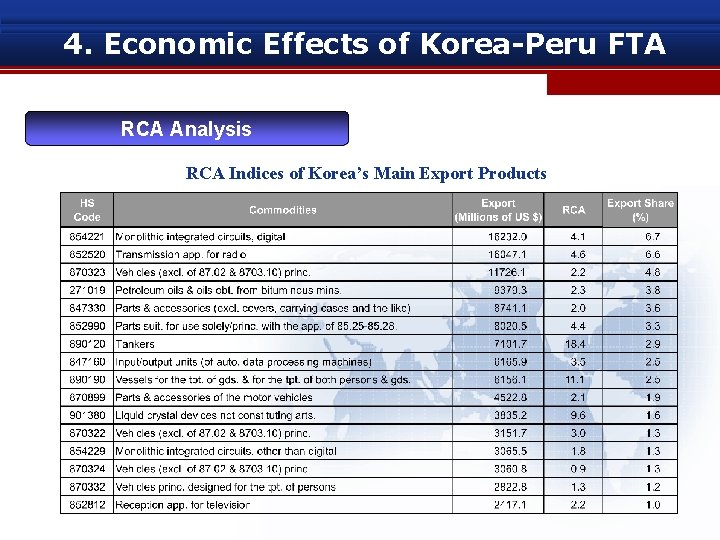
4. Economic Effects of Korea-Peru FTA RCA Analysis RCA Indices of Korea’s Main Export Products
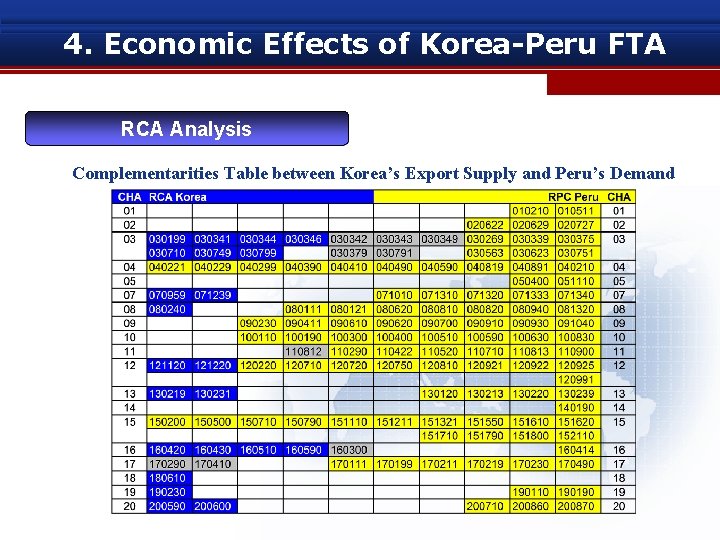
4. Economic Effects of Korea-Peru FTA RCA Analysis Complementarities Table between Korea’s Export Supply and Peru’s Demand
4. Economic Effects of Korea-Peru FTA Top 30 products which Korea imports from Andean countries
4. Economic Effects of Korea-Peru FTA Top 30 products which Peru imports from Asian countries
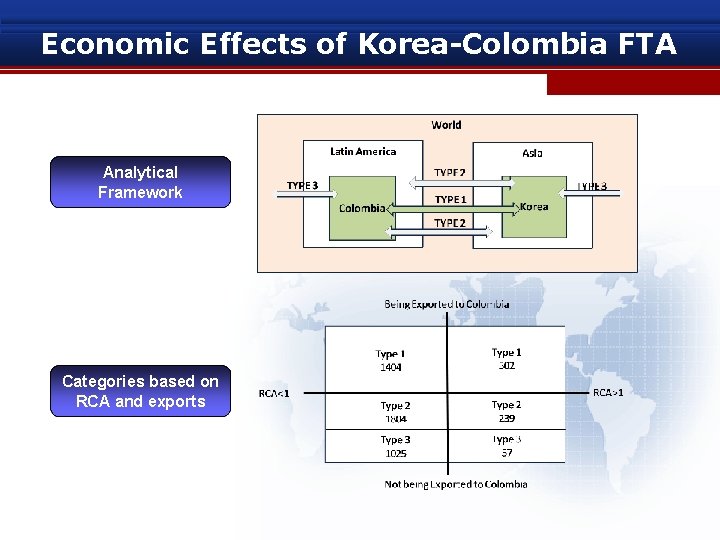
Economic Effects of Korea-Colombia FTA Analytical Framework Categories based on RCA and exports
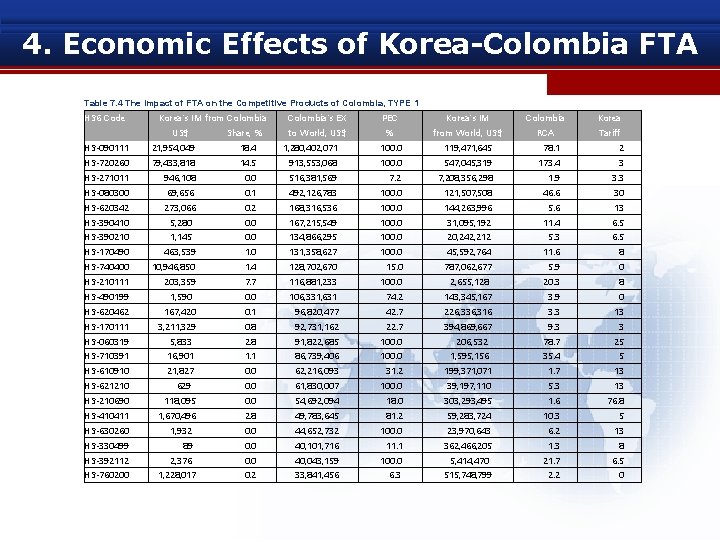
4. Economic Effects of Korea-Colombia FTA Table 7. 4 The Impact of FTA on the Competitive Products of Colombia, TYPE 1 HS 6 Code Korea's IM from Colombia Share, % to World, US$ PEC Korea's IM Colombia Korea RCA Tariff % from World, US$ HS-090111 21, 954, 049 18. 4 1, 280, 402, 071 100. 0 119, 471, 645 78. 1 2 HS-720260 79, 433, 818 14. 5 913, 553, 068 100. 0 547, 045, 319 173. 4 3 HS-271011 946, 108 0. 0 516, 381, 569 7. 2 7, 208, 356, 298 1. 9 3. 3 HS-080300 69, 656 0. 1 492, 126, 783 100. 0 121, 507, 508 46. 6 30 HS-620342 273, 066 0. 2 168, 316, 536 100. 0 144, 263, 996 5. 6 13 HS-390410 5, 280 0. 0 167, 215, 549 100. 0 31, 095, 192 11. 4 6. 5 HS-390210 1, 145 0. 0 134, 866, 295 100. 0 20, 242, 212 5. 3 6. 5 HS-170490 463, 539 1. 0 131, 358, 627 100. 0 45, 592, 764 11. 6 8 HS-740400 10, 946, 850 1. 4 128, 702, 670 15. 0 787, 062, 677 5. 9 0 HS-210111 203, 359 7. 7 116, 881, 233 100. 0 2, 655, 128 20. 3 8 HS-490199 1, 590 0. 0 106, 331, 631 74. 2 143, 345, 167 3. 9 0 HS-620462 167, 420 0. 1 96, 820, 477 42. 7 226, 336, 316 3. 3 13 HS-170111 3, 211, 329 0. 8 92, 731, 162 22. 7 394, 869, 667 9. 3 3 US$ Colombia's EX HS-060319 5, 833 2. 8 91, 822, 685 100. 0 206, 532 78. 7 25 HS-710391 16, 901 1. 1 86, 739, 406 100. 0 1, 595, 156 35. 4 5 HS-610910 21, 827 0. 0 62, 216, 093 31. 2 199, 371, 071 1. 7 13 629 HS-621210 0. 0 61, 830, 007 100. 0 39, 197, 110 5. 3 13 HS-210690 118, 095 0. 0 54, 692, 094 18. 0 303, 293, 495 1. 6 76. 8 HS-410411 1, 670, 496 2. 8 49, 783, 645 81. 2 59, 283, 724 10. 3 5 1, 932 0. 0 44, 652, 732 100. 0 23, 970, 643 6. 2 13 HS-330499 89 0. 0 40, 101, 716 11. 1 362, 466, 205 1. 3 8 HS-392112 2, 376 0. 0 40, 043, 159 100. 0 5, 414, 470 21. 7 6. 5 0. 2 33, 841, 456 6. 3 515, 748, 799 2. 2 0 HS-630260 HS-760200 1, 228, 017
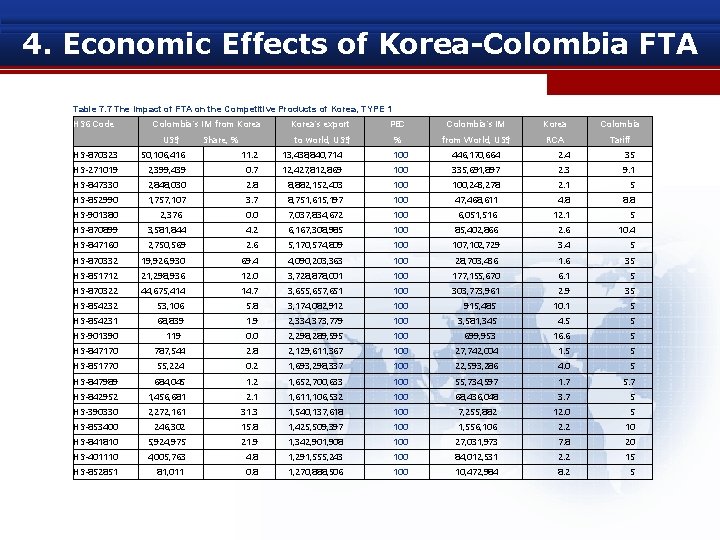
4. Economic Effects of Korea-Colombia FTA Table 7. 7 The Impact of FTA on the Competitive Products of Korea, TYPE 1 HS 6 Code Colombia's IM from Korea US$ Share, % Korea's export PEC Colombia's IM Korea Colombia to world, US$ % from World, US$ RCA Tariff HS-870323 50, 106, 416 11. 2 13, 438, 840, 714 100 446, 170, 664 2. 4 35 HS-271019 2, 399, 439 0. 7 12, 427, 812, 869 100 335, 691, 897 2. 3 9. 1 HS-847330 2, 848, 030 2. 8 8, 882, 152, 403 100, 243, 278 2. 1 5 HS-852990 1, 757, 107 3. 7 8, 751, 615, 197 100 47, 468, 611 4. 8 8. 8 0. 0 7, 037, 834, 672 100 6, 051, 516 12. 1 5 4. 2 6, 167, 308, 985 100 85, 402, 866 2. 6 10. 4 HS-901380 HS-870899 2, 376 3, 581, 844 HS-847160 2, 750, 569 2. 6 5, 170, 574, 809 100 107, 102, 729 3. 4 5 HS-870332 19, 926, 930 69. 4 4, 090, 203, 363 100 28, 703, 436 1. 6 35 HS-851712 21, 298, 936 12. 0 3, 728, 878, 001 100 177, 155, 670 6. 1 5 HS-870322 44, 675, 414 14. 7 3, 655, 657, 651 100 303, 773, 961 2. 9 35 HS-854232 53, 106 5. 8 3, 174, 082, 912 100 915, 485 10. 1 5 HS-854231 68, 839 1. 9 2, 334, 373, 779 100 3, 581, 345 4. 5 5 HS-901390 119 0. 0 2, 298, 289, 595 100 699, 953 16. 6 5 HS-847170 787, 544 2. 8 2, 129, 611, 367 100 27, 742, 004 1. 5 5 HS-851770 55, 224 0. 2 1, 693, 298, 337 100 22, 593, 286 4. 0 5 HS-847989 684, 045 1. 2 1, 652, 700, 633 100 55, 734, 597 1. 7 5. 7 HS-842952 1, 456, 681 2. 1 1, 611, 106, 532 100 68, 436, 048 3. 7 5 HS-390330 2, 272, 161 31. 3 1, 540, 137, 618 100 7, 255, 882 12. 0 5 HS-853400 246, 302 15. 8 1, 425, 509, 397 100 1, 556, 106 2. 2 10 HS-841810 5, 924, 975 21. 9 1, 342, 901, 908 100 27, 031, 973 7. 8 20 HS-401110 4, 005, 763 4. 8 1, 291, 555, 243 100 84, 012, 531 2. 2 15 HS-852851 81, 011 0. 8 1, 270, 888, 506 100 10, 472, 984 8. 2 5
4. Economic Effects of Korea-Peru FTA Index of Trade Conformity
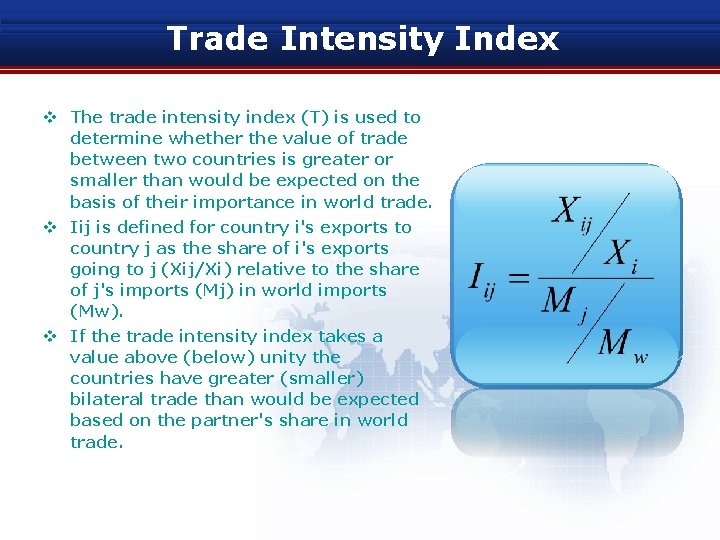
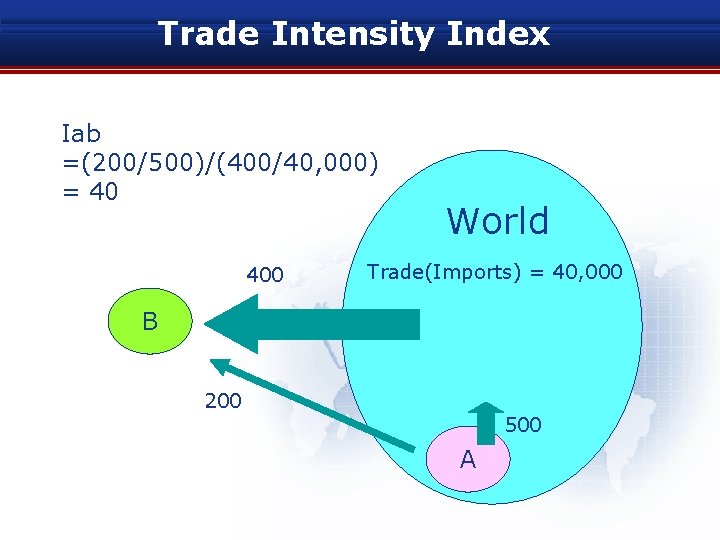
Trade Intensity Index v The trade intensity index (T) is used to determine whether the value of trade between two countries is greater or smaller than would be expected on the basis of their importance in world trade. v Iij is defined for country i's exports to country j as the share of i's exports going to j (Xij/Xi) relative to the share of j's imports (Mj) in world imports (Mw). v If the trade intensity index takes a value above (below) unity the countries have greater (smaller) bilateral trade than would be expected based on the partner's share in world trade.
Trade Intensity Index Iab =(200/500)/(400/40, 000) = 40 400 World Trade(Imports) = 40, 000 B 200 500 A
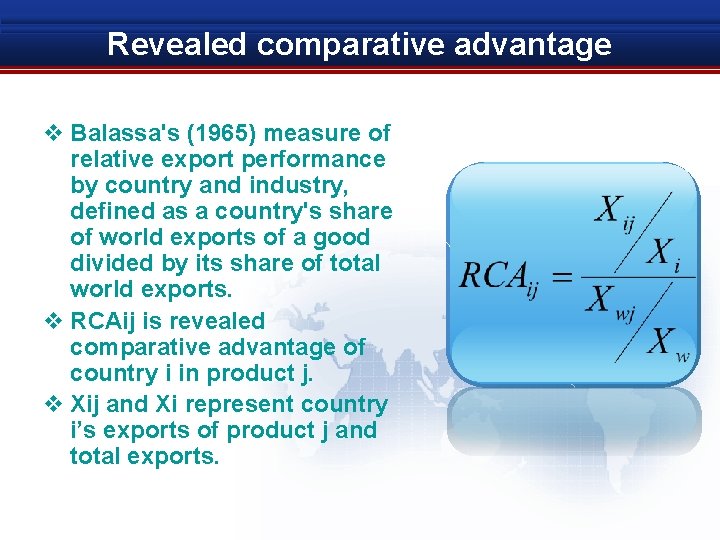
Revealed comparative advantage v Balassa's (1965) measure of relative export performance by country and industry, defined as a country's share of world exports of a good divided by its share of total world exports. v RCAij is revealed comparative advantage of country i in product j. v Xij and Xi represent country i’s exports of product j and total exports.
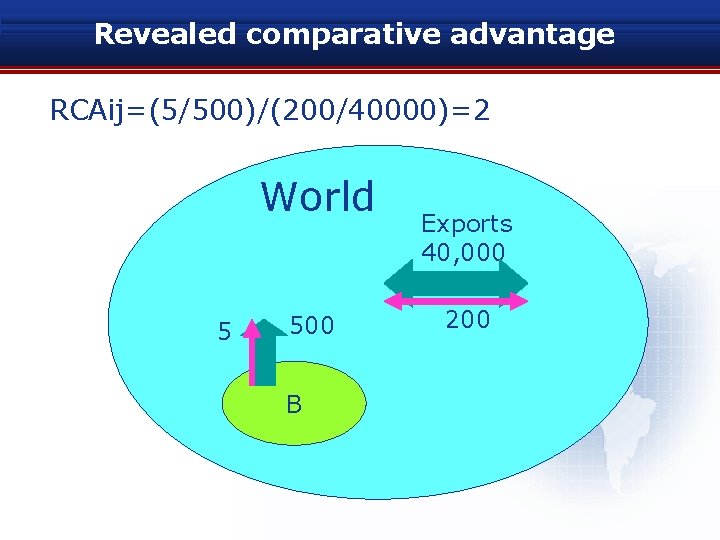
Revealed comparative advantage RCAij=(5/500)/(200/40000)=2 World 5 500 B Exports 40, 000 200
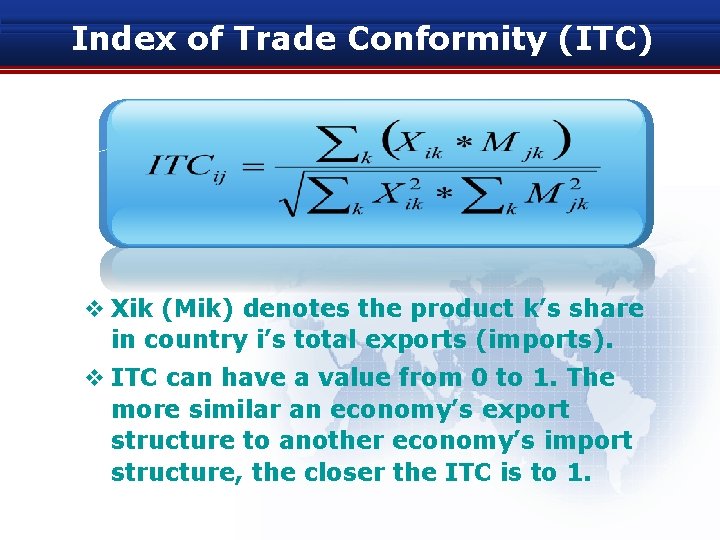
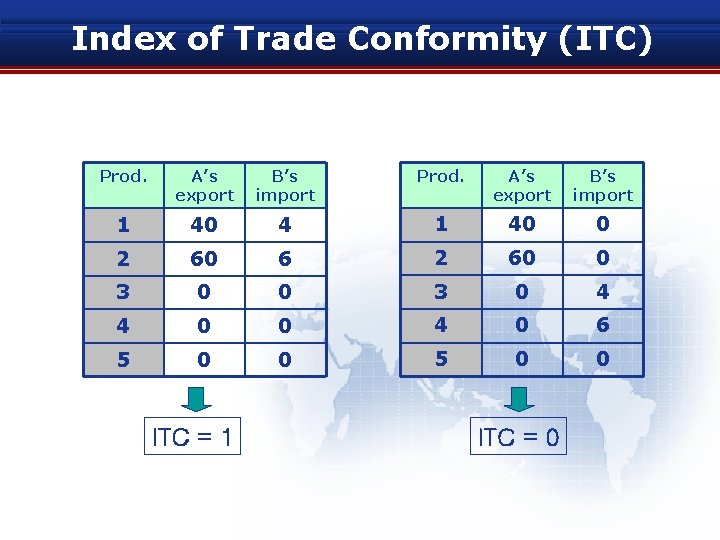
Index of Trade Conformity (ITC) v Xik (Mik) denotes the product k’s share in country i’s total exports (imports). v ITC can have a value from 0 to 1. The more similar an economy’s export structure to another economy’s import structure, the closer the ITC is to 1.
Index of Trade Conformity (ITC) Prod. A’s export B’s import 1 40 4 1 40 0 2 60 6 2 60 0 3 0 4 4 0 0 4 0 6 5 0 0 ITC = 1 ITC = 0