Oracle Administration and Monitoring Tools for Windows Administering

- Slides: 49

Oracle Administration and Monitoring Tools for Windows Administering and Monitoring Oracle with Windows Tools

Objectives ¢ At the end of this module the student will understand the following tasks and concepts. Oracle GUI Administration Tools n n n ¢ Oracle Command Line Administration Tools n n n ¢ Oracle Services Configuration Event Viewer Task Manager Oracle Administration Assistant for Windows Performance Monitor Oracle Counters for Windows Performance Monitor Using SQLPlus for Administration The ORADIM utility Creating password files with orapwd The ORADEBUG Utility STATSPACK Automatic Workload Repository Reports (10 g) Oracle Web Tools n Managing Oracle with Oracle 10 g Grid Control

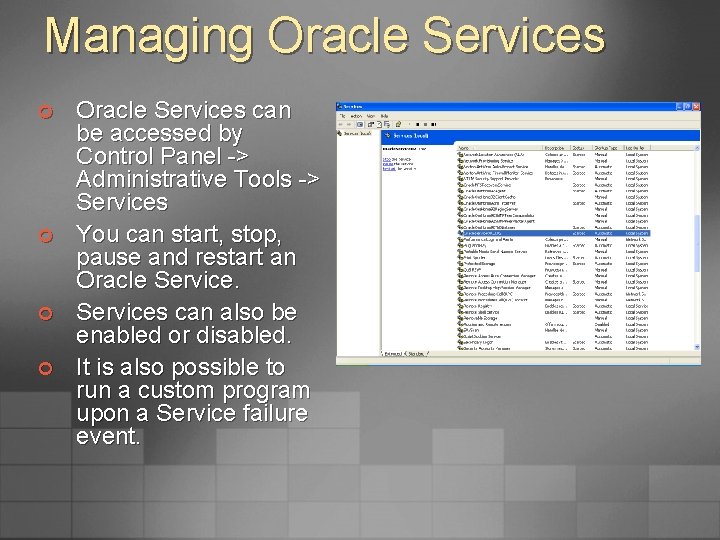
Managing Oracle Services ¢ ¢ Oracle Services can be accessed by Control Panel -> Administrative Tools -> Services You can start, stop, pause and restart an Oracle Services can also be enabled or disabled. It is also possible to run a custom program upon a Service failure event.

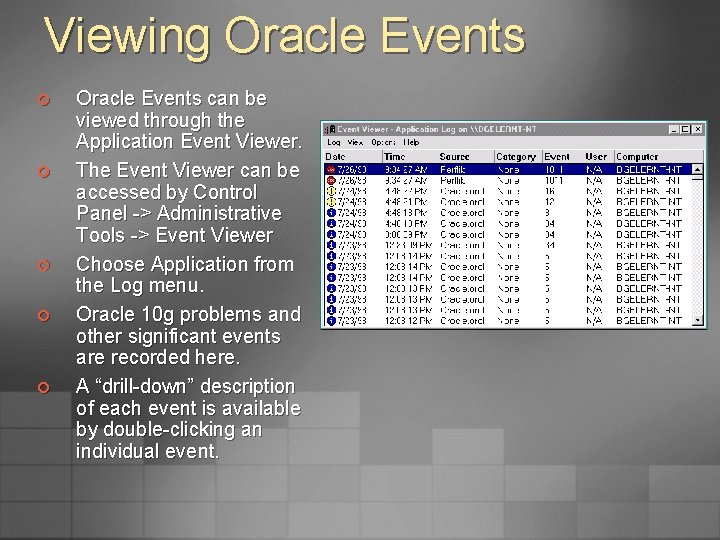
Viewing Oracle Events ¢ ¢ ¢ Oracle Events can be viewed through the Application Event Viewer. The Event Viewer can be accessed by Control Panel -> Administrative Tools -> Event Viewer Choose Application from the Log menu. Oracle 10 g problems and other significant events are recorded here. A “drill-down” description of each event is available by double-clicking an individual event.

The Task Manager Tool ¢ The Task Manager Tool displays: n n n ¢ ¢ Task Manager can be used to change the priority of a process. The Task Manager can be launched two ways: n n ¢ High-level summary of the concurrent applications and processes running Information about process state Graphical summary of CPU usage Graphical summary of memory usage Information about OS users Hit control-alt-escape Right-click on the task bar at the bottom of the screen The Performance tab contains useful information that directly impacts Oracle performance

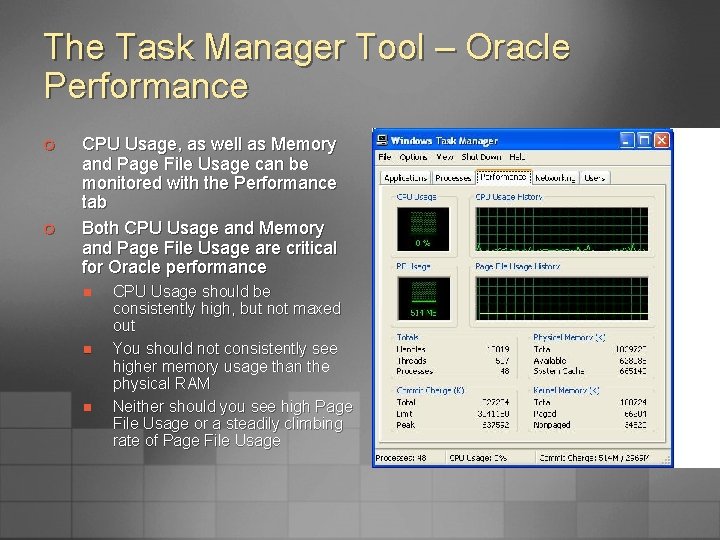
The Task Manager Tool – Oracle Performance ¢ ¢ CPU Usage, as well as Memory and Page File Usage can be monitored with the Performance tab Both CPU Usage and Memory and Page File Usage are critical for Oracle performance n n n CPU Usage should be consistently high, but not maxed out You should not consistently see higher memory usage than the physical RAM Neither should you see high Page File Usage or a steadily climbing rate of Page File Usage

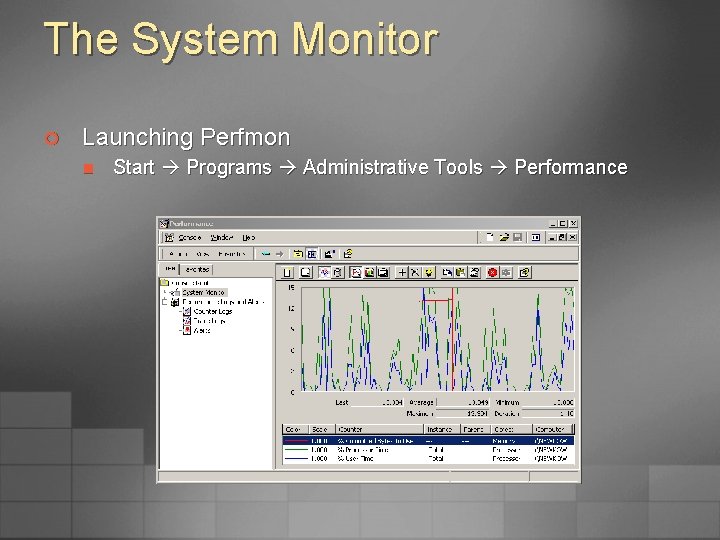
The System Monitor ¢ Launching Perfmon n Start Programs Administrative Tools Performance

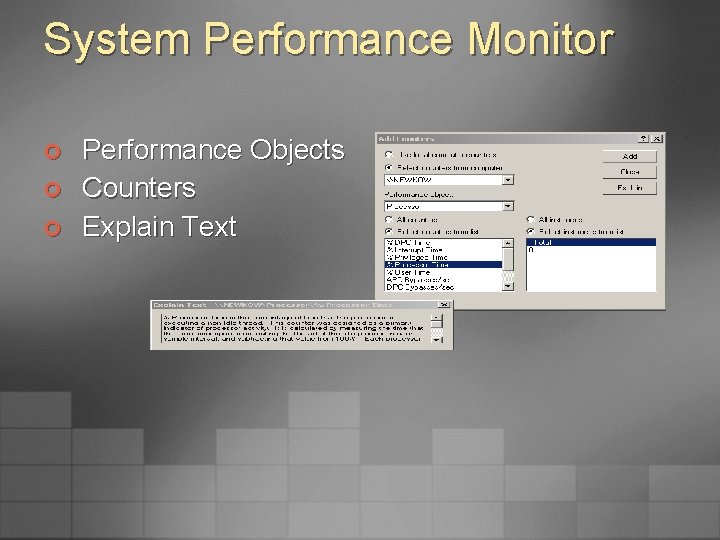
System Performance Monitor ¢ ¢ ¢ Performance Objects Counters Explain Text

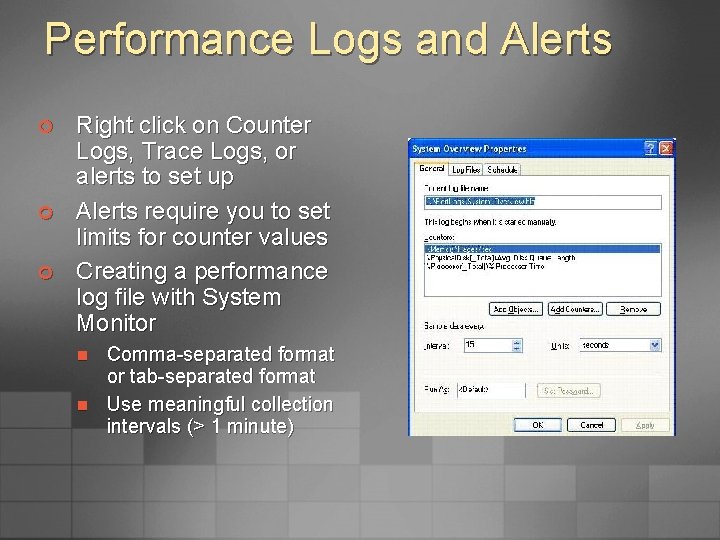
Performance Logs and Alerts ¢ ¢ ¢ Right click on Counter Logs, Trace Logs, or alerts to set up Alerts require you to set limits for counter values Creating a performance log file with System Monitor n n Comma-separated format or tab-separated format Use meaningful collection intervals (> 1 minute)

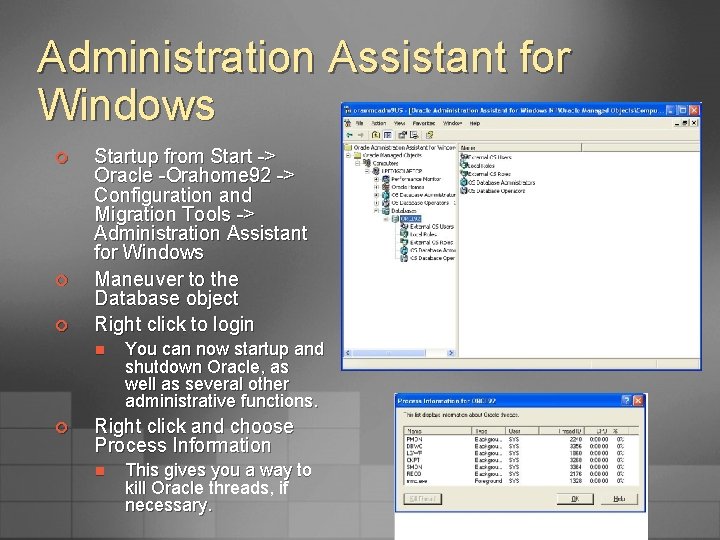
Administration Assistant for Windows ¢ ¢ ¢ Startup from Start -> Oracle -Orahome 92 -> Configuration and Migration Tools -> Administration Assistant for Windows Maneuver to the Database object Right click to login n ¢ You can now startup and shutdown Oracle, as well as several other administrative functions. Right click and choose Process Information n This gives you a way to kill Oracle threads, if necessary.

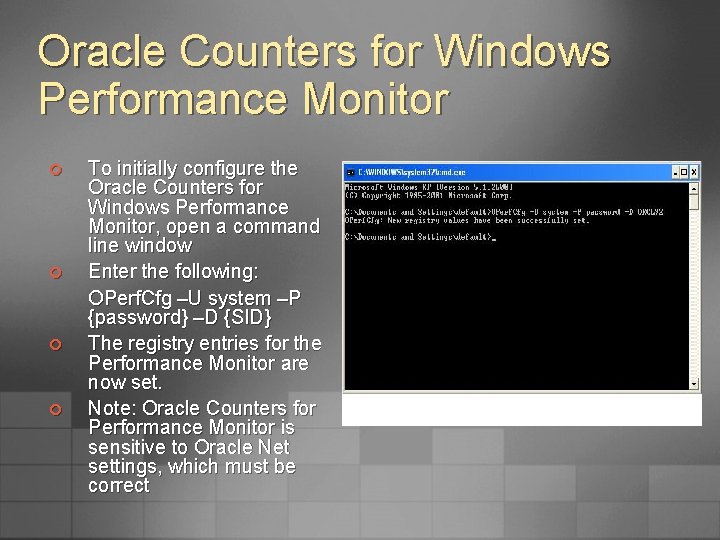
Oracle Counters for Windows Performance Monitor ¢ ¢ To initially configure the Oracle Counters for Windows Performance Monitor, open a command line window Enter the following: OPerf. Cfg –U system –P {password} –D {SID} The registry entries for the Performance Monitor are now set. Note: Oracle Counters for Performance Monitor is sensitive to Oracle Net settings, which must be correct

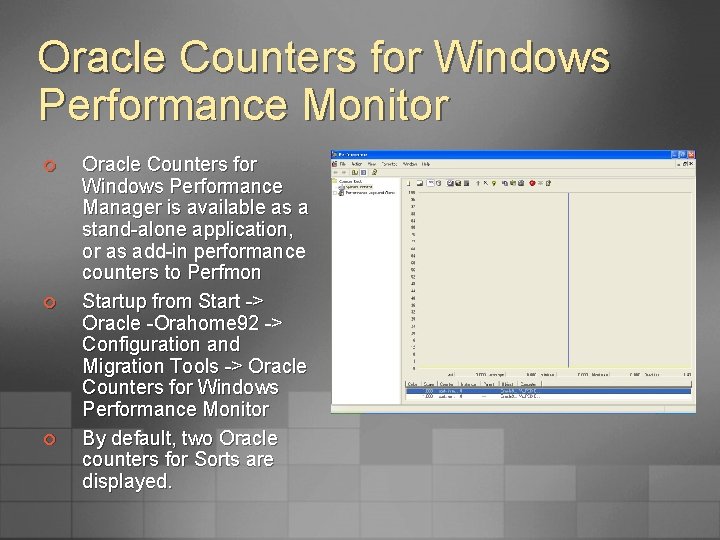
Oracle Counters for Windows Performance Monitor ¢ ¢ ¢ Oracle Counters for Windows Performance Manager is available as a stand-alone application, or as add-in performance counters to Perfmon Startup from Start -> Oracle -Orahome 92 -> Configuration and Migration Tools -> Oracle Counters for Windows Performance Monitor By default, two Oracle counters for Sorts are displayed.

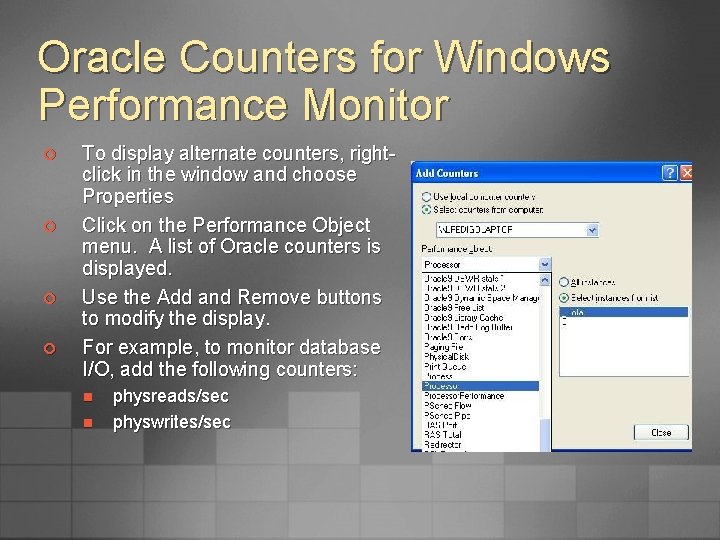
Oracle Counters for Windows Performance Monitor ¢ ¢ To display alternate counters, rightclick in the window and choose Properties Click on the Performance Object menu. A list of Oracle counters is displayed. Use the Add and Remove buttons to modify the display. For example, to monitor database I/O, add the following counters: n n physreads/sec physwrites/sec

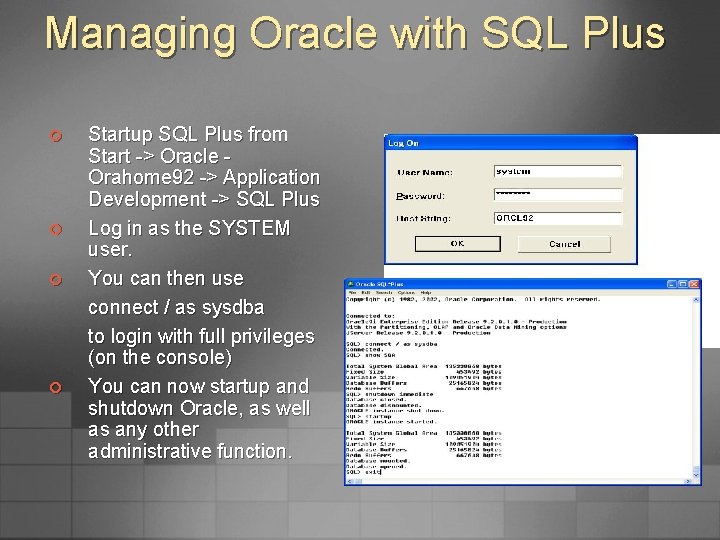
Managing Oracle with SQL Plus ¢ ¢ Startup SQL Plus from Start -> Oracle Orahome 92 -> Application Development -> SQL Plus Log in as the SYSTEM user. You can then use connect / as sysdba to login with full privileges (on the console) You can now startup and shutdown Oracle, as well as any other administrative function.

The ORADIM Utility ¢ ¢ The ORADIM utility is a command line tool that can be used to manually create, delete or modify databases To get help, enter oradim -? | -HELP ¢ To create an instance called PROD, for example, you could enter: C: > oradim -NEW -SID prod -INTPWD mypassword 1 STARTMODE auto -PFILE C: oracleadminprodpfileinit. ora ¢ To start an instance called PROD, for example, you could enter: C: > oradim -STARTUP -SID prod -STARTTYPE inst -PFILE C: oracleadminprodpfileinit. ora

The ORADIM Utility ¢ To stop an instance called PROD, for example, you could enter: C: > oradim -SHUTDOWN -SID prod -SHUTTYPE srvc, inst ¢ To change an instance name from prod to lynx, set a new instance password mycat 123, and specify a new initialization parameter file, for example, you could enter: C: > oradim -EDIT -SID prod -NEWSID lynx -INTPWD mycat 123 -STARTMODE a –PFILE C: oracleadminlynxpfileinit. ora ¢ To delete an instance called prod, for example, you might enter: C: > oradim -DELETE -SID prod

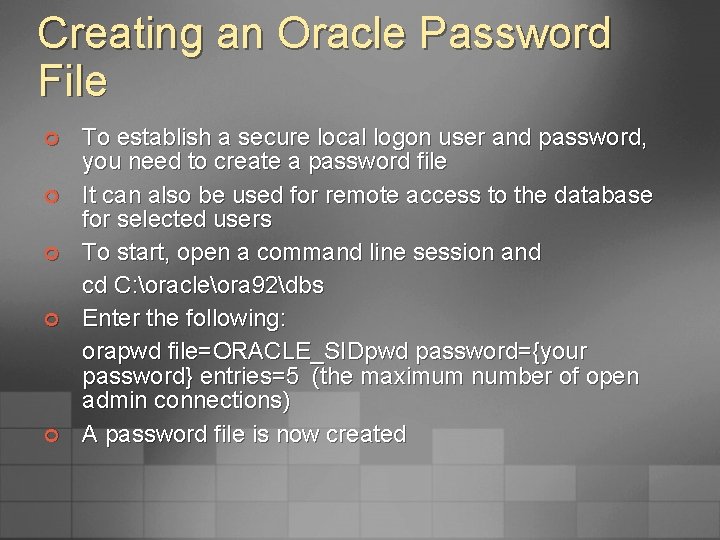
Creating an Oracle Password File ¢ ¢ ¢ To establish a secure local logon user and password, you need to create a password file It can also be used for remote access to the database for selected users To start, open a command line session and cd C: oracleora 92dbs Enter the following: orapwd file=ORACLE_SIDpwd password={your password} entries=5 (the maximum number of open admin connections) A password file is now created

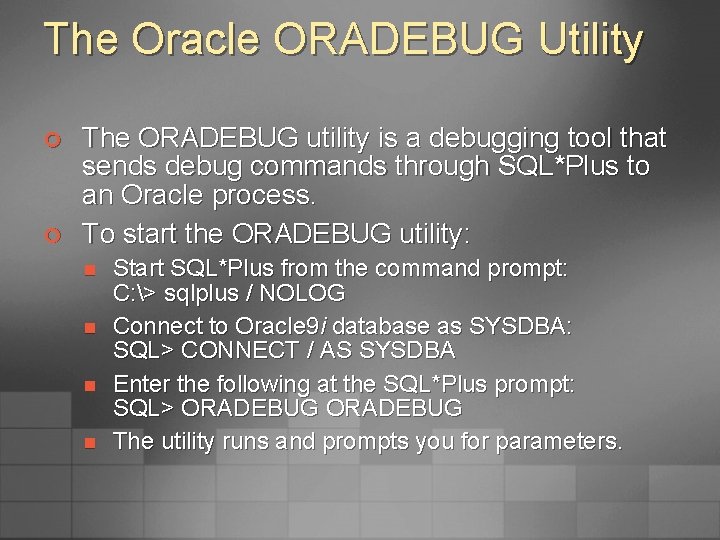
The Oracle ORADEBUG Utility ¢ ¢ The ORADEBUG utility is a debugging tool that sends debug commands through SQL*Plus to an Oracle process. To start the ORADEBUG utility: n n Start SQL*Plus from the command prompt: C: > sqlplus / NOLOG Connect to Oracle 9 i database as SYSDBA: SQL> CONNECT / AS SYSDBA Enter the following at the SQL*Plus prompt: SQL> ORADEBUG The utility runs and prompts you for parameters.

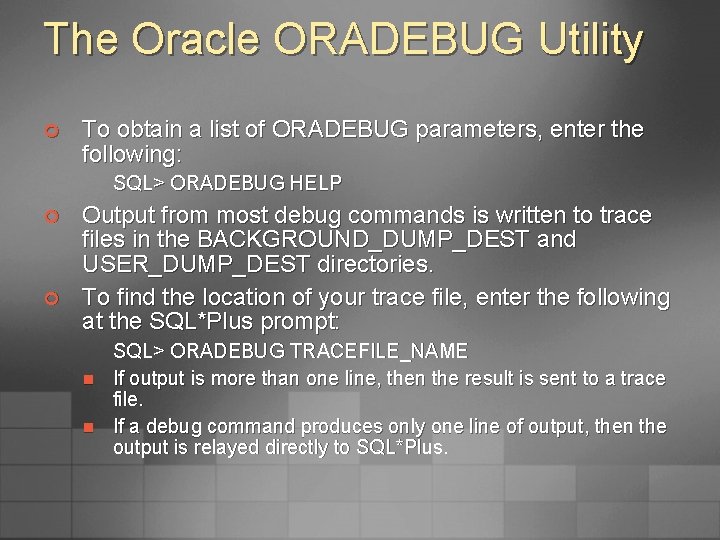
The Oracle ORADEBUG Utility ¢ To obtain a list of ORADEBUG parameters, enter the following: SQL> ORADEBUG HELP ¢ ¢ Output from most debug commands is written to trace files in the BACKGROUND_DUMP_DEST and USER_DUMP_DEST directories. To find the location of your trace file, enter the following at the SQL*Plus prompt: n n SQL> ORADEBUG TRACEFILE_NAME If output is more than one line, then the result is sent to a trace file. If a debug command produces only one line of output, then the output is relayed directly to SQL*Plus.

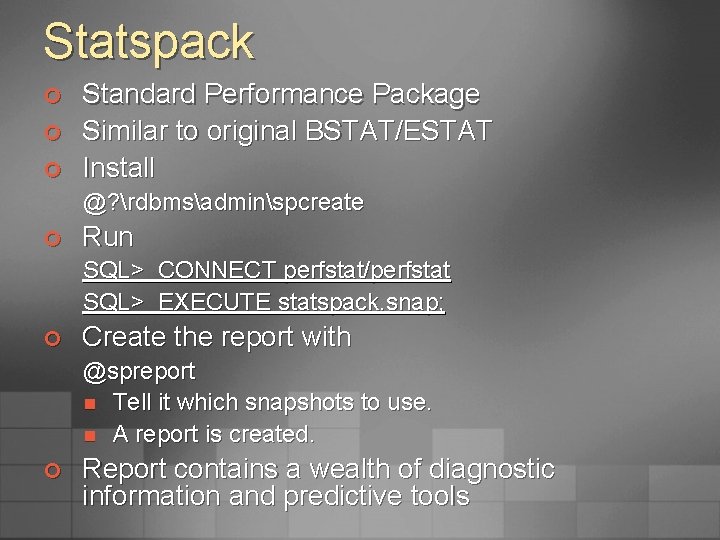
Statspack ¢ ¢ ¢ Standard Performance Package Similar to original BSTAT/ESTAT Install @? rdbmsadminspcreate ¢ Run SQL> CONNECT perfstat/perfstat SQL> EXECUTE statspack. snap; ¢ Create the report with @spreport n Tell it which snapshots to use. n A report is created. ¢ Report contains a wealth of diagnostic information and predictive tools

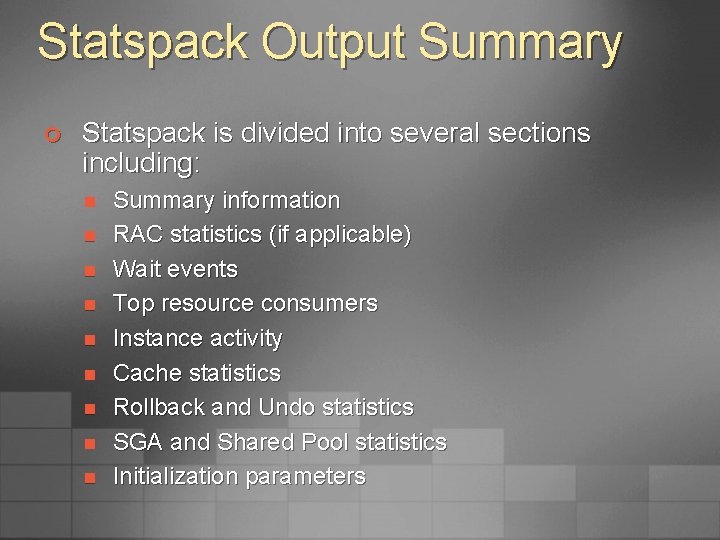
Statspack Output Summary ¢ Statspack is divided into several sections including: n n n n n Summary information RAC statistics (if applicable) Wait events Top resource consumers Instance activity Cache statistics Rollback and Undo statistics SGA and Shared Pool statistics Initialization parameters

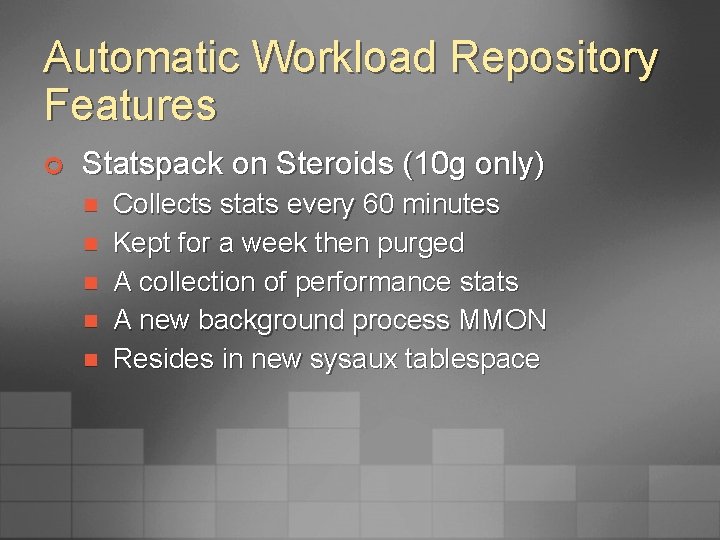
Automatic Workload Repository Features ¢ Statspack on Steroids (10 g only) n n n Collects stats every 60 minutes Kept for a week then purged A collection of performance stats A new background process MMON Resides in new sysaux tablespace

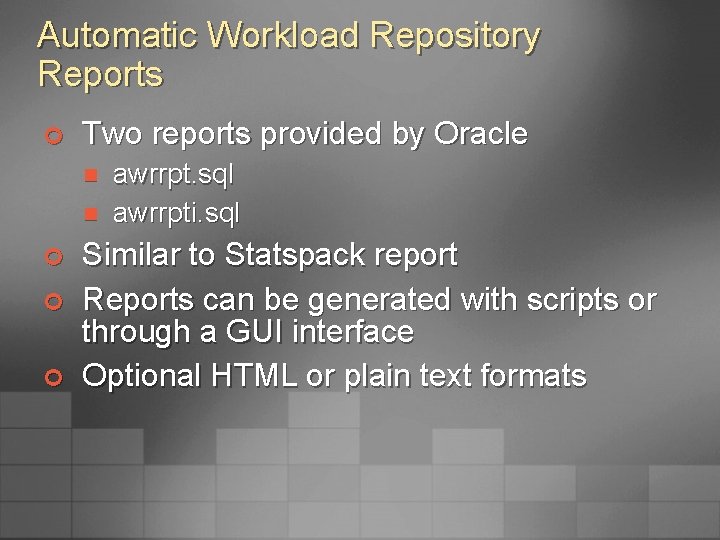
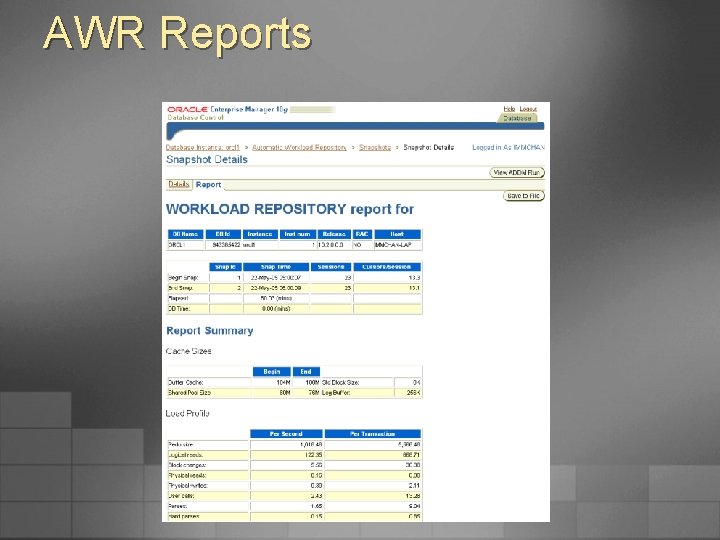
Automatic Workload Repository Reports ¢ Two reports provided by Oracle n n ¢ ¢ ¢ awrrpt. sql awrrpti. sql Similar to Statspack report Reports can be generated with scripts or through a GUI interface Optional HTML or plain text formats

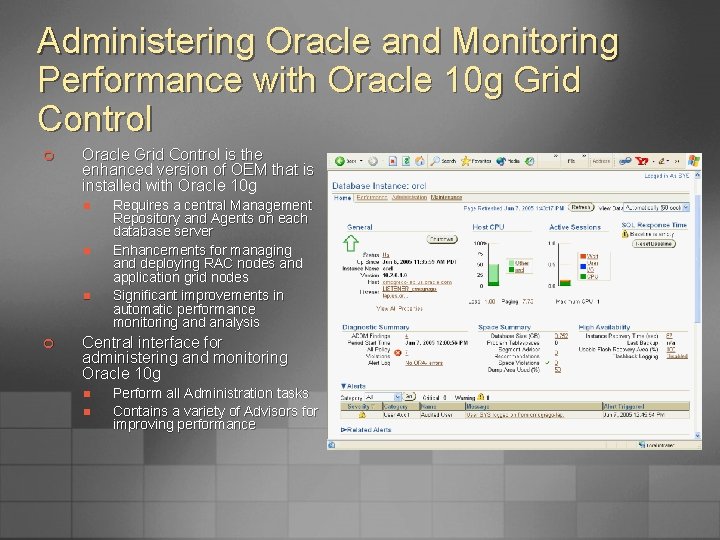
Administering Oracle and Monitoring Performance with Oracle 10 g Grid Control ¢ Oracle Grid Control is the enhanced version of OEM that is installed with Oracle 10 g n n n ¢ Requires a central Management Repository and Agents on each database server Enhancements for managing and deploying RAC nodes and application grid nodes Significant improvements in automatic performance monitoring and analysis Central interface for administering and monitoring Oracle 10 g n n Perform all Administration tasks Contains a variety of Advisors for improving performance

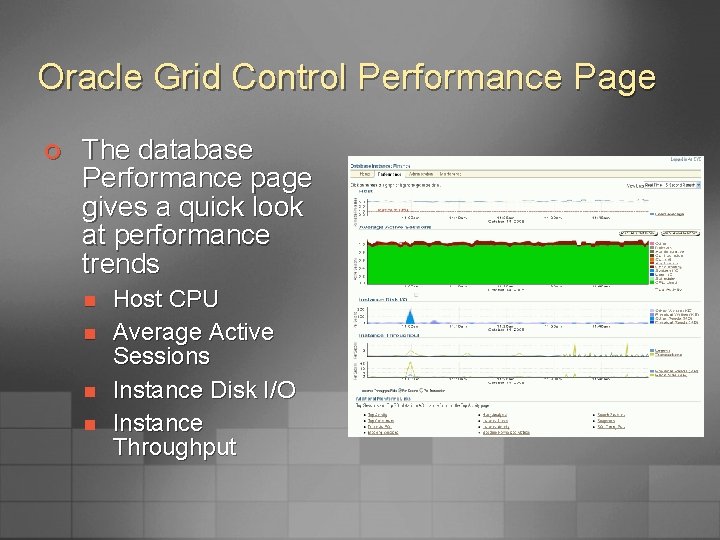
Oracle Grid Control Performance Page ¢ The database Performance page gives a quick look at performance trends n n Host CPU Average Active Sessions Instance Disk I/O Instance Throughput

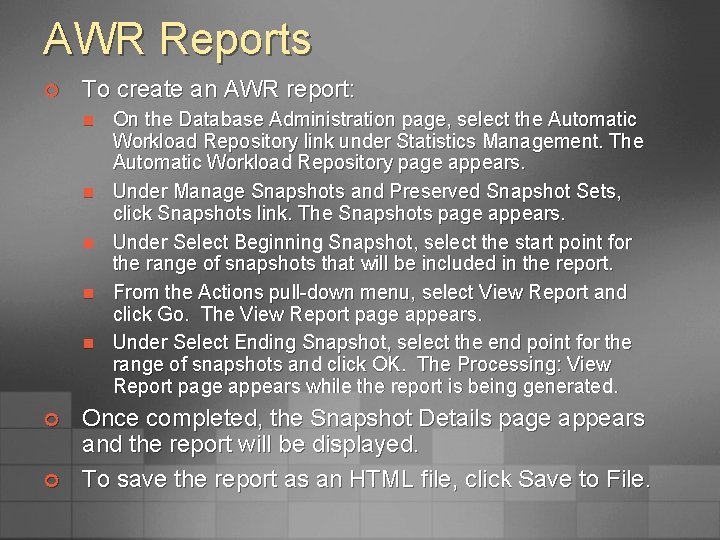
AWR Reports ¢ To create an AWR report: n n n ¢ ¢ On the Database Administration page, select the Automatic Workload Repository link under Statistics Management. The Automatic Workload Repository page appears. Under Manage Snapshots and Preserved Snapshot Sets, click Snapshots link. The Snapshots page appears. Under Select Beginning Snapshot, select the start point for the range of snapshots that will be included in the report. From the Actions pull-down menu, select View Report and click Go. The View Report page appears. Under Select Ending Snapshot, select the end point for the range of snapshots and click OK. The Processing: View Report page appears while the report is being generated. Once completed, the Snapshot Details page appears and the report will be displayed. To save the report as an HTML file, click Save to File.

AWR Reports

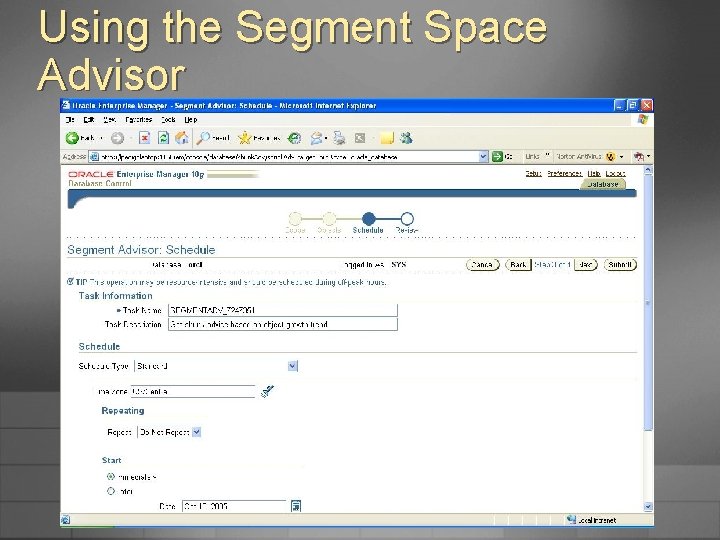
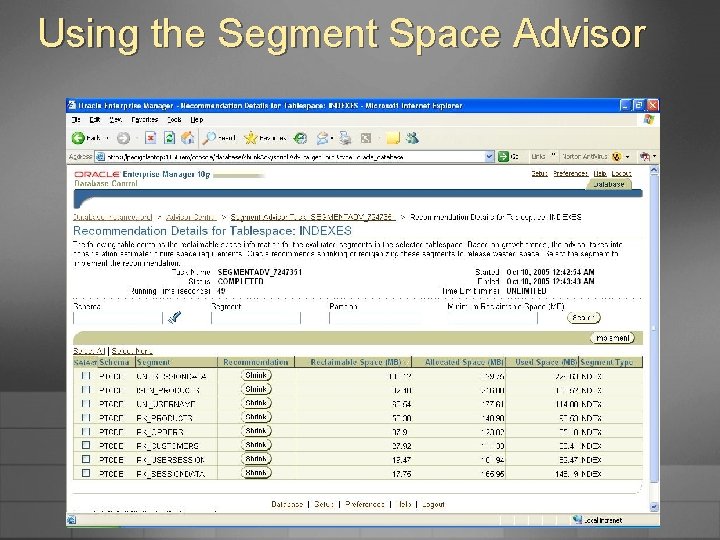
Using the Segment Space Advisor ¢ ¢ ¢ The Oracle 10 g Segment Advisor helps you determine whether an object has space available for reclamation. Available in 10 g OEM or Grid Control The Segment Advisor can generate advice at three levels: n n n Object level - advice is generated for the entire object, such as a table. Advice does not cascade to dependent objects. Segment level, - advice is generated for a single segment, such as unpartitioned table, a partition or subpartition of a partitioned table, or an index or LOB column. Tablespace level - advice is generated for every segment in the tablespace.

Using the Segment Space Advisor

Using the Segment Space Advisor

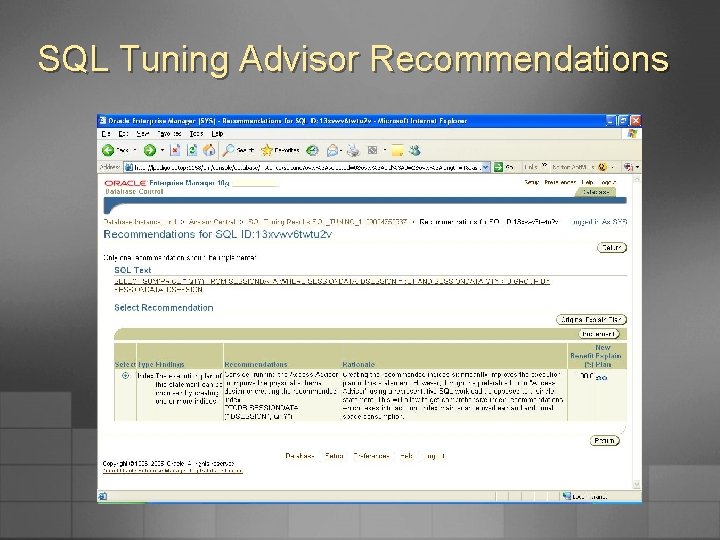
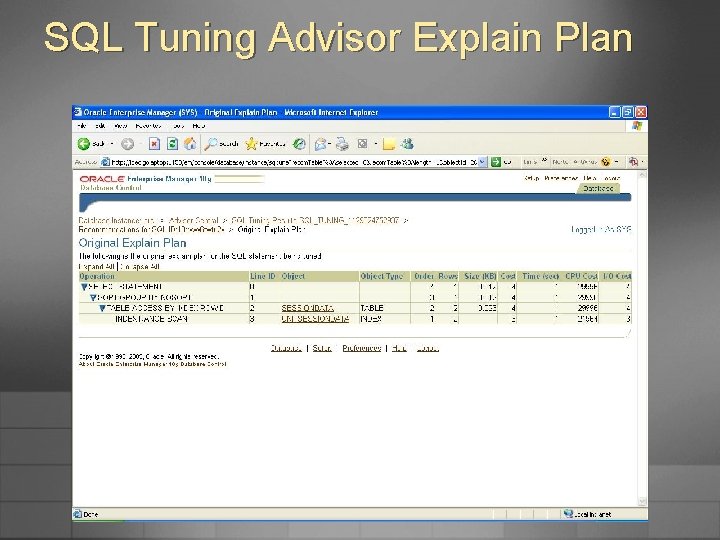
SQL Tuning Advisor ¢ ¢ 10 g Oracle Enterprise Manager (DB Console, Grid Control) offers the SQL Tuning Advisor as a SQL statement tuning tool. Accessed from Advisor Central n n n Select one or more SQL statements, or generate an SQL Tuning Set View automatically generated Recommendations View Explain Plan output

SQL Tuning Advisor Recommendations

SQL Tuning Advisor Explain Plan

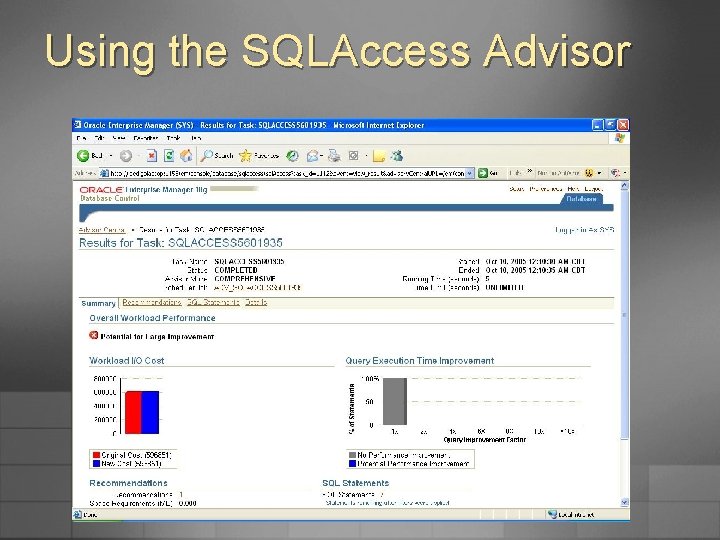
Using the SQLAccess Advisor ¢ ¢ ¢ The SQLAccess Advisor provides an alternative to manually determining which indexes are required. The SQLAccess advisor may be invoked from Advisor Central in OEM or run with the procedures in the DBMS_ADVISOR package. For a chosen schema, the SQLAccess Advisor either recommends using a workload or it can generate a hypothetical workload. Given a workload, the SQLAccess Advisor generates a set of recommendations from which you can select indexes to be implemented. SQLAccess Advisor generates an implementation script that can be executed manually or through OEM.

Using the SQLAccess Advisor ¢ ¢ ¢ The SQLAccess Advisor provides an alternative to manually determining which indexes are required. The SQLAccess advisor may be invoked from Advisor Central in OEM or run with the procedures in the DBMS_ADVISOR package. For a chosen schema, the SQLAccess Advisor either recommends using a workload or it can generate a hypothetical workload. Given a workload, the SQLAccess Advisor generates a set of recommendations from which you can select indexes to be implemented. SQLAccess Advisor generates an implementation script that can be executed manually or through OEM.

Using the SQLAccess Advisor

Automatic Database Diagnostic Monitor ¢ ADDM considers the following to make performance tuning recommendations: n n n n CPU bottlenecks Undersized Memory Structures I/O capacity issues High load SQL statements High load PL/SQL execution and compilation High load Java usage RAC specific issues: n n Global cache hot blocks and objects Iinterconnect latency issues

Automatic Database Diagnostic Monitor (cont. ) ¢ ADDM considers the following to make recommendations: n Sub-optimal use of Oracle by the application: n n Database configuration issues: n n n Poor connection management Excessive parsing Application level lock contention Incorrect sizing of log files Archiving issues, excessive checkpoints Sub-optimal parameter settings Concurrency issues - Are there buffer busy problems? Hot objects and top SQL for various problem areas

ADDM Recommended Solutions ¢ Hardware changes n n ¢ Database configuration n ¢ n Hash partitioning a table or index Using automatic segment-space management (ASSM) Application changes n n ¢ Changing initialization parameter settings Schema changes n ¢ Adding CPUs Changing the I/O subsystem configuration Using the cache option for sequences Using bind variables Using other advisors n n Running the SQL Tuning Advisor on high load SQL Running the Segment Advisor on hot objects

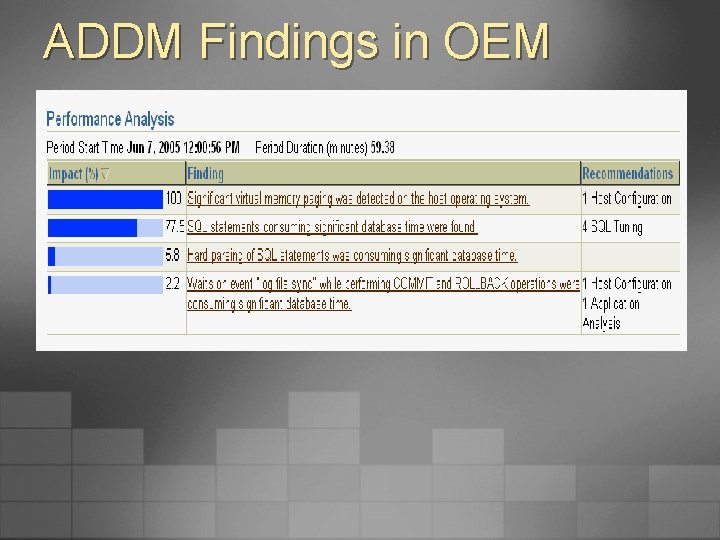
Viewing Current ADDM Findings ¢ You can view ADDM findings based on the latest analysis period within OEM n n n Go to the Database Home page View the Diagnostic Summary to see a list of ADDM findings Click on a finding link to see details

ADDM Findings in OEM

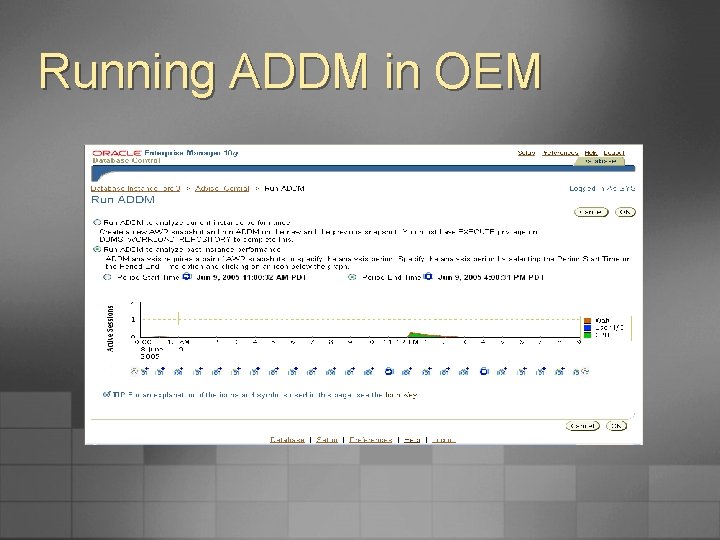
Running ADDM Manually ¢ From the Database Home page n n ¢ Under Related Links, click the Advisor Central link On the ADDM page, under Advisors, click the ADDM link Select Run ADDM to analyze past instance performance n n n Choose the Period Start Time (choose starting snapshot) Choose the Period End Time (default is last snapshot) Click OK to start analysis

Running ADDM in OEM

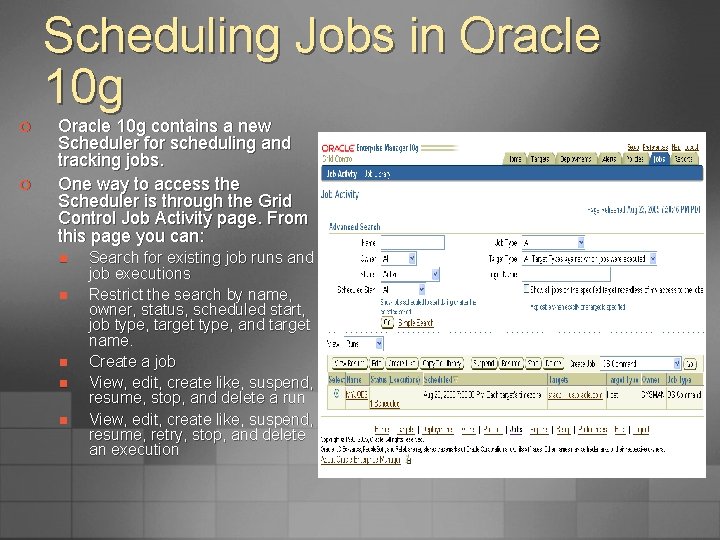
Scheduling Jobs in Oracle 10 g ¢ ¢ Oracle 10 g contains a new Scheduler for scheduling and tracking jobs. One way to access the Scheduler is through the Grid Control Job Activity page. From this page you can: n n n Search for existing job runs and job executions Restrict the search by name, owner, status, scheduled start, job type, target type, and target name. Create a job View, edit, create like, suspend, resume, stop, and delete a run View, edit, create like, suspend, resume, retry, stop, and delete an execution

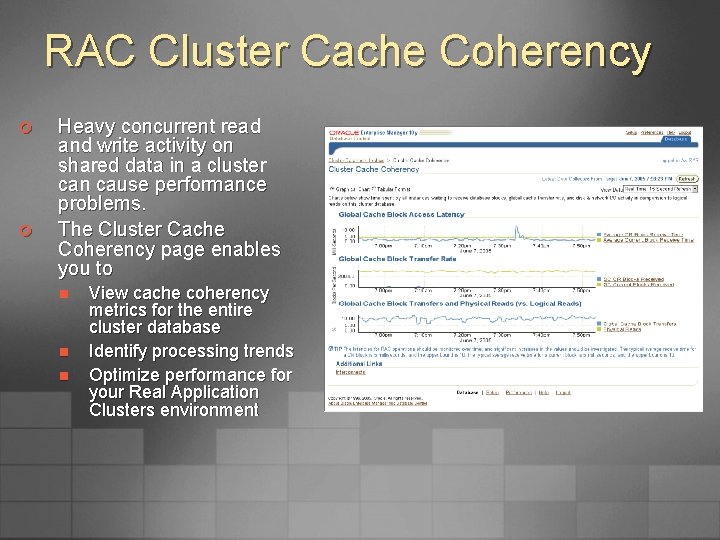
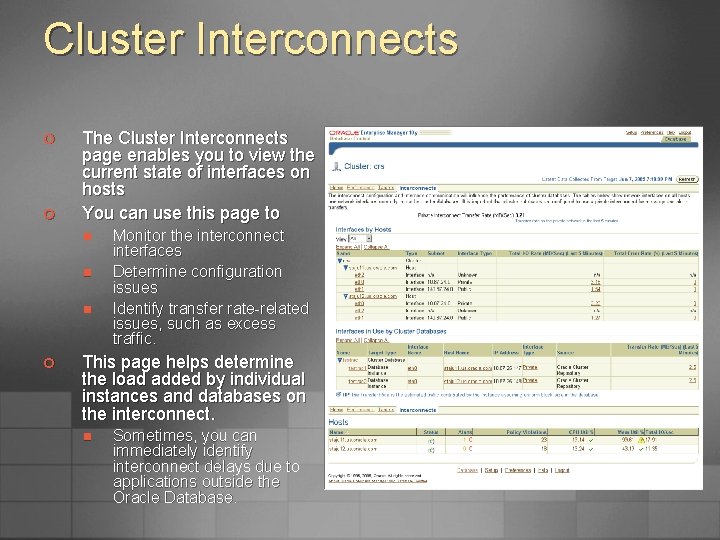
RAC Cluster Cache Coherency ¢ ¢ Heavy concurrent read and write activity on shared data in a cluster can cause performance problems. The Cluster Cache Coherency page enables you to n n n View cache coherency metrics for the entire cluster database Identify processing trends Optimize performance for your Real Application Clusters environment

Cluster Interconnects ¢ ¢ The Cluster Interconnects page enables you to view the current state of interfaces on hosts You can use this page to n n n ¢ Monitor the interconnect interfaces Determine configuration issues Identify transfer rate-related issues, such as excess traffic. This page helps determine the load added by individual instances and databases on the interconnect. n Sometimes, you can immediately identify interconnect delays due to applications outside the Oracle Database.

Conclusions ¢ Oracle GUI Administration Tools n n n ¢ Oracle Command Line Administration Tools n n n ¢ Oracle Services Configuration Event Viewer Oracle Administration Assistant for Windows Performance Monitor Oracle for Windows Performance Monitor Using SQLPlus for Administration The oradim utility Creating password files with orapwd The ORADEBUG Utility Statspack AWR Oracle Web Tools n Managing Oracle with Oracle 10 g Grid Control

Review ¢ ¢ ¢ How could you customize an Oracle Service? What command is used to create an Oracle password file? How must you log in to SQLPlus in order to stop and start the database? Where can you go if you need to kill Oracle threads? What Advisors can you launch from Oracle Grid Control to help monitor performance?

Summary In this training module the following tasks and concepts were covered: ¢ Managing Oracle Services on Windows ¢ Creating a password file with orapwd ¢ Managing a database with SQLPlus ¢ Managing a database with Administration Assistant for NT ¢ Managing and Monitoring a database with Oracle Enterprise Manager