Norms Interpreting test results If we assume that


 captures some aspect of a person’s performance • how fast")


 •")
 or specialized (clinical or")


distribution, is a distribution that has constant probability •")


. College Entrance")

- Slides: 24
Norms
Interpreting test results If we assume that • Test is properly constructed • Test is reliable • Test is valid How can we make our interpretation / inference?
Raw Score number (X) captures some aspect of a person’s performance • how fast task were solved (e. g. sum of seconds spend on each task) • how many task were solved (e. g. no task solved properly) • how well task were solved (e. g. • how many mistakes were made – (e. g. no errors) • how severe are symptoms – (e. g. no of symptoms) How can we give meaning to the X? and interpret some number? For instance X = 20?
Frames of reference Norm-referenced test - standards based on the performance of specific groups of people to provide information for interpreting scores. useful for comparing individuals 1 vs 1 or 1 vs Group Most widely used frame of reference
Frames of reference Norms • refer to the typical behavior of one or more reference groups • presented in the form of set of statistics summarizing performance of the group (normative or standardization samples)
Frames of reference Criterion referenced test – standards based on test performance criteria, e. g. cutt-off point. • relationship between test and standard is demonstrable and well defined • designed to assess whether and to what extent the desired levels of mastery or performance criteria have been met.
Norms Within group norms • Group or groups are point of reference – Placing test taker performance within normative distribution • Composition of normative sample (key issue) • Two main types based on – Uniform distribution – Normal distribution
Normative sample • Representative for the population (individuals that test is intended to) • Size – large = stability (usually ‘ 1000 +’) – Construct characteristics and amount of important factors • Demographic (gender, age…) • Purpose of the test – Special samples NOTICE: Some vocabulary problems Standardization sample: original sample for standardization and normalization Normative sample: synonymous to previous but used also for any subsequent samples used for obtaining norms Reference group: loose term -> any group used for score comparison
Normative sample • Reference groups – wide (nation wide representative) or specialized (clinical or occupational group) • Subgroup norms (usually by gender or age) – sufficient size – representative of their categories • Local norms – Based on local (e. g. geographical or organizational) groups • Convenience norms – convenient but not very useful
Assessing quality and Applicability of a Normative Sample How large is the normative sample? When was the sample gathered? Where was the sample gathered? How were individuals identified and selected for the sample? • Who tested the sample? • How did the examiner or examiners qualify to do the testing? • What was the composition of the normative sample (age, sex, ethnicity, race, linguistic background, education, SES, geographic distribution, ANY OTHER RELEVANT VARIABLE) • •
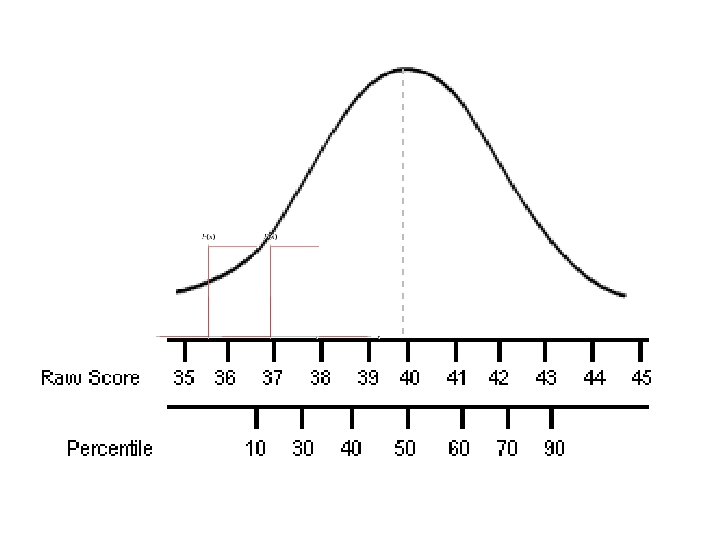
Norms – Percentiles • represent the percentage of persons in the reference group who scored at or below a given raw score • Percentile not to be confused with percent • most direct method • MAIN advantage – readily understood by test takers and applicable to most sorts of tests and test populations.
Transforming results • Ordering results in the normative sample from lowest thru highest
Percentiles • Transformation => Uniform (rectangular)distribution, is a distribution that has constant probability • No of units = 101 percentiles • Range = 0 – 100. • Median = 50 • Each pecentile is equivalent to 1% of observations exept 0 & 100 = 0, 5% Disadvantage = unequal units
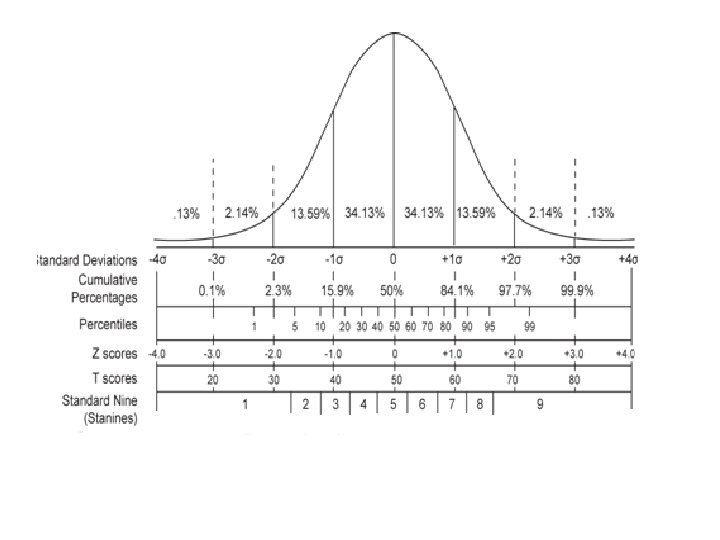
Norms – Normal distribution. Standard Scores • Transforming raw scores into standard score Continuous variable M = 0 and SD = 1 Range = unlimited No of units = unlimited (unit as small as 0, 01) Used as a primary transformation
Formula for transforming z score into other derived standard scores New standard score = (z score) (New SD) + New mean
STEN – Standard TEN Distribution normal Mean 5. 5 (between 5 th and 6 th) Range 1 -10 SD = 2 No of units 10 1 unit (STEN) = 0, 5 SD Used for differentiating within -2 to +2 SD of normal distribution • STEN 1 and 10 used for scores above |2| SD of standard normal distribution • •
STANINE – STAndard NINE Distribution normal Mean 5 = 5 th stanine SD = 2 Range 1 -9 No of units 9 1 unit (STEN) = 0, 5 SD Used for differentiating within -1, 75 to +1, 75 SD of normal distribution STANINE 1 and 9 used for scores above |1, 75| SD of standard normal distribution
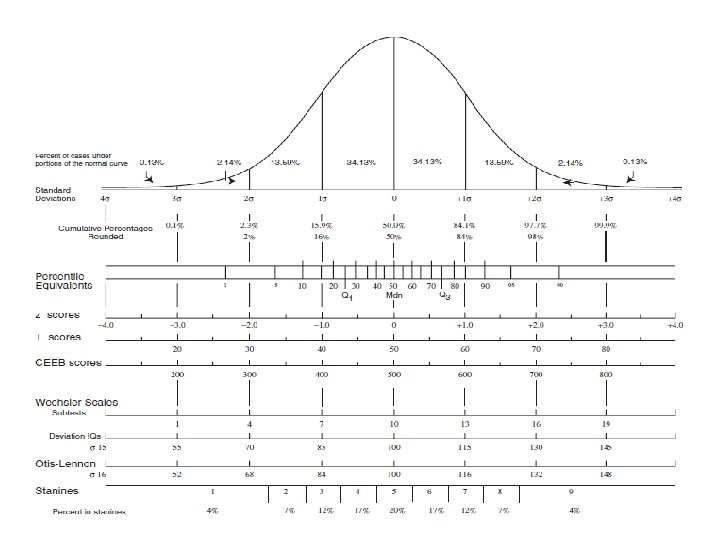
T- Scores Distribution normal Mean 50 = 50 th T-score SD = 10 Range 1 -100 No of units 100 1 unit (T-score) = 0, 1 SD Used for differentiating within -5 to +5 SD of normal distribution 1 th and 100 th scores used for results above |5| SD of standard normal distribution Differentiating within norm and pathology
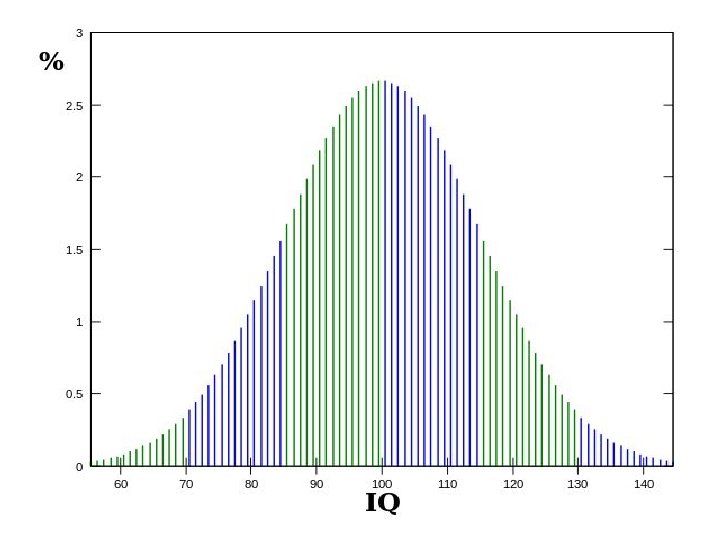
Other frequently used scales Wechsler scale (M = 100, SD = 15). College Entrance Examination Board (CEEB) scores (M = 500, SD = 100), used by the College Board’s SAT as well as by the Educational Testing Service e. g. Graduate Record Exam (GRE)
Reasons behind norms selection • Distribution shape of raw data different than normal (e. g. skew) uniform scales • Reliability of measurements and value of standard error of measurement • Utility of a test functioning within norm or pathology / extreme