Noctilucent Clouds Polar Mesospheric Summer Echoes and Dusty
, H.")


 instrument NLC PMSE")


 instrument NLC PMSE")


 analysis Upleg vs downleg PMSE observed with blunt probes and")


 180˚ 90˚ 0˚ • Quasi Trapped PA Distribution")


 Petrinec, GRL 1999")


- Slides: 48
Noctilucent Clouds, Polar Mesospheric Summer Echoes, and Dusty Plasmas R. B. Sheldon (1), H. D. Voss (2), P. A. Webb (3), W. D. Pesnell (3), R. A. Goldberg (3), J. Gumbel (4), M. P. Assis (2) 1) NSSTC, 2) Taylor University 3) NASA/GSFC, 4) Stockholm University November 3, 2006
NLC gallery
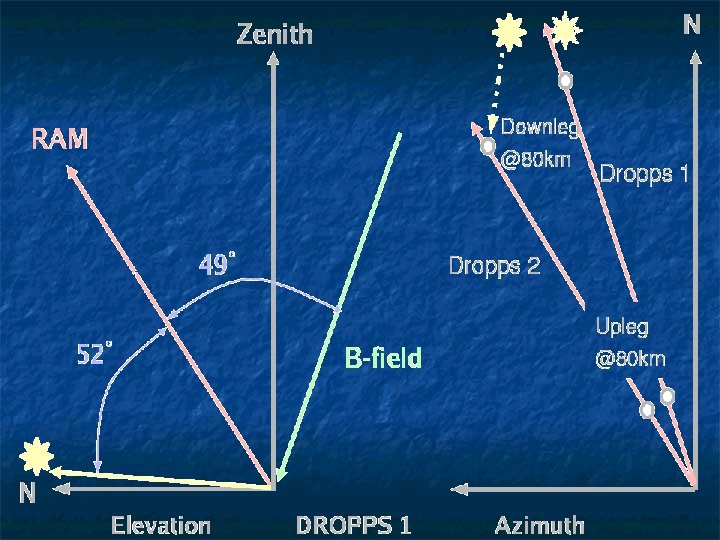
NLC viewing geometry
ISS, Courtesy NASA
Radar, Lidar observations
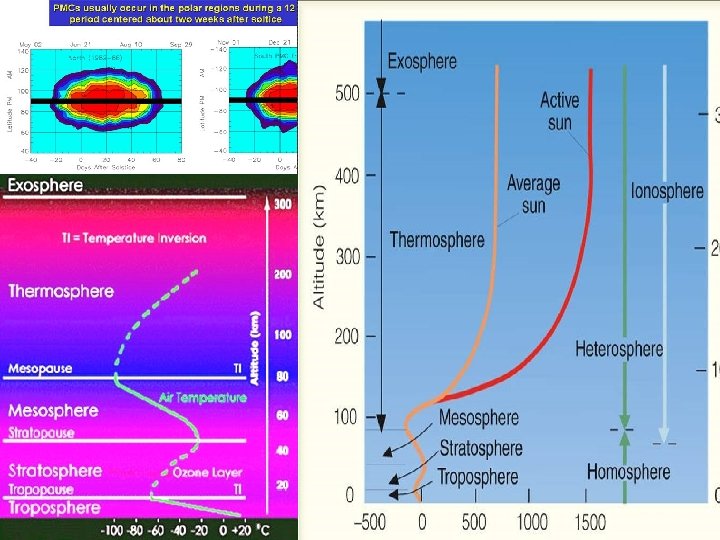
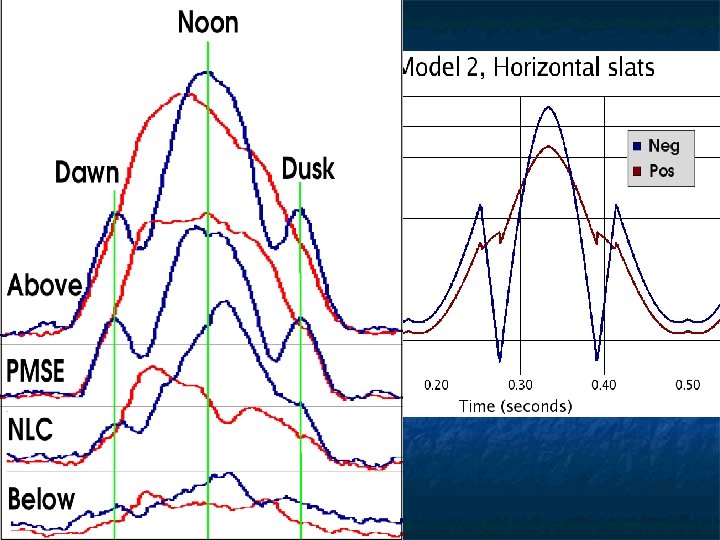
Observations & Open Questions NLC are >20 nm ice grains forming at the mesopause ~140 K. Reported since 1885. Peak occurrence after summer solstices. Explained by mesosphere weather PMSE first observed in 1979 at Poker Flat, are related to <10 nm charged ice grains usually in a layer 2 km above NLC, that reflect radar (50 MHz-2 GHz or 2'-100' wavelengths). Strongest at midnight, weakest at dusk. PMSE: How do they reflect? Why do they form? What relation to NLC?
How can aerosols reflect radar? Charged aerosols large plasma density? If they are positive, then electron density rises Draine & Sutin 87 argued for nm dust to become positive (because of large E-fields) Havnes flies retarding grids, Gumbel flies alternating plates, Rapp, Horanyi, et al fly magnets to exclude electrons and trap positive ions/aerosols PMSE’s have negative dust, NLC’s maybe positive? Charged aerosols large plasma gradients? Langmuir probes see “bite-outs” Havnes argues for dust vortices to make “holes” Multiple Langmuir probes never agree on “bite-outs” Reflections are coherent “Bragg”, not incoherent turbulence
DROPPS Rocket Concept Rocket in ram, 1 km/s Particle Impact, PID Particle Trap, PAT Particle Spect. , SSD Probes and Plasma Optical sensors, … e- precip. Wake effects Sublimation Rocket Interactions Goldberg et al. GRL 2001
PID Charge/Mass Telescopes and PAT Sun RAM SUN RAM
Particle Trap (PAT) instrument NLC PMSE
o
Sun-illumination Model
Spin averaged PAT upleg profiles PAT 1 Graphite PAT 2 Gold
Positively Charged Aerosols? ?
Dusty Plasma Lab, Abbas et. al. 2006
Photo. Currents to Rocket Sheath
Calculated Work Functions
Particle Trap (PAT) instrument NLC PMSE
Water Cluster Ion Charging Vostrikov 87, Andersson 97
Water Work Function Assuming the rocket work function = 5. 04 V Gold 5. 3 wet 4. 92 e. V Carbon 4. 9 wet 4. 87 e. V
Electron Density Bite-outs? ?
DEMETER Langmuir Probes
DROPPS Langmuir Probes Bite-outs are sharp decrease Ne< 1/10
Upleg and Downleg for Charge Telescope grids 1, 2 & 3
Big Bite-out, where's the PMSE?
Langmuir Probe Theory
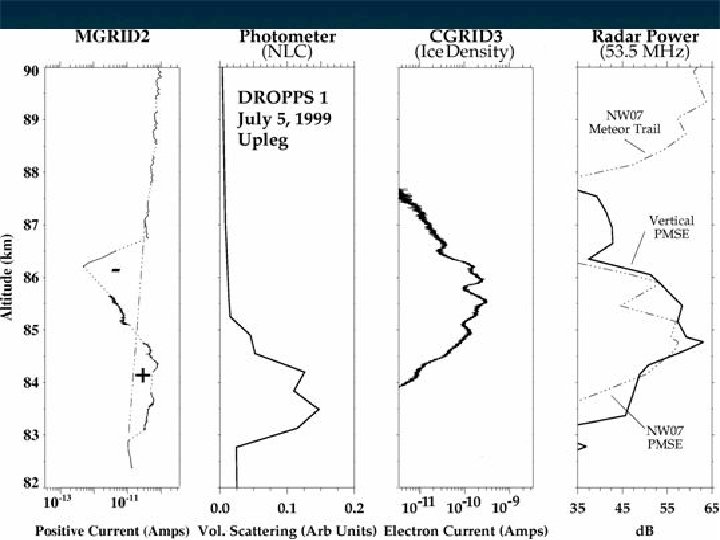
PID Upleg profile
PID Downleg profile
PID Telescopes Shock Langmuir Plasma Probe X 10 Density Cushioned Deceleration Heating Sublimation Clean Time (~200 ms ) Gumbel and Smiley Simulations
Chamber Clean Out Time t ~ x^2 / D where x= 8 cm length of telescope (or back plate to CGRID 2) and D = diffusion constant. D ~ 1/3 <v> L where <v> is average thermal speed and L is mean free path L ~ 1 / (n s) where the density (from Smiley) is 4 e 21/m^3 and s= cross section for water molecules or clusters. Guessing for s = pi (r^), where r= (cube root of density) = 0. 3 nm (and of course, water cluster ions might be bigger) s = 3 e-19 m 2 Giving L = 8 e-4 m Then <v> = sqrt(3 k. T/m) where m = 30 AMU, T = 500 K (from Smiley) giving 642 m/s Finally, D = 0. 18 and the diffusion time = x^2/D = 0. 08^2/0. 18 = 36 ms
Mitchell et al (2001) analysis Upleg vs downleg PMSE observed with blunt probes and Aft probe. Note +blunt temporally PRECEDES aft “biteout”. -blunt nearly simultaneous. UV Spin modulation strong on upleg, and contributes to “biteout” signature, less so on downleg.
Charged Dust Collection
Dust Trajectories in Charge Telescope SIMION
Particle size range for PAT and PID
PID and PAT compared
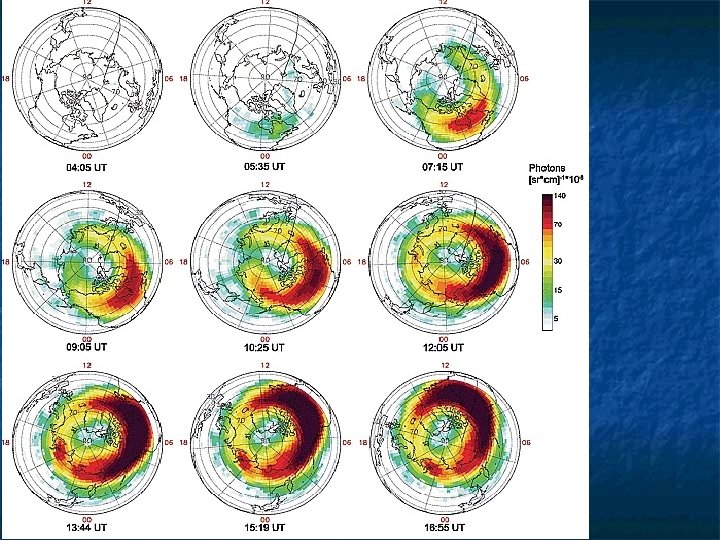
Energetic electron precipitation (E>40 ke. V) 180˚ 90˚ 0˚ • Quasi Trapped PA Distribution • Scattering of electrons 100 km • Pulsation Features (L=6. 2) • Major Ionization source • 104 electrons cm 2/sr/s • Painting PMSE particles
Ionospheric Chapman layer
Ice charging Model Ice grains are in equilibrium with UV and Ne. <q> ~ -1 Chapman layer e- are ~10 e. V <q> > -1 Abbas--proposal
Range and Secondary e- in Ice Minima!
PIXIE Xray vs Kp, Dst(1996 -98) Petrinec, GRL 1999
Precipitating Electron effects The dusk side is depleted in electrons The energy of the electrons changes the Chapman-layer altitude. Double peaked energy spetra would produce double layers in atmosphere. Electron energy is a function of MLT & magnetosphere activity.
Thomas, 2002 Dust Acoustic Waves U Iowa, Physics Today, 2004
Conclusions There is no evidence for positive charged aerosols. Water work function explains +current. Electron density bite-outs are likely instrumental PMSE's are subvisible <10 nm ice that has a high charge state. The charge state may be a direct result of >10 ke. V electron precipitation Dust Acoustic Waves may be responsible for the Bragg-reflected radar returns