NJAIRE Data Reporting A Overview of Current Reporting


")
")

 • BI Claimants (Insurers may vary)")
 § Reportable Claim Loss Amounts")


 or AIPSO (CAIP only)")


 – How can it")
 • Putting just 3")

 • AIPSO")
 • The")
 • What")
 • Common")
 • Common")
 • Review")
 • Exposures")


 • BI")


 • Reportable")

 • Loss")
 • More")
 • Checks")
 • Visual")
 • Visual")
 • Visual")

 • Checks")

- Slides: 44
NJAIRE Data Reporting A. Overview of Current Reporting Requirements B. Quality Reviews
Reporting Requirements 1. Call Forms § Form #3 – Accident Year 1997 – 2000, for policies issued or renewed before 7/1/1999 § Form #4 – Accident Year 1999 – present, for policies issued or renewed on or after 7/1/1999
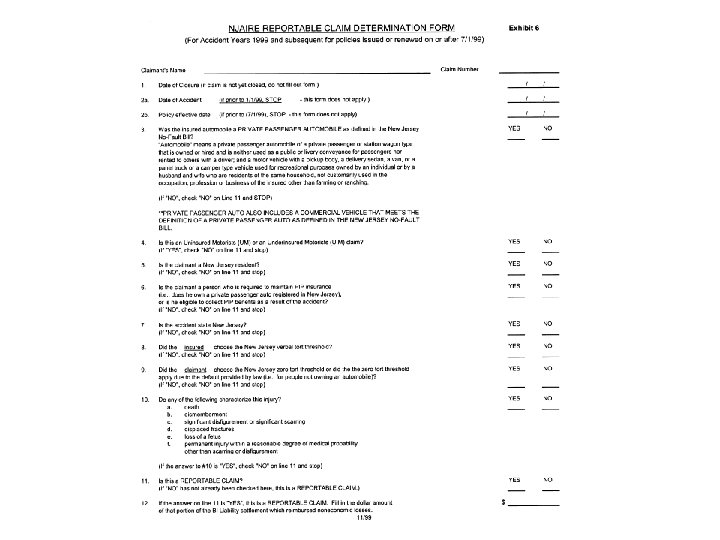
Reporting Requirements Sample Form:
Reporting Requirements Call Forms – Required Data § Earned Exposures by Threshold and Territory - Current Account Quarter Only, in Car Years
Reporting Requirements Earned Exposures by Threshold and Accident Year (Individual insurers may vary)
Reporting Requirements Exposure Thresholds for Accident Year 2005 (Individual insurers may vary)
Reporting Requirements Call Forms – Required Data § BI Paid Claimants by Insured Threshold by Territory and Accident Year
Reporting Requirements 2001 • Exposures (Insurers may vary) • BI Claimants (Insurers may vary)
Reporting Requirements Call Forms – Required Data (cont. ) § Reportable Claim Loss Amounts and Claimants by Territory and Accident Year § Loss Adjustment Expenses for Reportable Claims, Allocated and Unallocated (separately or combined)
Reporting Requirements A Reportable Claim is. . . • One that could not be made had the claimant selected the Verbal Threshold (Tort Limitation) , and • One where the claimant had the Zero Dollar Threshold (No Tort Limitation) and the insured selected the Verbal Threshold …the basis for establishing NJAIRE
Reporting Requirements How are Reportable Claims Identified? Via the proper Reportable Claim Determination Form: • Policies issued or renewed before 7/1/1999* • Policies issued or renewed on or after 7/1/1999* * This is when the definition of the Verbal Threshold changed.
Reporting Requirements How are Reportable Claims Identified? Reportable Claimants should be reported consistent with the settling of the claim. • • “Moving Day” “Grandma”
Reporting Requirements 2. Due Dates: to ISO (other than CAIP) or AIPSO (CAIP only) Account Quarter Due Date First Quarter May 15 Second Quarter August 15 Third Quarter November 15 Fourth Quarter February 15
Quality Reviews 1. Use of the Data 2. Financial Impact on Companies 3. Cost of Late, Erroneous Data 4. Detecting Errors at the Call Form Level
Quality Reviews 1. Use of the Data - The Call Form data is used to calculate: – the “pot” of losses to be reimbursed – each company’s assessment – each company’s reimbursement, plus its share of investment income – each company’s share of the NJAIRE administrative expenses
Quality Reviews 2. Financial Impact on Companies The magnitude of the financial transactions: – $ 13 million every quarter via the monthly payments and quarterly disbursements (the provisional transactions) – $ 650 million every year via the Annual Cash Settlement true-up
Quality Reviews 3. Cost of Late, Erroneous Data – The costs can be significant: • Late Data - $ 50 per work day • Resubmissions - $ 250 per quarter • Undetected Data Errors – can be over $1, 000!
Quality Reviews 3. Cost of Errors, Late Data (cont. ) – How can it be that much? • The ultimate Annual Cash Settlement formula assesses and reimburses based on BI claims: by threshold, territory & accident year • BI claims in the wrong place have a real financial impact
Quality Reviews 3. Cost of Errors, Late Data (cont. ) • Putting just 3 BI claims in the wrong threshold column can cost $ 70, 000 • Putting just 3 BI claims vs. zero threshold insureds in the wrong territory can cost $ 50, 000
Quality Reviews 4. Detecting Errors at the Call Form Level – What is done today? • ISO performs high level data checks upon receipt and in the financial transaction process • Companies are contacted regarding unusual data
Quality Reviews 4. Detecting Errors at the Call Form Level (cont. ) • AIPSO performs completeness checks and detailed checks on claim samples in the compliance audit process • This covers about 10 companies per year
Quality Reviews 4. Detecting Errors at the Call Form Level (cont. ) • The ISO and AIPSO checks alone cannot catch everything • What can companies do? What kind of reviews will be useful?
Quality Reviews 4. Detecting Errors at the Call Form Level (cont. ) • What types of errors are commonly made? • How many can be caught by expending a reasonable amount of company resources?
Quality Reviews 4. Detecting Errors at the Call Form Level (cont. ) • Common errors: Ø Exposures: car months, written, cumulative, threshold Ø BI Claims: threshold, territory
Quality Reviews 4. Detecting Errors at the Call Form Level (cont. ) • Common errors: Ø Reportables: claims included Ø ALAE, ULAE: reported separately and combined
Quality Reviews 4. Detecting Errors at the Call Form Level (cont. ) • Review needs: “Spreadsheet” Ø Current & Previous Quarter’s Data Ø Knowledge about your company Ø About 15 minutes per quarter
Quality Reviews 4. Detecting Errors at the Call Form Level (cont. ) • Exposures by threshold Ø Data needed: Statewide totals Ø General expectation: Volume +/-5% Ø Zero Dollar Exposures as % of total +/ -2%
Quality Reviews Company A: Earned Exposures by Quarter
Quality Reviews Company B: Earned Exposures by Quarter
Quality Reviews 4. Detecting Errors at the Call Form Level (cont. ) • BI Paid Claims by Threshold Ø Data needed: Statewide, all years Ø General expectation: Similar volume, allowing for credibility, yrs included Ø Claim Frequencies/Threshold similar, averaging 0. 5 -1. 5 per 100 car years
Quality Reviews Company A: BI Claimants by Quarter
Quality Reviews Company B: BI Claimants by Threshold and Quarter
Quality Reviews 4. Detecting Errors at the Call Form Level (cont. ) • Reportable Losses & Claims Ø Data needed: Statewide, all years Ø General expectations: § Pct. of Verbal: 4 -28%, avg. 15% § Avg. Loss: $3 -15, 000, avg. $7, 500
Quality Reviews Company B: Verbal and Reportable Claimants by Threshold and Quarter
Quality Reviews 4. Detecting Errors at the Call Form Level (cont. ) • Loss Adjustment Expenses Ø Data needed: Statewide by year Ø General expectation: 5 -35% of Reportable Losses, note: may lag Ø Company Methodology: Formula?
Quality Reviews 4. Detecting Errors at the Call Form Level (cont. ) • More difficult errors to detect: Ø Territory errors Ø Completeness
Quality Reviews 4. Detecting Errors at the Call Form Level (cont. ) • Checks that could help: Ø Territory: § Additional proofreading, if posting numbers § Visual checks
Quality Reviews 4. Detecting Errors at the Call Form Level (cont. ) • Visual Checks by Territory – Possible Problem areas: Ø Large change in Exposures by Qtr. Ø Exposures in Other Than Current Qtr.
Quality Reviews 4. Detecting Errors at the Call Form Level (cont. ) • Visual Checks by Territory – Possible Problem areas: Ø Zero Exposures > Verbal Exposures Ø Claims vs. Zero > Claims vs. Verbal
Quality Reviews 4. Detecting Errors at the Call Form Level (cont. ) • Visual Checks by Territory – Possible Problem areas: Ø Reportable Claims > Claims vs. Verbal Ø Reportable Losses w/o Reportable Claims, and vice-versa
Quality Reviews
Quality Reviews 4. Detecting Errors at the Call Form Level (cont. ) • Checks that could help: Ø Completeness § Other Existing Internal Data § Special Reports
Summary • Poor data quality can have a large, hidden impact on your company’s bottom line • With a reasonable effort you can help ensure that your company is properly assessed and reimbursed