MODELLING FUEL and ENERGY DEMAND OF HETEROGENOUS INDUSTRIAL


- Slides: 34

MODELLING FUEL (and ENERGY) DEMAND OF HETEROGENOUS INDUSTRIAL CONSUMERS Paolo Agnolucci Consumers at the Heart of the Energy System? Oxford, September 18 -19 2018 based of the work of Paolo Agnolucci, Vincenzo De Lipsis and Theodore Arvanitopoulos UCL ISR

Outline • • • Stylised facts: energy and fuel consumption Motivation Methodology Data Results for Energy Demand Results for Fuel Demands Presentation based on • Agnolucci, De Lipsis and Arvanitopoulos (2017), Energy Econ • Paper submitted here

Final Energy Consumption

Time Pattern of Energy Consumption in Industrial Subsectors

Time Pattern of Energy Intensity in Industrial Subsectors

Fuel consumption in the industrial sector

Time Pattern of Fuel Shares in Industrial Subsectors

Implications for our study • As granular as possible: 8 industrial subsectors Sector • Limited timespan as drawback: CHE ENV FBT MIN NFM OTH 1990 -2014 • Allowing both ways interaction between energy and fuel consumption • Fuel demand influence energy price through fuel consumption used as weights • Level of energy consumption proxing for scale effect in fuel demand PPP TEX Description Chemicals Engineering and Vehicles Food, Beverages and Tobacco Non-Metallic Mineral products Non-Ferrous Metals Other industries Pulp, Paper, Printing and Publishing Textiles, Clothing, Leather and Footwear

MOTIVATION

Our work contributes to existing evidence from a methodological and … Heterogeneity in terms of • level of consumption and energy intensity • patterns of the variables Aggregation bias • Difference in estimated parameters depending on the level of aggregation in the data • Findings influenced by functional relationship, extent of heterogeneity at microlevel, etc… • Magnitude of elasticities of substitution decrease with increasing levels of data aggregation (Stern 2012) • Opposite results in Blundell and Stoker (2005) and Halvorsen and Larsen (2013)

… empirical point of view … Uncertainty related to values of coefficients Changes in industrial sector composition • Further undermining aggregated approaches • Due to plausible difference in the parameters across sectors, also confirmed in our study System approach • Well-known advantages of FIML system approach to cointegration • Data-driven approach with regard to number of cointegration relationships • No restrictions on the relationship between fuel and energy demand on one side and their determinants • Exogeneity considerations dictated by the data – particular relevant to energy consumption and GVA

… with clear policy-making impact leading to … • Reliable and robust estimates of price elasticity are crucial information to assess the impact of price-based regulation • Developing the Industrial component of the BEIS Energy Demand Model (EDM) used in Energy and Emission Projections • Crucial importance of price and income elasticity in the projections, as well as regulation (not addressed by our model)

… a number of research questions • What is exactly the value of the relevant elasticities (price, income, own-price and cross-price)? • lack of consensus in the literature on magnitude of elasticities • Importance of such estimates for policy • Impact of heterogeneity in energy and fuel consumption across subsectors on elasticities • literature is dominated by studies at aggregate industrial level • patchy evidence (due to limited data) at the disaggregated level • Are this relationships stable over the period? • assessing structural stability across time, exogeneity and adjustment process

METHODOLOGY

Estimation based on cointegration approach… •

… incorporating energy demand in the first part, and the multiple fuel demand equations in the second part • Adjusted fuel share (to ensure 0 -1 boundaries) as function of fuel price relative to numeraire and energy consumption (ec) for each fuel i • Energy consumption function of GVA (y) and energy price (ep - weighted average of fuel prices)

DATA

Using standard energy data sources • Annual data in logs over 1990 -2014 • Variables • Fuel consumption: DUKES • Energy consumption: sum of fuel consumption • Fuel price: QEP - including carbon pricing from 2005 onwards • Energy price: weighted average of fuel prices • GVA: Index of production from ONS (2016) • Except for NFM, perfect match in taxonomy between DUKES and ONS • Strong evidence for unit roots required by cointegration approach (DF-GLS and ZA tests)

ENERGY DEMAND

Contributing to patchy existing empirical evidence for industrial subsectors and to … • Micro data or data from industrial subsectors sometimes used to estimated elasticities for the industrial subsector • Agnolucci (2009), Energy Economics • Caloghirou et al. (1997), Energy Economics • Christopoulos (2000) and Christopoulos and Tsionas (2002), both in , Energy Economics • Only three examples of analyses of elasticities for industrial subsectors • Floros and Vlachou (2005) , Energy Econ • Bjorner and Jensen (2002), Res Energy Econ • Steinbuks and Neuhoff (2014), JEEM

… reducing uncertainty with regard to elasticities in the UK • Substantial uncertainty as to the magnitude of price and output elasticities in the UK (and not many studies either) Study Model Estimation Period Price Economic activity Hunt et al. (2003) STSM with symmetric price 1971 - 1995 -0. 2 0. 71 Dimitropoulos et al. (2005) STSM with symmetric price 1967 - 1999 -0. 17 0. 70 Agnolucci (2009) Average of several panel estimators 1978 - 2004 -0. 64 0. 52 Agnolucci (2010) STSM with symmetric price 1973 - 2005 -0. 59 0. 45 Agnolucci (2010) STSM with asymmetric price 1973 - 2005 -0. 65 / -0. 47 / -0. 37 (1) 0. 48 Adeyemi and Hunt (2014) STSM with asymmetric price 1962 - 2010 -0. 51 (2) 0. 49

Results – Existence of cointegration • Strong evidence for 1 cointegrating vector among energy consumption, economic activity and energy price interpreted as energy demand • Results robust to approach used in the testing (Johansen and Bounds Testing procedure) • Continued with Johansen approach due to gain in efficiency • Standard diagnostics – all good (not shown here – see paper)

Results – value of elasticities • LR test on significance of parameters pointing at strong significance of price impact • Considerable heterogeneity with regard to the value of price and income elasticities, adjustment process (alpha) • LR test on weak exogeneity of energy price and output indicates exogeneity at 5% in all sectors but two – implausible results in OTH though • Some heterogeneity with regard to linear trend CHE ENV FBT MIN NFM OTH PPP TEX yt 0. 48(*) 0. 32 0. 50(+) 0. 36(+) 1. 10(+) 1. 42(*) 0. 24 0. 12 pt -0. 32(**) -0. 30(**) -0. 17(**) -0. 52(**) -0. 78(**) -0. 34(**) -0. 44(**) trend -0. 02 -0. 01 constant 3. 87 4. 47 3. 13 3. 04 1. 50 1. 09 4. 83 5. 80 Exogeneity 0. 58 0. 11 0. 22 0. 08 0. 93 (**) 0. 06

Results – Structural stability • Stability of cointegrating relationship based on test by Kejriwal and Perron (2010) strong evidence towards stability CHE KP statistics 4. 82 95% CV 10. 88 Notes qb = 2, trend, trimming = 0. 20 ENV 8. 99 10. 88 qb = 2, trend, trimming = 0. 20 FBT 15. 35 10. 88 qb = 2, trend, trimming = 0. 20, break date: 2009 MIN 6. 65 9. 27 qb = 1, trimming = 0. 15 8. 34 12. 27 qb = 2, trimming = 0. 20 OTH 11. 18 12. 27 qb = 2, trimming = 0. 20 PPP 9. 39 12. 27 qb = 2, trimming = 0. 20 TLC 5. 16 12. 27 qb = 2, trimming = 0. 20 NFM

FUEL DEMAND

Existing empirical approaches Methodological approaches • surprising popularity of single equation methods • Implying a number of discretionary specification choices (eg which other fuel price to include) System approach • Implemented through mainly static translog, Normalised Quadratic cost function or Logit model • Only one example of fuel demand through cointegrating VAR Recent implementations of cointegrating VARs for disaggregated industrial subsectors • only for electricity demand (Bernstein and Madlener 2015, Energy Econ) and fuel intensity (Møller 2017, Energy Econ) • not delivering reduction in estimated parameters through shares summing to one

Existing empirical evidence for gas demand Source Estimate Andersen et al. (2011) (-0. 62, -0. 31) Bardazzi et al. (2016) Burke and Yang (2016) Enevoldsen et al. (2007) Huntington (2007) Renou-Maissant (1999) Serletis et al. (2010) Serletis and Shahmoradi (2008) -0. 82 (-1. 09, -1. 00) -0. 11 (-0. 29, -0. 15) -0. 65 -0. 13 (-1. 50, -1. 01) Steinbuks (2012) (-0. 94, -0. 28) Suh (2016) -0. 20 Notes Long-run, UK, industrial subsectors Italy International Nordic countries US UK UK US Long-run, UK, heating and all processes respectively US

Existing empirical evidence for electricity demand Source Bardazzi et al. (2016) Bernstain and Madlener (2015) Bjørner et al. (2001) Dilaver and Hunt (2012) Enevoldsen et al. (2007) Jamil and Ahmad (2011) Paul et al. (2009) Renou-Maissant (1999) Ros (2015) Serletis et al. (2010) Steinbuks (2012) Suh (2016) Estimate -0. 46 (-0. 52, -0. 30) -0. 55 -0. 16 (-0. 28, -0. 10) -1. 22 -0. 40 -0. 31 (-0. 87, -0. 52) -0. 004 (-1. 11, -0. 23) -0. 11 Notes Italy Long-run, industrial sub-sectors Denmark Turkey Nordic countries Long-run, Pakistan US UK Long-run, UK, heating and all processes respectively US

Results – Existence of cointegration • One fuel discarded as essentially constant across time (coal or oil) • Third fuel used as residual – as sum of shares need to add to unity • Strong and unanimous evidence for 2 cointegrating vectors among electricity share, gas share, their prices (related to the numeraire), and energy consumption (not shown here – see paper) • Continued with Johansen approach as the only approach able to handle multiple cointegrating vectors • Standard diagnostics – all good (not shown here – see paper)

Results – value of elasticities Table showing • two cointegrating vectors (electricity and gas demand), own- and cross-price elasticity for each demand • heterogeneity with regard to the value of elasticities and linear trend • heterogeneity with regard to substitutability and complementarity between fuels • gas more price-elastic • gas increases with total energy, electricity falls (in almost all subsectors). Electricity Price Gas Price Energy Trend Constant CHE Ele Gas -0. 22 -0. 47 -1. 37 -0. 69 2. 12 4. 40 -16. 62 ENV Ele Gas -0. 74 -0. 08 -0. 71 0. 45 1. 16 -2. 95 -9. 22 Ele -0. 49 -0. 55 FBT Gas -0. 67 -0. 08 MIN Ele Gas -0. 44 0. 48 -0. 52 -1. 68 -0. 84 1. 87 -0. 01 0. 05 5. 94 -14. 10 NFM Ele Gas -1. 39 1. 12 -0. 62 0. 04 0. 00 1. 94 -2. 68 OTH Ele Gas -1. 90 0. 14 -0. 13 -1. 31 -1. 56 0. 38 15. 75 -3. 13 PPP Ele Gas -0. 61 0. 32 1. 14 -1. 61 -1. 50 1. 82 11. 29 -13. 82 TEX Ele Gas -0. 22 -1. 17 -2. 40 -0. 62 1. 52 -0. 03 -0. 06 2. 63 -8. 76

Results – value of elasticities • Very strong statistical significance of the long-run parameters • Strong evidence against exogeneity of prices and level of energy consumption Own price - electricity Own price - gas Cross price Energy CHE ENV FBT MIN NFM OTH PPP TEX 4. 80(*) 7. 86(**) 7. 88(*) 8. 41(**) 7. 05(**) 21. 85(**) 9. 31(**) 0. 52 32. 32(**) 12. 25(**) 5. 58(*) 5. 26(*) 22. 69(**) 16. 84(**) 13. 37(**) 10. 64(**) 9. 05(**) 0. 08 13. 30(**) 5. 30(**) 1. 63 16. 65(**) 17. 03(**) 52. 57(**) 13. 03(**) 16. 60(**) 44. 76(**) 13. 23(**) 9. 00(**) Trend 9. 80(**) 22. 39(**) 8. 14(**) All 57. 97(**) 34. 28(**) 9. 55(**) 56. 42(**) 38. 58(**) 82. 00(**) 40. 47(**) 50. 91(**) Exogeneity 37. 23(**) 26. 62(**) 17. 72(**) 32. 51(**) 4. 84 38. 92(**) 21. 53(**) 34. 73(**)

SUMMING UP

Summing Up (1) • Proving the validity of cointegration methods for estimation of both energy and fuel demand in disaggregated industrial subsectors • Providing an innovative, coherent and parsimonious approach to estimation of fuel demands • Using standard methodologies with standard datasets for standard taxonomy can be replicated across (at least) OECD countries

Summing Up (2) • Elasticities for the aggregated industrial subsectors in line with those in the literature therefore confirming validity of those we estimated for individual subsectors • Greater than previously thought heterogeneity with regard to • values of elasticities and linear trends, • speed of adjustment, • pattern of substitution and complementarity • Confirming increasing magnitude of elasticities in case of fuel demand when estimated on disaggregated data and gas being more price-responsive • Delivering key information for development of BEIS EDM and Energy and Emission projections, and therefore policy making
 Heterogeneous mixture of intermediate sized particles
 Heterogeneous team
 Heterogeneous audience
 Heterogeneous class
 Heterogenous
 Solutions are heterogenous mixtures
 Module 5 supply and demand introduction and demand
 Fossil fuel energy advantages and disadvantages
 Pron and cons
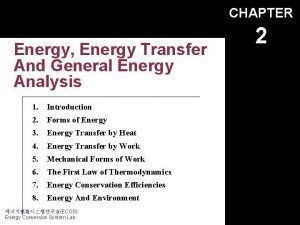
 Energy energy transfer and general energy analysis
 Energy energy transfer and general energy analysis
 Measures to correct excess and deficient demand
 Difference between dependent and independent demand
 Halimbawa ng quantity demanded
 Demand forecasting in managerial economics
 Distinguish between individual demand and market demand
 Dependent demand items
 How does fossil fuel produce energy
 A fuel’s net energy yield is correctly defined as
 Deterministic and stochastic inventory models
 Individual demand vs market demand
 Dependent demand examples
 Water supply information
 Geometric modeling in cad
 Trendlines and regression analysis
 Problem solving and modelling task example
 Technological modelling
 Energy based model
 Modeling tools in java
 Molecular modelling laboratory
 Modelling madness what's new
 Modelling rich interaction
 Private equity case study
 Homology modelling steps
 Hair modelling


