Maximum Entropy versus Random Utility Theory in Discrete


 is a vector describing how product I scores on various")


, …X(n)")

 was distributed Gaussian, RUM gave")


 be the fraction of buyers")
 to maximize – Σ P(ij) ln(P(ij))")
 ~ exp(K’X(i)+K”X(j)+X(j) Q X(i)) • P(j) ~ Σ P(ij)")


 • We observe the average attribute scores of")
 is Gaussian")


 • In contrast, the maxent model is equivalent")
 • 4525 Observations of Vehicles and their Variants in a given")


- Slides: 29
Maximum Entropy versus Random Utility Theory in Discrete Choice Models Bob Bordley Adjunct Professor University of Michigan, Ann Arbordley@umich. edu
Independence of Irrelevant Alternatives • • If a new product is introduced or if a change is made in existing product i, THEN the relative probability of buying product j versus k will be unaffected (for j and k products different from i)
Logit Model • X(i) is a vector describing how product I scores on various attributes • W is a vector describing the importance the customer attaches to attributes • P(i|w) = exp(W’X)/ [ exp(W’ X(k))]
But Logit Model and IIA is inadequate • It does not necessarily make sense because products which compete closely with the product being changed (or introduced) should be impacted differently than products which don’t compete closely • Note that the assumption may be adequate for certain choice sets while being inadequate for others.
Mc. Fadden’s Solution • Random utility theory assumes that individuals maximize utility but that modelers only observe noisy estimates of that utility • A simple form of random utility theory model leads to the logit model with IIA • More sophisticated forms of random utility theory lead to choice models without IIA • These are often called random utility models (RUM)
But consumers do not appear to maximize utility functions! Vernon Smith, winner of Nobel Prize in Economics, wrote in his Nobel Prize address: Psychologists and behavioral economists who study decision behavior almost uniformly report Results contrary to rational theory…. imagine the strain on the brain's resources if at the supermarket a shopper were required to explicitly evaluate his preferences for every combination of the tens of thousands of grocery items that are feasible for a given budget.
Undermines main theoretical justification for random utility model • Random utility models assume that individuals maximize utility --- although modelers don’t observe that utility • If individuals do not maximize utility, it’s harder to justify empirical models of individual behavior that impose it We can still justify these models if they have empirically plausible properties
An Example of Where They Don’t have Empirically Plausible Properties • Mixed Logit Model can closely approximate virtually any random utility model (Mc. Fadden and Train) • Mixed Logit Model has the form – P(i) ~∫ P(i|w) d. F(w) – with P(i|w)=[exp(W’X(i))/[ exp(W’ X(k))] • Typically d. F(W) is considered Gaussian
Our Example • Consider the Hypothetical Case where the distribution of attributes X(1), …X(n) has a Gaussian Distribution • Then it can be shown that • P(i) ~ exp((X(i)-m)W(X(i)-m) • Where – m and W depend on the mean and variance-covariance of attribute scores – W is positive-define – and P(i) violates IIA • But P(i) increases at an increasing rate as X(i) increases • Also (X(i)-m)W(X(i)-m) increases at an increasing rate • Some would say this violates the intuition about diminishing returns to improvements in an attribute
Conclusion • The Assumption of Customer Rationality underlying RUM is untrue • The properties of RUM models (as reflected in mixed logit) are questionable in the Gaussian case • Should we consider an alternative approach? • How about an approach based on choosing the choice probability which maximizes entropy subject to constraints determined by what you observe in the market? • Ehsan Soofi proposed such an approach and argued as equivalent to RUM. • This paper presents a variation on this approach which is different from RUM.
Comparison of RUM • In the case where X(i) was distributed Gaussian, RUM gave – P(i) ~ exp((X(i)-m)W(X(i)-m)) – A convex anti-ideal model – The more a product improves away from m, the better • In the same case, the Maxent approach gives – P(i) ~ exp(-(X-m’)W’(X-m’)) – A concave ideal-point model – The closer a product approaches m, the better. • Ideal point models are widely used in the literature • So Maxent properties are, in this case, more intuitive • Maxent makes no assumption of customer rationality
UNUSUAL FINDING: Maxent Logit, unlike RUM Logit, Violates Independence of Irrelevant Alternatives! • Standard Logit – P(i) ~ exp(W’X) – W reflects customer preferences and is independent of the choice set • Maxent Logit – P(i) ~ exp(K’X) – K is a Lagrangian multiplier which is chosen, for some vector M, to enforce the constraint • P(1)X(1)+…. P(n)X(n) = M – Changes in attributes or addition of new products will violated this constraint unless K changes – If K changes when the choice set changes, P(i) can violate independence of irrelevant alternatives
Example: Red-Bus/Blue-Bus Paradox • Suppose m is proportion of customers that take the bus • Suppose we only have one red bus and one car and 50% of people take the red bus. • Let I=1 if bus and I=0 else. • Then logit model predicts 50% of people drive bus. But if we then add a blue bus (so that we have a red bus, a blue bus and a car), the probability of driving a bus goes to (2/3) • But the weight, K, in the maxent model automatically adjust to ensure that only 50% of the people drive the bus. Hence adding a blue bus causes the weight to chance so that the probability of driving a bus remains at 50% • Thus the celebrated `red-bus/blue-bus’ problem which plagues the logit model is avoided by the maxent logit model.
1 st Choice/Second Choice with Maxent • Let P(i|j) be the fraction of buyers of product j with I as a first choice • Let P(j) be the fraction of buyers of product j • Let P(ij) be the fraction of buyers with i as a second choice and j as a first choice. • Define M 1 to be the average score of first choice products on the various attributes • Define M 2 to be the average score of second choice products on the various attributes • Define V(ij) to be the covariance between – the attributes, X(j) of the first choice and – the attributes X(i), of the second choice
Maxent Model • Choose a distribution for P(ij) to maximize – Σ P(ij) ln(P(ij)) • subject to – Σ Σ P(ij) = 1 – Σ Σ P(ij) X(i) = M 2 (mean score of 2 nd choice) – Σ Σ P(ij) X(i) = M 1 (mean score of 1 st choice) – Σ Σ P(ij) (X(i)-M 2)(X(j)-M 1)=V
Maxent Result • P(ij) ~ exp(K’X(i)+K”X(j)+X(j) Q X(i)) • P(j) ~ Σ P(ij)
Questions?
Setting up the Problem • Let x be a particular set of attribute scores (e. g. , a fuel economy of 20 mpg and a price of $20 K) • Let P(x, w) be the joint probability of an individual buying a product with attribute scores x and having importance weights w • Let f(x) be probability that a a product with attribute score x is available for purchase to the individual • We observe the average attribute scores of products purchased on the market (e. g. , the US vehicle fleet might have an average mpg of 23 mpg with the average vehicle price being $25 K) • We also observe the variance-covariance matrix of those attribute scores (e. g. , we know that more fuel efficient vehicles are generally smaller) • Suppose we believe that we can also estimate the mean and variancecovariance of the parameters w as well as their correlation with attribute scores – Thus we expect that individuals who weight fuel economy more highly tend to buy vehicles that score well on fuel economy
What we Know (or could Know) • We observe the average attribute scores of products purchased on the market (e. g. , the US vehicle fleet might have an average mpg of 23 mpg with the average vehicle price being $25 K) • We also observe the variance-covariance matrix of those attribute scores (e. g. , we know that more fuel efficient vehicles are generally smaller) • Suppose we believe that we can also estimate the mean and variance-covariance of the parameters w • We also believe there is a correlation between the importance an individual puts on an attribute and the attribute score of the vehicle they buy – Thus we expect that individuals who weight fuel economy more highly tend to buy vehicles that score well on fuel economy
Maxent Preliminary Solution • P(x, w) is Gaussian
Independence of Irrelevant Alternatives is Violated • Introducing a new product changes the shadow price of that combination of attributes. • In a Gaussian model, this changes the choice probability for all attribute scores (and especially for those products whose scores are similar to the product which was newly introduced. )
But you can’t always get what you want… • The logit model describes your probability of choose product I in terms of the ratio of the desirability of product I to the sum of the desirability of all other products • This is often called the choice set. You cannot buy a product that is not available • Another way of modeling availability is to assign a large cost to products that are unavailable • This is useful in that we can also distinguish between products that are easy to obtain, somewhat harder to obtain as well as products that are impossible to obtain. • It’s often referred to as a shadow price in constrained optimization
Choice Models with Choice Sets • So we can eliminate the need to explicitly enumerate the alternatives in the choice set by simply introduce an attribute that reflects the relative availability of a set of attribute scores • We distinguish between – The availability scores we assign to a product. For example, the vehicle we currently own is highly available (as long as it still works). Buying a new vehicle that exists at a dealership is somewhat more difficult. Buying a new vehicle that doesn’t exist is impossible unless we’re rich enough to have it custom-built. – The unobserved weight which is attached to availability --- which is designed to reflects this `shadow’ price • The correlation between the probability of purchasing a product and its unavailability is obviously negative • So we need to supplement P(x, w) to include this new attribute and its relative importance.
Relationship to Random Utility Models • The most widely used random utility model which generalizes logit is the mixed logit. • This model – Defines a logit model with importance weights w – Integrates the logit model over some distribution (generally Gaussian) in w to get the choice model • It can be shown that if the distribution of attributes, x, in the choice set is Gaussian, then – The mixed logit model is equivalent to – Defining a logit model with a quadratic utility • Where the quadratic utility for each choice alternative i depends on the mean and variance-covariance of attribute scores across the choice set • Quadratic utility is in the form of an anti-ideal point model where scores that exceed the reference score attract higher marketshare – The normality assumption can be made to hold by Box-Cox transformations as long as attributes are somewhat continuous. It will not hold for categorical (zero-one) variables • Nonetheless it provides a simple point of comparison with the maxent model •
Relationship to Random Utility Models(cont. ) • In contrast, the maxent model is equivalent to – Defining a logit model with a quadratic utility • Where the quadratic utility for each choice alternative I depends on the mean and variance-covariance of attribute scores across the choice set • Quadratic utility is in the form of an ideal-point model where scores that are closer to the reference score attract higher marketshare. • Thus given a Gaussian distribution of alternatives – Mixed logit uses a quadratic anti-ideal point model • In this model, incremental improvements on an attribute increase utility at an accelerating rate. – Maxent uses a quadratic ideal point model • In this model, incremental improvements on an attribute increase utility at a decreasing rate. • Most people would consider the ideal point (and thus the maxent model) more intuitive. However further work is needed.
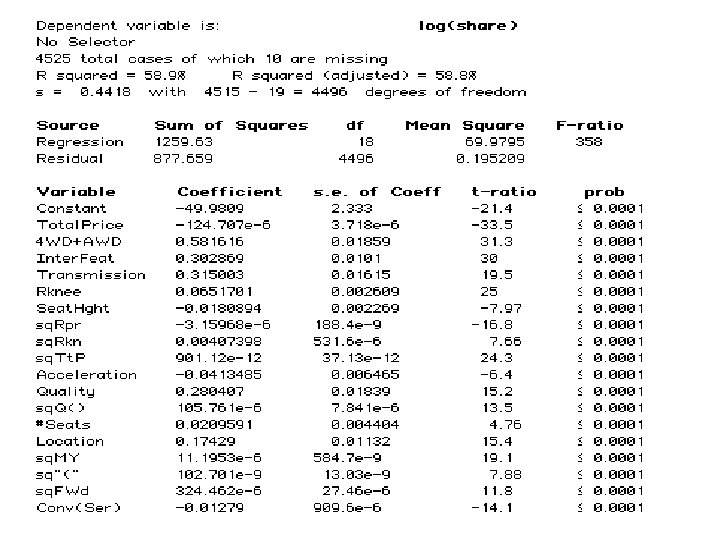
Estimation(1995 MY Data) • 4525 Observations of Vehicles and their Variants in a given Year • Gaussian Model: Logarithm of share is Quadratic in Attributes • Relevant Variables – Categorical • Is Vehicle 4 -Wheel Drive or All-Wheel Drive? • Internal Features (Base, Standard, Deluxe) • Transmission (Manual, Automatic) – Non-Categorical • • • Total Price (and its Square) Rear Knee Room (and its Square)---`measures size’ Acceleration Quality (and its square) --- `measures workmanship’ Incentives (and its square) Repair Frequency (and its square) Model Year (and its square) --- `measures newness’ Dealer location (average miles to a dealer) # of Seats
Application: Corporate Strategy • • • If π is variable profit per unit sold If S is the potential sales in a segment Let P = exp(U)/[exp(U)+1] If U* =U/N, i. e. , the perceived value of the firm’s portfolio per new product program If N is the number of new products If C is the cost per new product program, then the optimal number of new product programs, N, satisfies π exp(U*N)/[1+exp(U*N)] - CN so that N*=[ln( C) – ln[U* π – C]]/U* Optimal profit is C[1 – U*N*]/U*
Conclusion • • • Random Utility Models are an almost universally accepted way of addressing discrete choice models But the justification for random utility models assumes that consumers actually do maximize a utility function even though analysts cannot observe it exactly Empirical evidence strongly suggests this assumption is false Since extensive tools have been developed to apply random utility models, they will undoubtedly remain the tools of choice in the near-term But in the long-term, we need discrete choice models that are not based on faulty assumptions Where should we look? – The building block for discrete choice mdoels based on random utility theory is the logit model. – Soofi showed that the building block for discrete choice models based on maxent is also the logit model. – Hence it’s natural to focus on maxent for the next-generation of discrete choice models • This paper present the results of an application to the automotive segment