Long Island Sound has suffered from hypoxia for


 • Major environmental changes in the early 1800’s: • Increased Corg and")
 • Hypoxic events may have occurred since the early 1800’s but were")
- Slides: 28
Long Island Sound has suffered from hypoxia for decades: • Result of Global Warming? • Eutrophication? • It has always been like this…. . .
EAST LIS WEST LIS NARROWS CENTRAL LIS
Sampling mud
Design “proxies” for paleoenvironmental research such as • Salinity • Temperature • Faunal/floral characteristics • Oxygen saturation • Metals • Sewage Calibrate proxies for these parameters on the modern LIS environment
137 Cs Chestnut blight 210 Pb Onset of hatting industry Ragweed pollen 14 C
137 CS HG 14 C
MEASURES OF ORGANIC PRODUCTIVITY: • BURIAL RATE OF ORGANIC CARBON • BURIAL RATE OF DIATOM “SKELETONS” (BIOGENIC SILICA) • PRODUCTION RATE OF HETEROTROPHS LIKE FORAMINIFERA
Corg, %
Elphidium excavatum
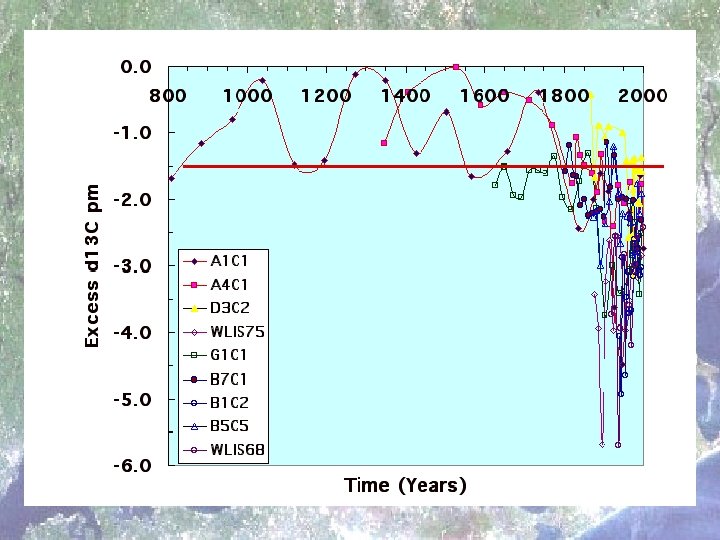
The d 13 C values in foram “shells” are related to mixing of sea and river water (salinity) and to addition of “light carbon” from photosynthetic productivity
Estimate d 13 C variability not related to mixing of sea and river water (d 13 C*) • • Measure d 18 O values in foraminiferal shells Calculate d 18 O of water using BWT Estimate salinity from LIS mixing model Estimate d 13 C of dissolved inorganic carbonate using the LIS mixing model • Subtract calculated - observed values: d 13 C * = d 13 Ccarbonate - d 13 Ccalculated in water
Core data
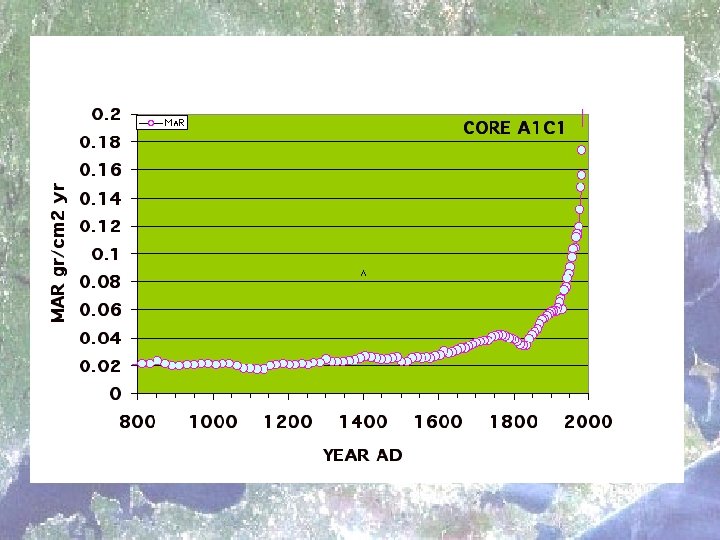
% organic Carbon and d 13 C* CORE A 1 C 1 Year AD
The d 13 C* value indicates the amount of oxidized Corg that was added to the bottom water column. The d 13 C* value serves as an indirect proxy for OCI or Oxygen Consumption Index (Level of Paleo Oxygenation)
CONCLUSIONS (1) • Major environmental changes in the early 1800’s: • Increased Corg and Bsi storage • Isotopically lighter carbon, lower O 2 levels in bottom waters, sewage indicators, and metal pollutants • Increased productivity of benthic foraminifera
CONCLUSIONS (2) • Hypoxic events may have occurred since the early 1800’s but were absent before that time. They are severe in the late 20 th century. Why? – Enhanced productivity==> more Corg productivity – Modern global warming==> higher rate of Corg decompositon and increased water stratification HYPOXIA NEED A COMBINATION OF HIGH BWT AND HIGH Corg LOADING