Kwa ZuluNatal The Premier Trade and Investment Destination


")
 Value of exports Share")


 •")


- Slides: 32
Kwa. Zulu-Natal The Premier Trade and Investment Destination Agriculture Export Information Sharing 27 – 28 March 2014
AGENDA KWAZULU-NATAL THE TRADE HUB OF THE COUNTRY TRADE AND INVESTMENT KWAZULU-NATAL ROLE OF TRADE DEVELOPMENT & PROMOTION TRADE TRENDS AND STATISTICS TRADE DEVELOPMENT & PROMOTION ACTIVITIES TRADE PROMOTION CALENDAR
TRADE HUB OF SOUTH AFRICA § 54 Countries on the African continent 39 surrounding islands § 31 000 km of Coastline § 71 Commercial Ports §More than 90% of world trade via sea §Only 12% inter regional trade in Africa §Shortest Trade Route between Shangai (China) and Santos (Brazil) is üvia South Africa 11, 270 nm = 22 days @ 21 knots üvia Panama Canal 13, 130 nm = 26 days + transit fee üvia Suez Canal 13, 590 nm = 27 days + transit fee
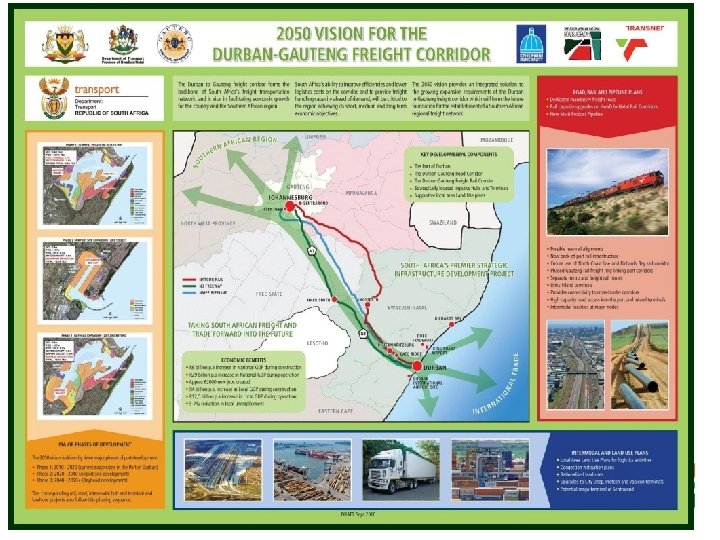
EXPORT INFRASTRUCTURE Durban Largest & Busiest Seaport in SA 2. 6 m TEU’s p. a. - 64% exports 4 556 vessels (35%) Upgrade - 4. 5 m TEU’s 2017 Houses South Africa's largest Car Terminal Richards Bay SA Premier Bulk Port – 82. 6 metric tonnes Africa’s largest Coal Terminal - 91 million tonnes per annum Home the one of SA’s Industrial Development Zones Dube Trade. Port World Class Air Logistics Platform 2040 Hectares developed over 60 yrs Dube City – 12 hectare site increasing to 24 hectares on completion Agri-Zone - 64 hectares Cyber-Zone
Southern Hub for World Shipping Routes The position of South Africa’s ports system enables it to access to South-South trade, Far East trade, Europe & USA, East & West Africa regional trade Shortest Trade Route between Shanghai and Santos is via South Africa 11, 270 nm = 22 days @ 21 knots via Panama Canal 13, 130 nm = 26 days + transit fee via Suez Canal 13, 590 nm = 27 days + transit fee
The Official Trade and Investment Promotion Agency of the Provincial Government
TIKZN OPERATIONAL UNITS Investment Promotion Business Retention and Expansion Corporate Services TIKZN Export Development and Promotion Marketing and Communications Knowledge Management
Role of Trade Development & Promotion • Exporter Development • Market Development • Information and Trade Intelligence • Assistance wıth Incentives • Coordinatıon of Trade Shows • Capacity Buildıng for Exporters • Export Awarness
EXPORT FACTS
Value of Kwa. Zulu-Natal Exports R 90 R 80 77, 4 75, 0 R 70 63, 5 Billion Rand R 60 R 50 58, 9 56, 7 50, 4 R 40 R 30 R 20 R 10 R 0 2006, 5 2007, 5 2008, 5 Year Billion Rand Value of Kwa. Zulu-Natal exports[Source: Mthente, 2013 using Quantec data] 2009, 5 2010, 5 2011
Kwa. Zulu-Natal Share of Exports in 2011 Misc manufactured 1, 0% Services 0, 0% Animals & animal products 0, 2% Vegetable products 1, 9% Foodstuffs 1, 5% Machinery/electrical 5, 7% Transportation equipment 16. 7% Mineral products 15. 7% Chemical & allied industries 9, 0% Plastics/rubbers 1, 8% Hides, skins, leather & fur 0, 1% Wood & wood products Textiles 1, 1% 6, 4% Metals 38, 0% Kwa. Zulu-Natal exports by sector, 2011 [Source: Mthente 2013 using Quantec data] Stone/glass 0, 1% Footwear/headgear 0, 1%
Export Products from KZN • Automotive parts and components • Sugar, prepared foodstuffs and beverages • Chemicals and Plastics • Furniture, arts & craft • Pulp & paper • Engineering services • Electronic, communication devices • Leisure boats, transport and logistics equipment • Machinery • Jewellery, base metals • Clothing, textile, body armor
Kwa. Zulu-Natal product groups and contribution to exports Product group Value of exports (2011) Average annual growth rate 2006 -2011 Value of exports (2012) Average annual growth rate 2006 -2012 Metals (H 72 -83) R 29. 8 Billion 19. 1% R 29. 2 Billion 15. 4% Transport equipment (H 86 -89 & 98) R 12. 9 Billion 11. 0% R 15. 4 Billion 14. 1% Mineral products (H 25 -27) R 12. 1 Billion 19. 2% R 17. 2 Billion 29. 9% Chemical & allied industries (H 28 -38) R 7. 0 Billion 19. 5% R 15. 4 Billion 14. 1% Wood, paper & pulp (H 44 -49) R 5. 0 Billion -5. 6% R 4. 4 Billion -6. 0% Machinery/electrical (H 84 -85) R 4. 4 Billion 2. 2% R 5. 0 Billion 4. 5% R 1. 5 Billion 54. 5% R 6. 3 Billion 13. 5% Plastics/rubbers (H 39 -40) R 1. 4 Billion 12. 5% R 1. 5 Billion 12. 8% Prepared foodstuffs (H 16 -24) R 1. 2 Billion -12. 2% R 1. 7 Billion -7. 1% Textiles (H 50 -63) R 825. 3 Million -3. 3% R 906 Million -1. 4% Misc manufactured articles (H 90 -97) R 813. 6 Million 17. 8% R 559 Million 5. 0% R 144. 7 Million 35. 6% R 174 Million 39. 1% R 104. 9 Million 2. 2% R 126 Million 5. 7% R 72. 8 Million -15. 6% R 143 Million -9. 5% Hides, skins, leather & fur (H 41 -43) R 69. 1 Million 15. 7% R 96 Million 25. 1% Other unclassified goods and services (H 99) R 4. 3 Million -2. 7% R 116 Million 376. 7% Vegetable products and fats (H 6 -15) Animals & animal products (H 1 -5) Footgear and headgear (H 64 -67) Stone/glass (H 68 -71) [Source: Mthente 2013, using Quantec data]
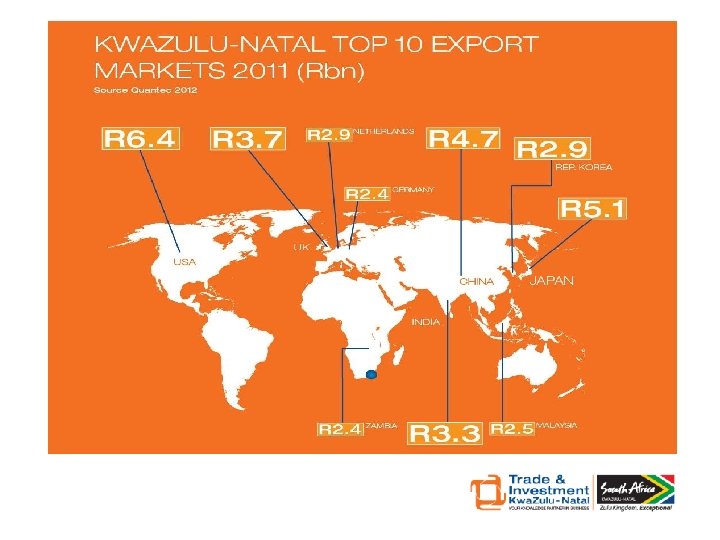
Kwa. Zulu-Natal’s top 15 export markets Country (ranking in 2006) Value of exports Share of total Average annual growth (2011) value of exports rate 2006 -2011 Top export product (HS 4 -digit) US (1) R 6. 4 Billion 8. 2% 0. 0% Titanium ores and concentrates (H 2614) Japan (2) R 5. 2 Billion 6. 7% 0. 7% Unwrought aluminium (H 7601) China (8) R 4. 7 Billion 6. 1% 60. 4% Niobium tantalum vanadium zirconium ores, concentrates (H 2615) UK (3) R 3. 7 Billion 4. 8% -2. 4% Motor vehicles for the transport of goods (HS 8704) India (22) R 3. 4 Billion 4. 3% 73. 7% Ferrous waste or scrap, ingots, iron or steel (HS 7204) Republic of Korea (13) R 3. 0 Billion 3. 8% 43. 4% Copper, copper alloy, waste or scrap (H 7404) Netherlands (4) R 2. 9 Billion 3. 8% -5. 3% Iron ore and concentrates, roasted iron pyrites (HS 2601) Malaysia (23) R 2. 6 Billion 3. 3% 51. 4% Rolled stainless steel sheet, (HS 7219) Zambia (17) R 2. 5 Billion 3. 2% 35. 5% Motor vehicles for the transport of goods (HS 8704) Germany (5) R 2. 4 Billion 3. 1% 9. 6% Aluminium tubes and pipes (H 7608) Zimbabwe (24) R 2. 3 Billion 2. 9% 44. 5% Motor vehicles for the transport of goods (HS 8704) Belgium (6) R 2. 1 Billion 2. 7% 10. 5% Aluminium plates, sheets and strip, thickness > 0. 2 mm (H 7606) Spain (7) R 2. 1 Billion 2. 7% 14. 2% Niobium tantalum vanadium zirconium ores, concentrates (H 2615) Algeria (15) R 2. 0 Billion 2. 6% 25. 5% Motor vehicles for the transport of goods (HS 8704) Switzerland (37) R 2. 0 Billion 2. 6% 115. 5% Unwrought aluminium (H 7601) Total/average: export markets R 77. 4 Billion [Source: Mthente, 2013 using Quantec data] 10. 7%
SA Agricultural Exports into Africa R 12 000 000 R 10 000 000 Prepared foodstuffs; beverages, spirits & vinegar; tobacco & manufactured tobacco substitutes R 8 000 000 Vegetable products R 6 000 000 R 4 000 000 Live animals, animal products R 2 000 000 Animal or vegetable fats & oils & their cleavage products; prepared edible fats; animal & vegetable waxes R 0 2009 Quantec 2013 2010 2011 2012 2013
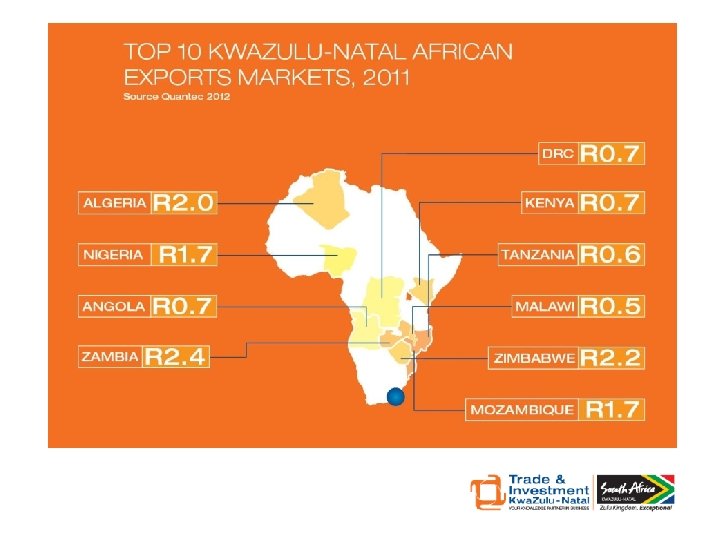
KZN Agricultural Exports into Africa R 1 200 000 R 1 000 000 R 800 000 Live animals, animal products Vegetable products R 600 000 Animal or vegetable fats & oils & their cleavage products; prepared edible fats; animal & vegetable waxes R 400 000 R 200 000 R 0 2008 Quantec 2013 2009 2010 2011 2012
KZN Agricultural Exports Worldwide R 3 500 000 R 3 000 000 R 2 500 000 Live animals, animal products R 2 000 000 Vegetable products R 1 500 000 Animal or vegetable fats & oils & their cleavage products; prepared edible fats; animal & vegetable waxes Prepared foodstuffs; beverages, spirits & vinegar; tobacco & manufactured tobacco substitutes R 1 000 000 R 500 000 R 0 2008 Quantec 2013 2009 2010 2011 2012
African Trade Blocs
Size of Africa
EXPORT ACTIVITIES
EXPORT DEVELOPMENT 1. TIKZN Enterprise Development Program • 4 x groups of 6 companies to be developed • Training to be supplemented with onsite mentorship 2. PUM Mentorship Program • Experts from Netherlands will be deployed for 3 week at a time to consult to KZN Companies. • 2 x groups of 8 companies will be afforded participation into this program 3. CBI Mentorship Program • Netherlands based export capacity building program, tailored for the SA environment. 4. Export Training in Collaboration with Department of Agriculture • 2 x groups of 20 companies to be trained
EXPORT DEVELOPMENT 5. Export Training in Collaboration with SIPPO (Swiss Import Promotion Organisation) • 50 companies to be trained 6. Export Training in Collaboration with JETRO • 50 companies to be trained 7. Master Class • 2 x groups of 8 companies to be trained • Training and high level management coaching
EXPORT PROMOTION ACTIVITIES • High GDP Growth Economies • BRICS – Brazil, Russia, China and India • SADC and Africa – Zambia, Mozambique, Zimbabwe, DRC, Botswana, Angola, Kenya, Algeria …. • Middle East and Asia – Saudi Arabia, Kuwait, United Arab Emirates, Indonesia, Malaysia. . • Traditional Markets – USA, UK, Japan ….
Trade Promotion Platforms 2014 - 2015 Type Local Exhibitions International Trade Initiatives National Pavillions Outward Selling Missions Inward Buying Missions Trade Missions (SSAS) Export Scoping Missions Name of Event Source Africa, Cape Town SAITEX SA Automotive Week Decorex - JHB ITI Brazil ITI China ITI India FILDA (Feira Internacional da Luanda), Angola Interpolitex Russia Zambian International Trade Fair (Ndola, Zambia) Foodex Japan 2015 (Tokyo, Japan) Indonesia (Consideration of proposal from SA Embassy) DRC (Follow up visit with office of the Premier) Swaziland International Trade Fair 2014 (E 3 R) Food. Agro West & Central Africa Mining Expo (Wa. CA), Ghana Kuwait/UK Ghana Follow-up DRC/USA Promote 2014 Euro Satorie France Botswana Global Expo NY Now India Engineering Sourcing Show Import Shop Berlin World Future Energy Summit (WFES) 2015 (Abu Dhabi, UAE) Tanzania /Kenya International Trade Fair Destination Cape Town Johannesburg Brazil China India Angola Russia Zambia Japan Indonessia DRC Swaziland Kenya Ghana Durban Cameroon France Botswana USA India Germany United Arab Emirates Tanzania Date 06 -08 May 2014 22 -24 June 2014 13 -17 Oct 2014 6 -10 August 2014 01 October 2014 08 -11 September 2014 14 -27 September 2014 15 -20 July 2014 28 -31 October 2014 25 June – 01 July 2014 3 - 6 March 2015 01 September 2014 01 August 2014 01 September 2014 03 -05 October 2014 17 -19 September 2014 09 February 2015 01 April 2014 14 November 2014 14 December 2014 16 -20 June 2014 01 November 2014 16 -20 August 2014 12 -16 November 2014 16 - 19 Jan 2015 01 -05 January 2015
Gulfood 2014
Strategic Projects 1. Export Directory 2. Export Information Portal 3. Accredited Enterprise Development Program 4. Smart Apps Development
TIKZN TOOLS
Contact Details Physical address: 32 Kingsmead Boulevard Kingsmead Office Park, Durban, 4001 Physical address: 99 George Storrar Avenue Groenkloof, Pretoria, 0181 Postal address: PO Box 4245, Durban 4000 Postal address: 99 George Storrar Avenue Groenkloof, Pretoria, 0181 Telephone: + 27 (0) 31 368 9600 Telephone: Fax: + 27 (0) 31 368 5888 + 27 (0) 12 346 4386 Email: info@tikzn. co. za Website: www. tikzn. co. za Fax: + 27 (0) 86 501 0848 Email: info@tikzn. co. za Website: www. tikzn. co. za