Origin and destination studies The object of this

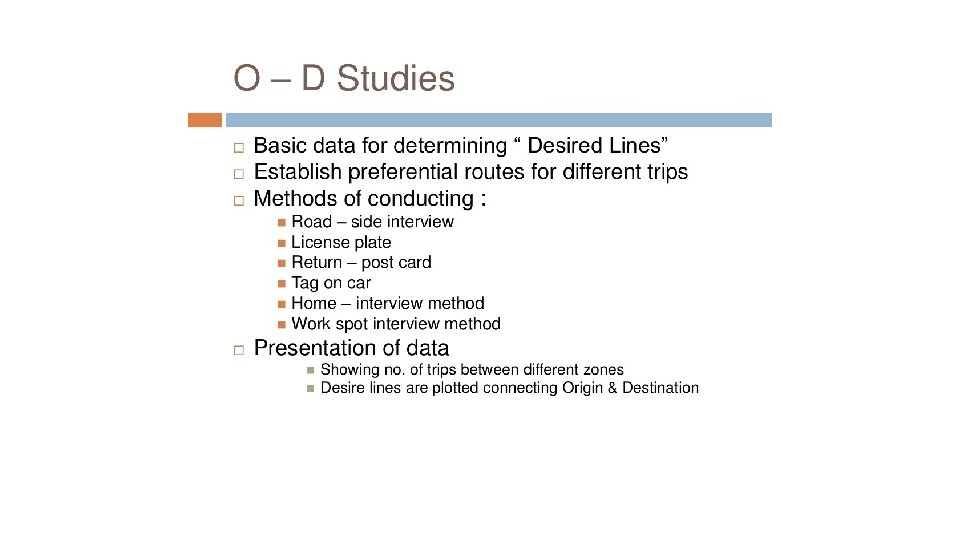
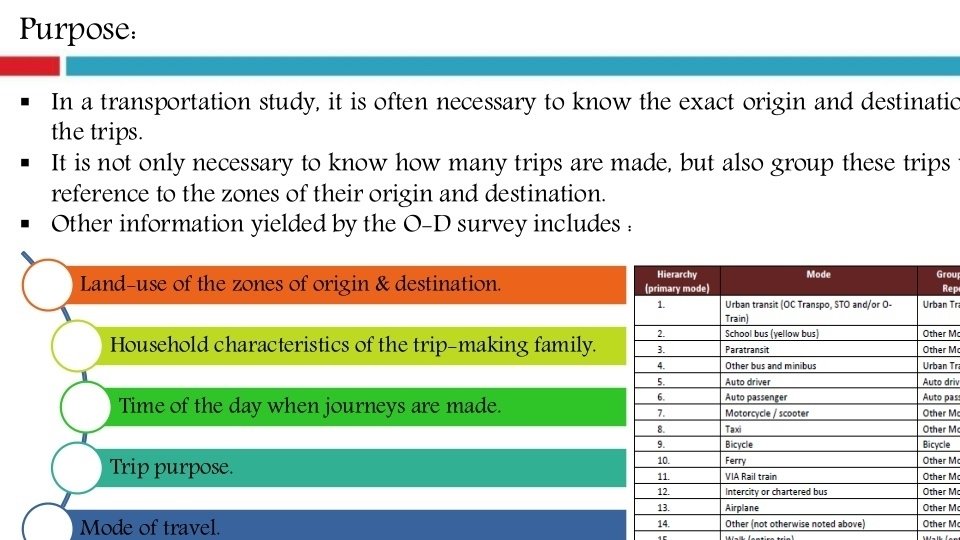
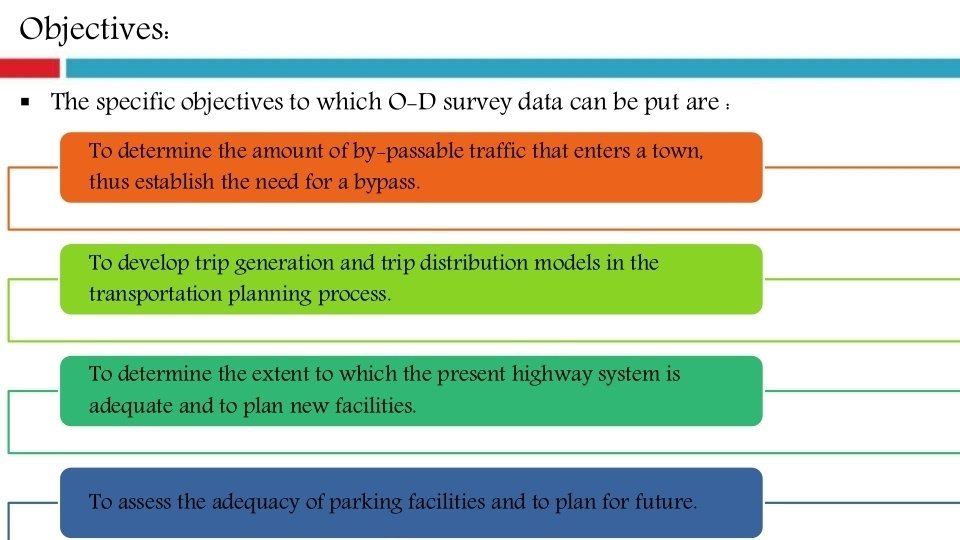
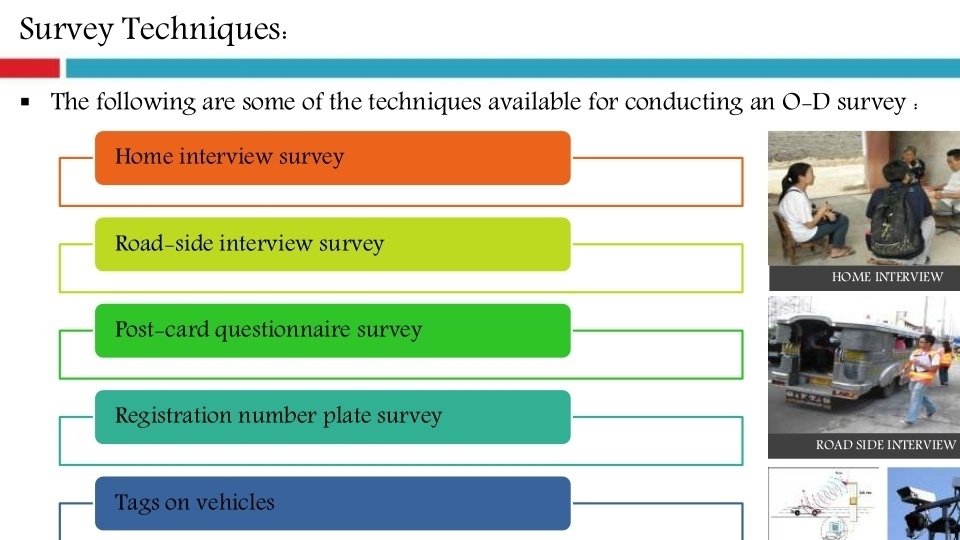
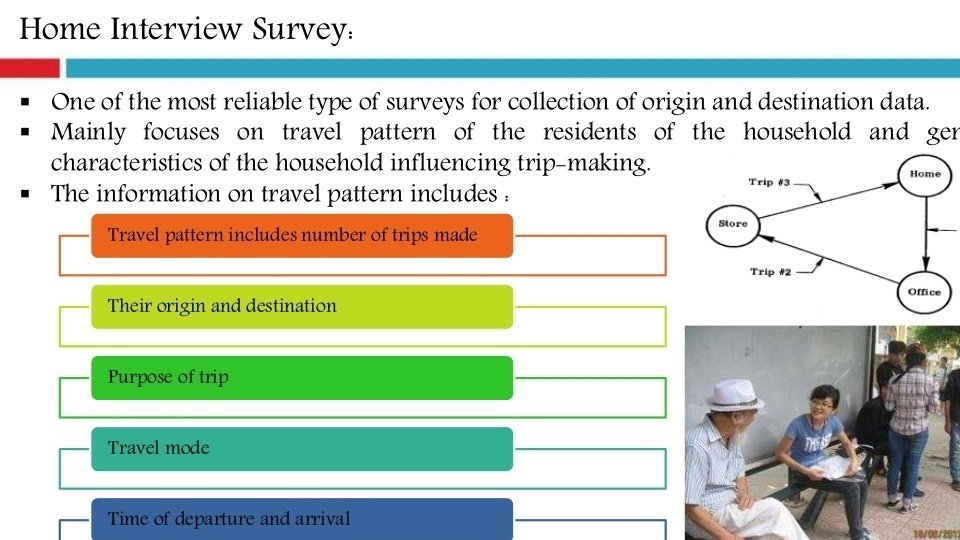
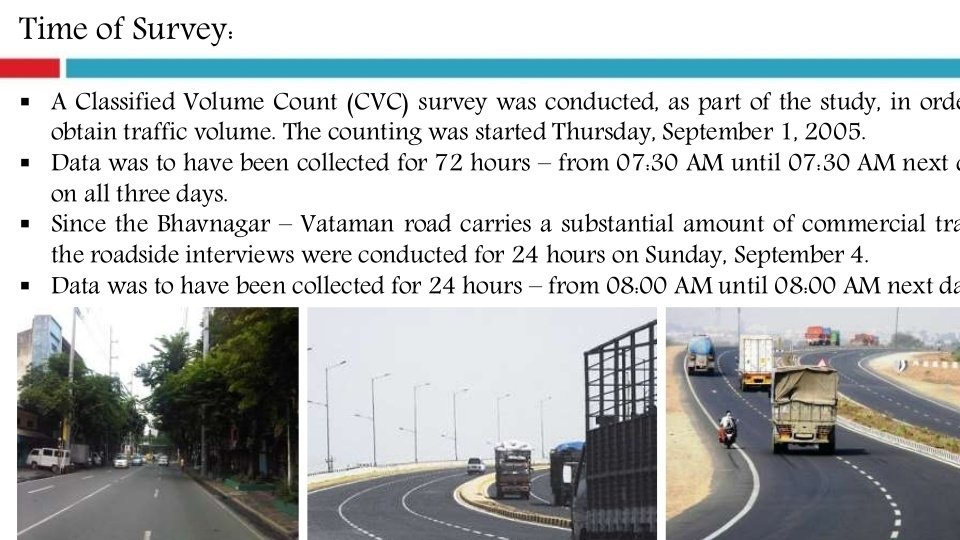
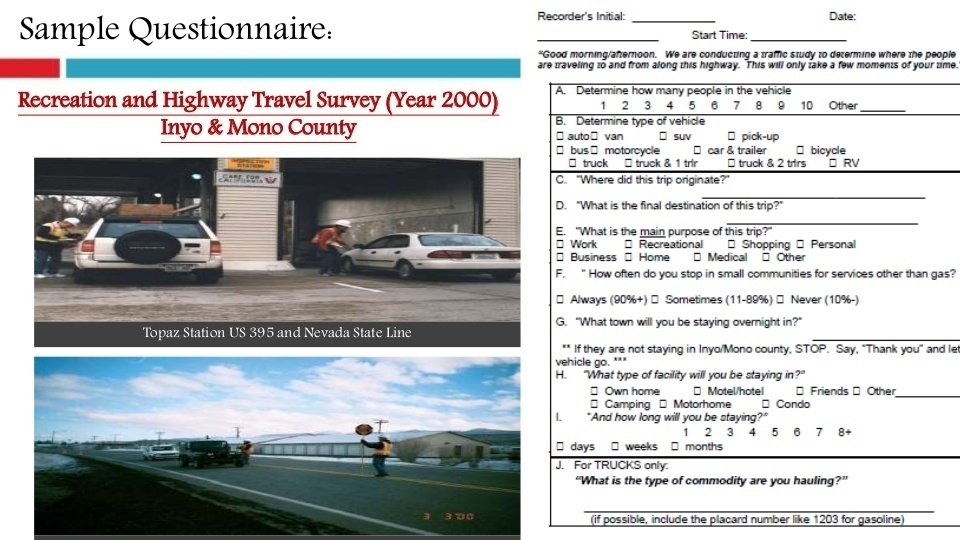
Origin and destination studies • The object of this study is Plan the road network and other facilities for vehicular traffic Plan the schedule of different modes of transportation for the trip demand of commuters. • It gives the information like the actual direction of travel, selection of routes and length of trip. • Used in planning new highway facilities and in improving some of the existing system. • To plan the transportation system and mass transit facilities in cities including route and schedules of operation • To locate expressway or major routes along the desire lines. • To locate terminals and to plan terminal facilities. • To locate new bridge as per traffic demands. • To locate intermediate stops of public transport. • Methods of ‘O’ and ‘D’ survey: • Road- side interview method • License plate method • Return post card method • Tag-on-car method • Home interview method


Traffic flow characteristics and studies • The basic traffic maneuvers are diverging, merging, crossing and weaving. • Traffic Flow(q): - the rate at which vehicles pass at a fix point (vehicles per hour)= N(3600/t). • Traffic Density(k): - no. of vehicles(N) over a stretch of roadway(L) i. e. vehicles per kilometer = N/L • Time headway: - Time interval between the passage of the fronts of the successive vehicles at a specified point. • Average time headway= average travel time per unit distance x average space headway Space headway: - distance between front of successive vehicles. • • • Average space headway= space mean speed x average time headway Flow Density Relationship Flow= density x space mean speed q= K x V Density = 1/ space headway 1/hs Space mean speed = flow x Space headway q x hs Density = flow x time per unit distance K = q x t

• Maximum flow occurs when the speed is Vsf/2 and the density is Kj/2 q m ax J V sf K 4 • • • Where, Kj =jam density=1000/spacing of vehicle Vsf =free mean speed K=q/v q=averagevolume of vehicle, (veh. /hr) V=spacemeanspeed of vehicle, kmph

Traffic capacity studies Traffic capacity: • The ability of a roadway to accommodate traffic volume. It is expressed as the maximum number of vehicle in a lane or a road that can pass a given point in unit time, usually an hour. • Volume represent an actual rate of flow where as capacity indicates a maximum rate of flow with a certain level of service. Basic capacity: • It is the maximum no. of passenger car that can be pass a given point on a roadway during one hour under the most nearly ideal roadway and traffic conditions. It is otherwise known as theoretical capacity. Possible Capacity • It is the maximum no. vehicle that can pass a given point on a roadway during one hour under prevailing roadway and traffic conditions. Practical capacity: • It is the maximum no. of vehicle that can pass a given point on a roadway during one hour, without traffic density being so great as to cause unreasonable delay, hazard or restriction to the driver freedom to maneuver under the prevailing roadway and traffic conditions. • C= 1000 V/S • S= average spacing of vehicle in m, C is the capacity in vehicle per hour per lane.

Peak-Hour Factor • It is basically represent the variation in traffic flow with in an hour. • Observations of traffic flow consistently indicate that the flow rates are found in the peak. • A 15 minute period within an hour is not sustained through out the entire period and that is why we need to use the peak-hour factor. • Normally on freeways the peak-hour factor values range from 0. 80 to 0. 95.
 • The different vehicle classes have a wide range of")
Passenger Car Unit (PCU) • The different vehicle classes have a wide range of statics characteristics and dynamic characteristics, apart from these the driver behavior of the different vehicle classes is also found to vary considerable. Therefore mixed traffic flow characteristics are very much complex when compare to homogeneous traffic and it is difficult to estimate the traffic volume , capacity of roadway under the mixed traffic flow, unless the different vehicle classes are converted to one common standard vehicle unit. Therefor it is a common practice to consider the passenger car as the standard vehicle unit to convert the other vehicles classes and this unit is called Passenger Car Unit. PCU value depends upon the several factors, such as: • Vehicle characteristics • Transverse and longitudinal gaps or clearance between moving vehicles. • Speed distribution of the mixed traffic stream, volume to capacity ratio. • Roadway characteristics. • Regulation and control of traffic. • Environmental and climatic conditions.
 S. L. No. Vehicle class Equivalency factor 1 Motor cycle,")
Passenger car equivalency factor(PCU) S. L. No. Vehicle class Equivalency factor 1 Motor cycle, Scooter and Pedal cycle 0. 5 2 Passenger car, Tempo, auto rickshaw, Agricultural tractor, Pick- up van 1. 0 3 Cycle -rickshaw 1. 5 4 Truck, Bus, Agricultural tractor-trailer 3. 0 5 Horse-drawn vehicle 4. 0 6 Small bullock-cart and Hand-cart 6. 0 7 Large bullock-cart 8. 0
 It is define as a qualitative measure describing the operational condition")
Level of service(LOS) It is define as a qualitative measure describing the operational condition within a traffic stream, and their perception by motorist and passengers. Or Rating of acceptable level of congestion LOS definitions A: Free flow, low traffic, high speed B: Stable flow, noticeable traffic C: Stable flow, traffic interactions, D: Unstable flow, High density, movement restrictions E: Unstable flow, lower speed, volume is nearly equal to capacity, little freedom F: Unstable flow, no freedom, traffic volume can drop to zero, stop & go

LOS- A Free-flow operation no restriction in maneuvering. LOS- B Reasonably free flow Ability to maneuver is only slightly restricted Effects of minor incidents still easily absorbed LOS- C Speeds at or near FFS Freedom to maneuver is noticeably restricted Queues may form behind any significant blockage. LOS- D Speeds decline slightly with increasing flows Density increases more quickly Freedom to maneuver is more noticeably limited Minor incidents create queuing LOS- E Operation near or at capacity No usable gaps in the traffic stream Operations extremely volatile Any disruption causes queuing LOS- F Breakdown in flow Queues form behind breakdown points Demand > capacity

In India, As per IRC LOS- B: for design of Rural Roads LOS- C: for the design of Urban Roads

Traffic operations • Number of conflicts at intersection Crossing conflicts Merging conflicts Diverging conflicts Number of lanes Number of potential conflicts Road- A Road- B Both road twoway A- Oneway B- twoway Both roads Oneway 2 2 24 11 6 2 3 24 11 8 2 4 32 17 10 3 3 24 13 11 4 4 44 25 18
- Slides: 35