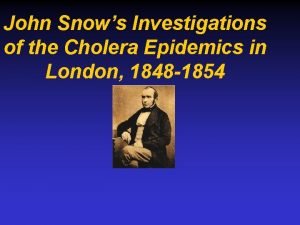
John Snows Investigations of the Cholera Epidemics in




- Slides: 42
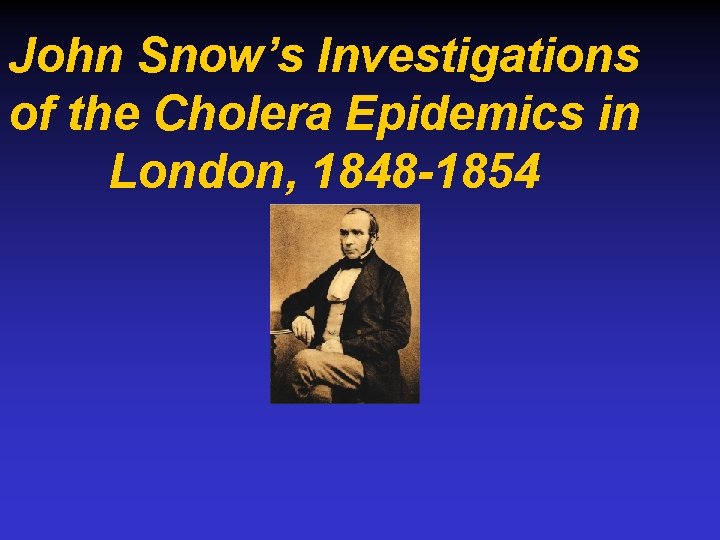
John Snow’s Investigations of the Cholera Epidemics in London, 1848 -1854
Source of Information for the John Snow Example UCLA School of Public Health, Department of Epidemiology Website: http: //www. ph. ucla. edu/epi/snow. html
British cholera epidemics • 1831 -1832: - first modern outbreak in Britain - 23, 000 deaths - helped to launch the sanitary reform movement • 1848 -1849: - 250, 000 cases and 53, 000 deaths - prompted Snow (and others) to investigate causes
The London Cholera Epidemic of September 1848 – August 1849 • Based on his clinical experience and review of epidemiologic characteristics of cholera, Snow formulated a theory of causation and transmission of the disease.
The London Cholera Epidemic of September 1848 – August 1849 • Snow’s hypotheses concerning cholera: - a gastrointestinal disease, therefore causal agent was likely ingested - diarrhea as most prominent symptom, therefore causal agent likely left the body by this route - if cholera excretions contaminated rivers from which drinking water was taken, then the disease could be widely disseminated
The London Cholera Epidemic of September 1848 – August 1849 Causal Hypothesis: Sewage-contaminated drinking water was a causal agent for the cholera epidemic.
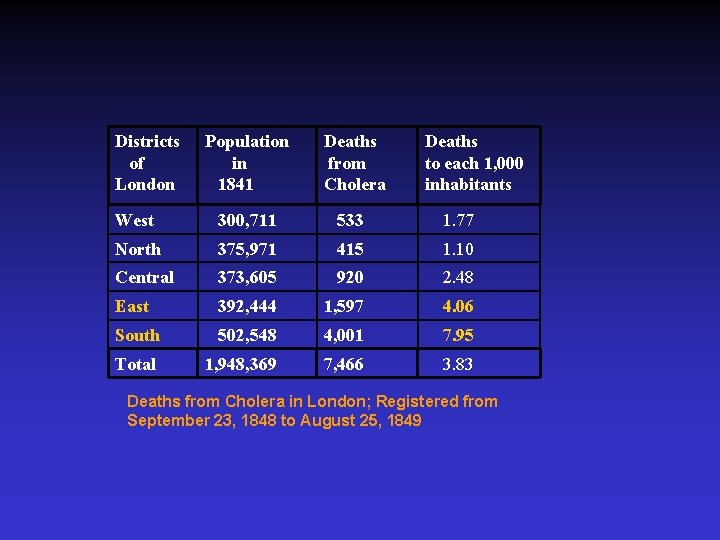
The London Cholera Epidemic of 1848 -1849 • Snow tested this hypothesis by first conducting an “ecologic” study of London districts using: - routine surveillance data on cholera cases - population data at the district level - available information on water companies serving the districts - available data on property values by district
The London Cholera Epidemic of 1848 -1849 • Characteristics of an ecologic study: - unit of analysis is not the individual or case - unit of analysis is a geographical unit such as a district or neighborhood or city or county - useful to initially study a cause-effect relationship when data are easily available and/or an individual level study is not feasible - does not directly link an individual case to an exposure (unless everyone in the geographical unit has a similar exposure)
The London Cholera Epidemic of 1848 -1849 • Snow did not have exact information on the sources of water for the districts. • However, Snow knew that: - the East and South districts were served by water supplies obtained from known polluted parts of the Thames River - the rest of London received drinking water relatively uncontaminated by sewage.
Districts of London Population in 1841 Deaths from Cholera Deaths to each 1, 000 inhabitants West 300, 711 533 1. 77 North 375, 971 415 1. 10 Central 373, 605 920 2. 48 East 392, 444 1, 597 4. 06 South 502, 548 4, 001 7. 95 Total 1, 948, 369 7, 466 3. 83 Deaths from Cholera in London; Registered from September 23, 1848 to August 25, 1849
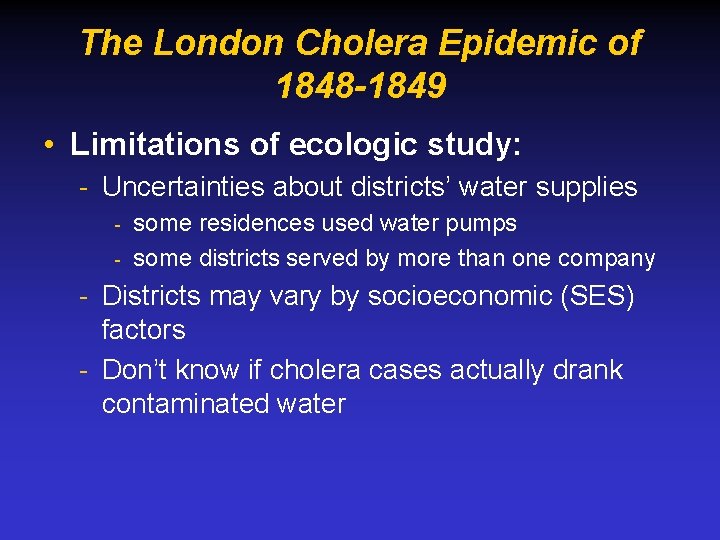
The London Cholera Epidemic of 1848 -1849 • Limitations of ecologic study: - Uncertainties about districts’ water supplies - some residences used water pumps some districts served by more than one company - Districts may vary by socioeconomic (SES) factors - Don’t know if cholera cases actually drank contaminated water
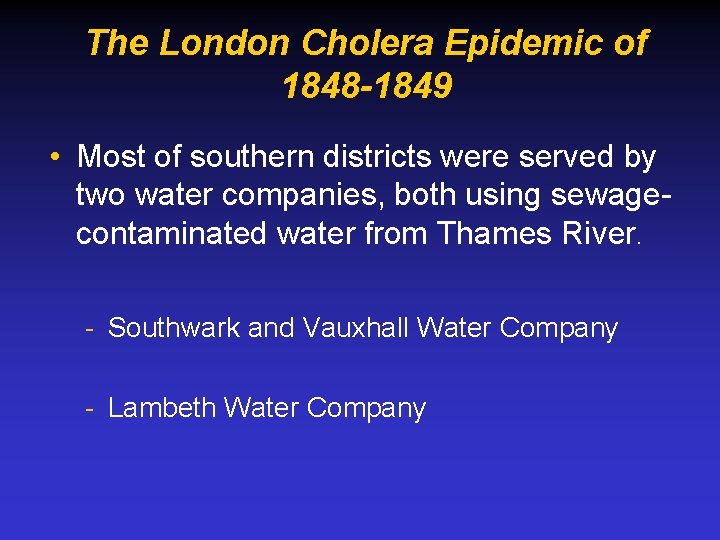
The London Cholera Epidemic of 1848 -1849 • Most of southern districts were served by two water companies, both using sewagecontaminated water from Thames River. - Southwark and Vauxhall Water Company - Lambeth Water Company
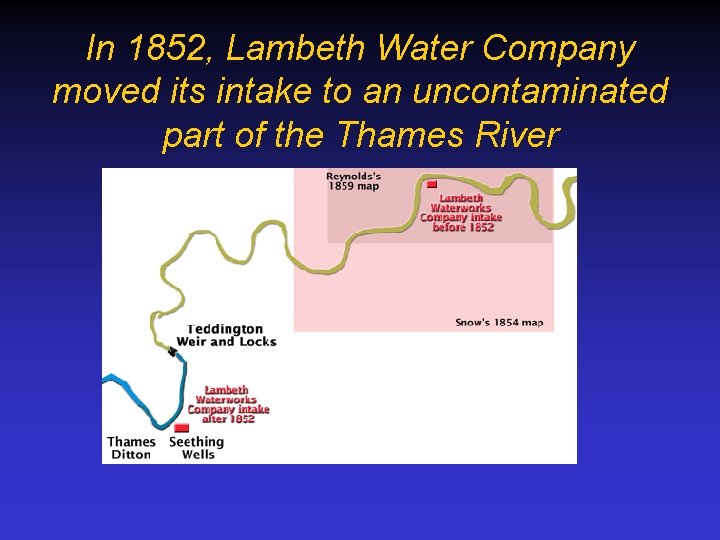
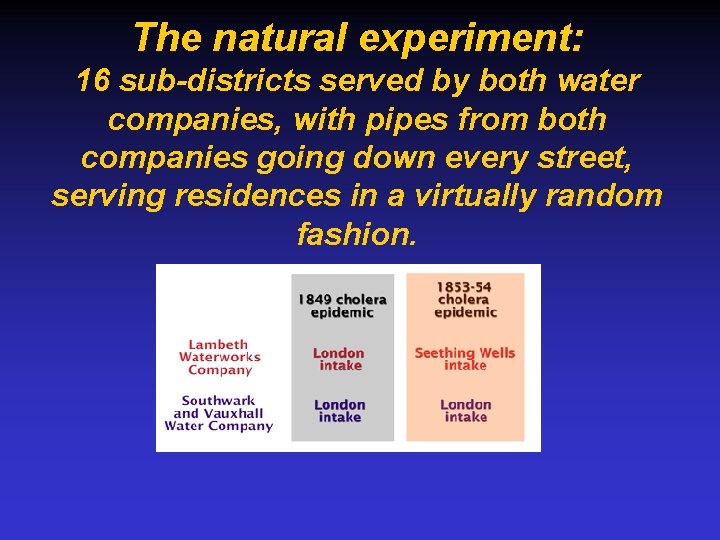
In 1852, Lambeth Water Company moved its intake to an uncontaminated part of the Thames River
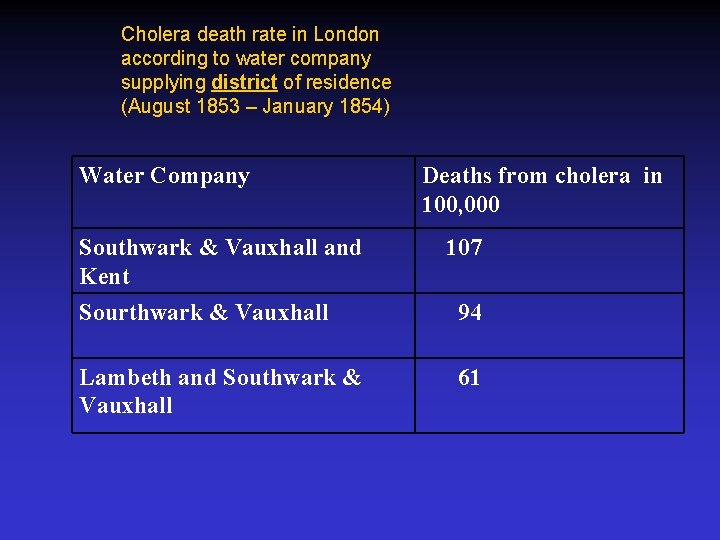
Cholera death rate in London according to water company supplying district of residence (August 1853 – January 1854) Water Company Southwark & Vauxhall and Kent Deaths from cholera in 100, 000 107 Sourthwark & Vauxhall 94 Lambeth and Southwark & Vauxhall 61
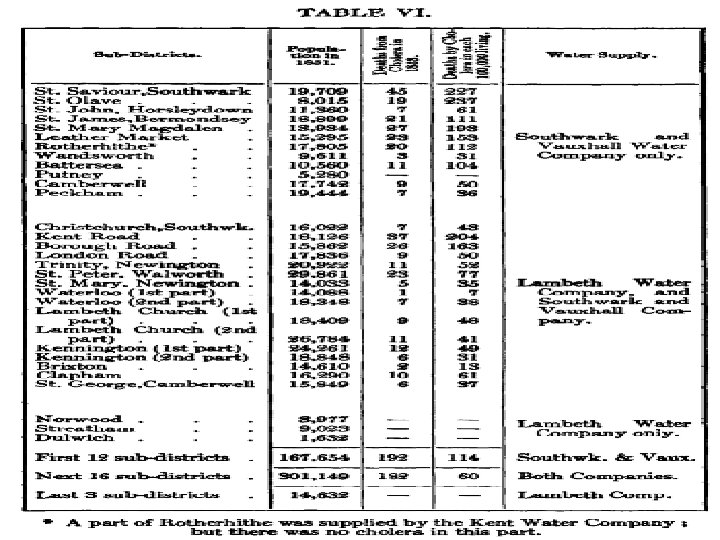
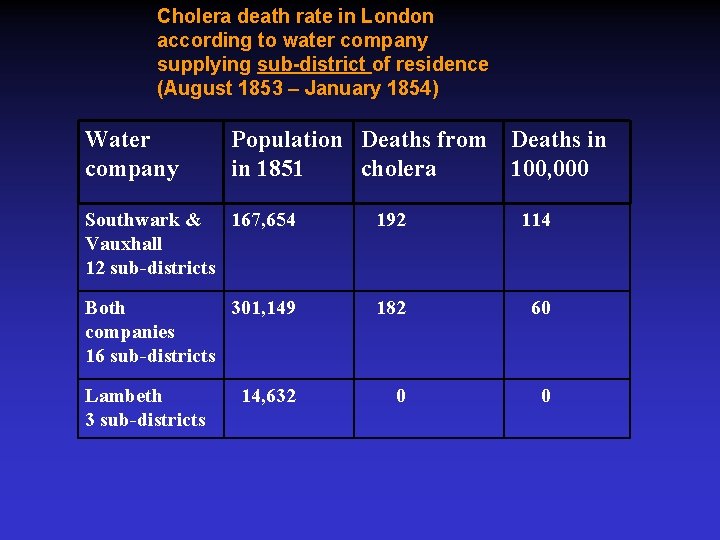
Cholera death rate in London according to water company supplying sub-district of residence (August 1853 – January 1854) Water company Population Deaths from Deaths in in 1851 cholera 100, 000 Southwark & 167, 654 Vauxhall 12 sub-districts 192 114 Both 301, 149 companies 16 sub-districts 182 60 0 0 Lambeth 3 sub-districts 14, 632
• Ecologic study of districts and subdistricts could not rule out: - confounding by socio-economic (SES) factors. - Exposure misclassification (e. g. , public wells) • Ecologic study could not link cases with exposure. (Cases may not have drunk contaminated water. )
The natural experiment: 16 sub-districts served by both water companies, with pipes from both companies going down every street, serving residences in a virtually random fashion.
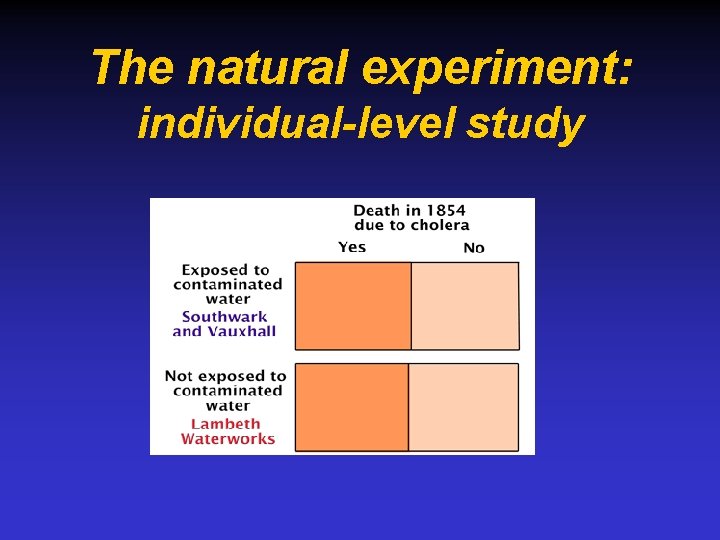
The natural experiment: individual-level study
The natural experiment: “shoe-leather epidemiology” • Home of each case was visited to determine source of water to the residence: - next-of-kin recall found to be inadequate - confirmation by water bill receipt or by water sample. • Reports from water companies provided denominator information (# houses supplied in each district)
The natural experiment • The preceding table included: - districts served by both companies in an intermingled fashion (i. e. , the natural experiment) and - districts served by only one of the companies. - the relative risk = 315/ 37 = 8. 5
The natural experiment • Because Snow combined both districts with and without intermingled supplies, confounding bias by SES factors was still possible: - the districts served only by Lambeth Co. were wealthier than those served only by Southwark & Vauxhall. • When Snow later focused only on the districts with intermingled supplies, the relative risk fell from 8. 5 to 6. 9.
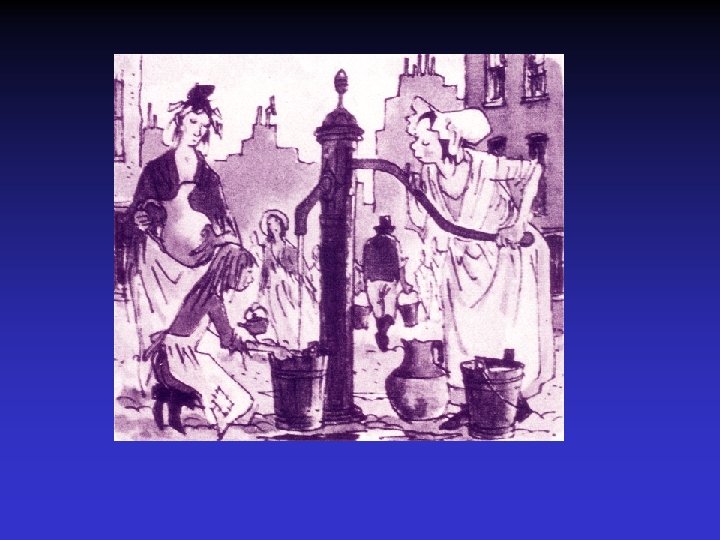
The Broad Street Pump Outbreak
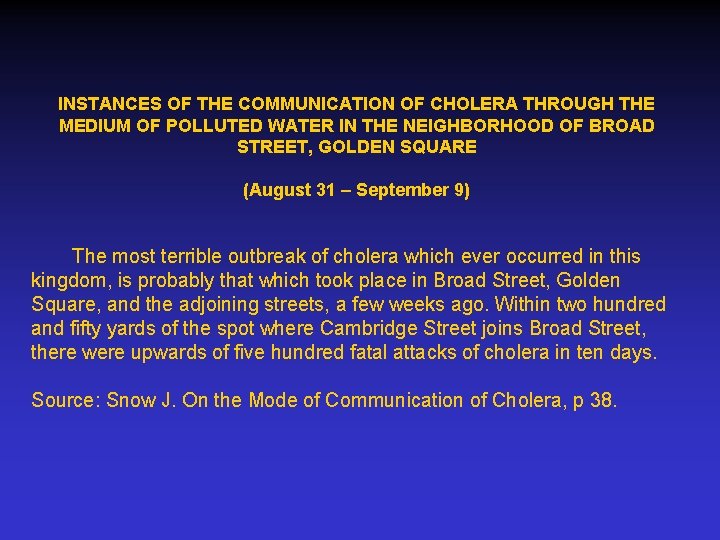
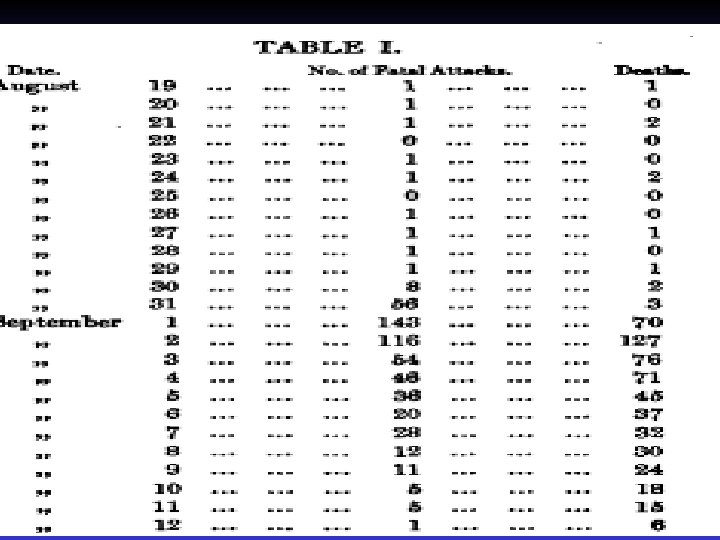
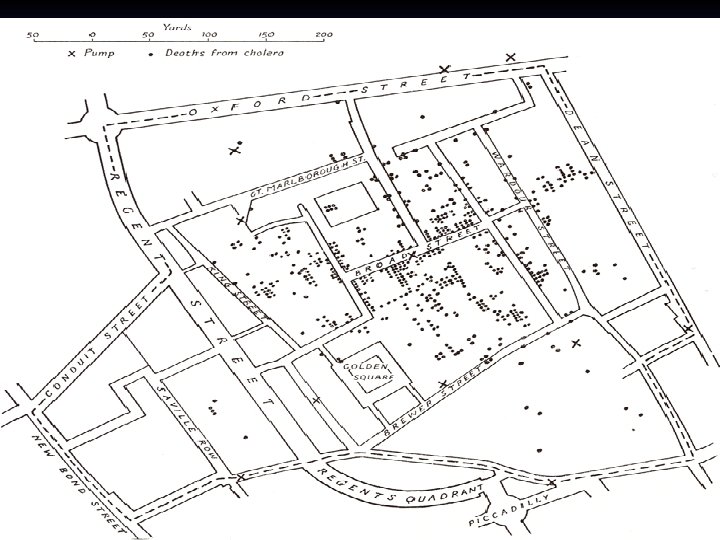
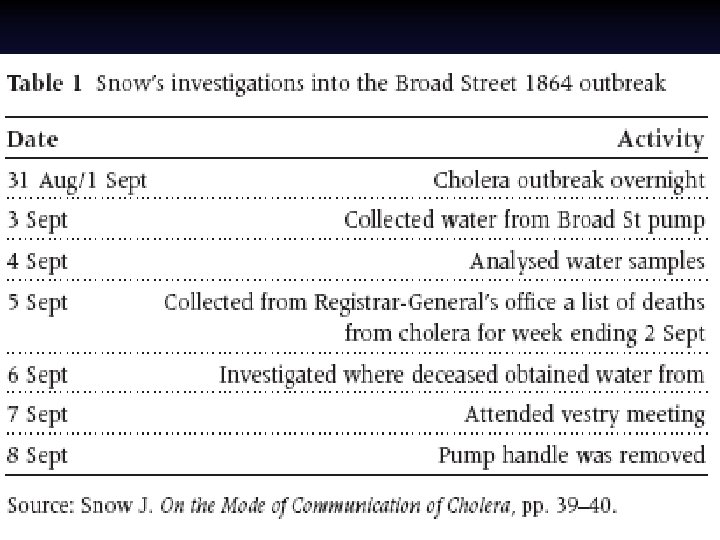
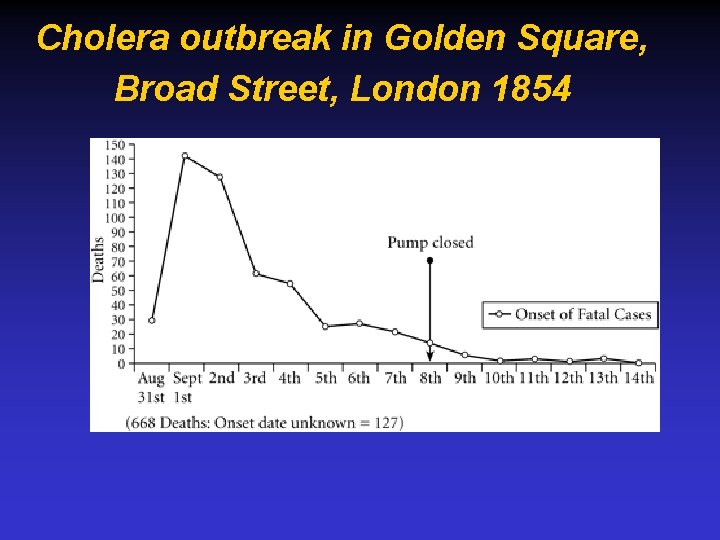
INSTANCES OF THE COMMUNICATION OF CHOLERA THROUGH THE MEDIUM OF POLLUTED WATER IN THE NEIGHBORHOOD OF BROAD STREET, GOLDEN SQUARE (August 31 – September 9) The most terrible outbreak of cholera which ever occurred in this kingdom, is probably that which took place in Broad Street, Golden Square, and the adjoining streets, a few weeks ago. Within two hundred and fifty yards of the spot where Cambridge Street joins Broad Street, there were upwards of five hundred fatal attacks of cholera in ten days. Source: Snow J. On the Mode of Communication of Cholera, p 38.
The Broad Street Pump Outbreak • Snow began the investigation with: - a hypothesis from his previous work - sewage-contaminated drinking water is a cause of cholera - a working knowledge of the cluster area (he resided nearby).
The Broad Street Pump Outbreak • Piped water not contaminated by sewage. • Water samples on 9/3 from pumps near Golden Sq. found that all except the Broad St. pump had visible impurities. • However, local residents reported foul smells from the Broad St. pump water the day before the pump samples were taken. • Days later, small flocculent particles were detected in Broad St. sample.
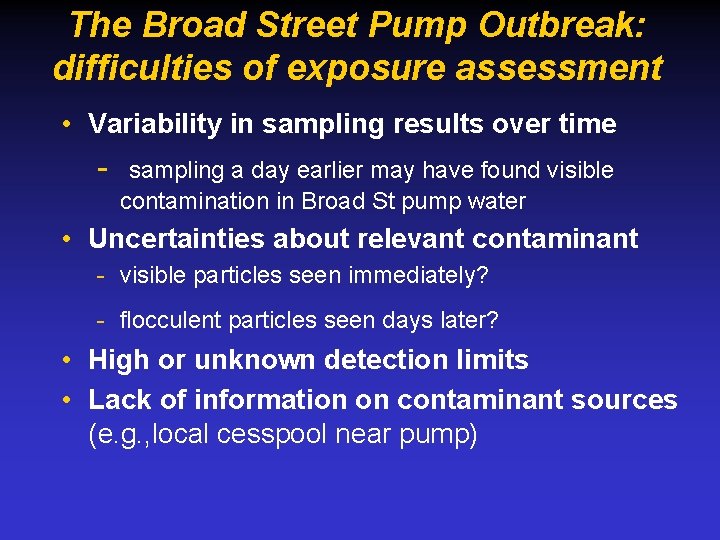
The Broad Street Pump Outbreak: difficulties of exposure assessment • Variability in sampling results over time - sampling a day earlier may have found visible contamination in Broad St pump water • Uncertainties about relevant contaminant - visible particles seen immediately? - flocculent particles seen days later? • High or unknown detection limits • Lack of information on contaminant sources (e. g. , local cesspool near pump)
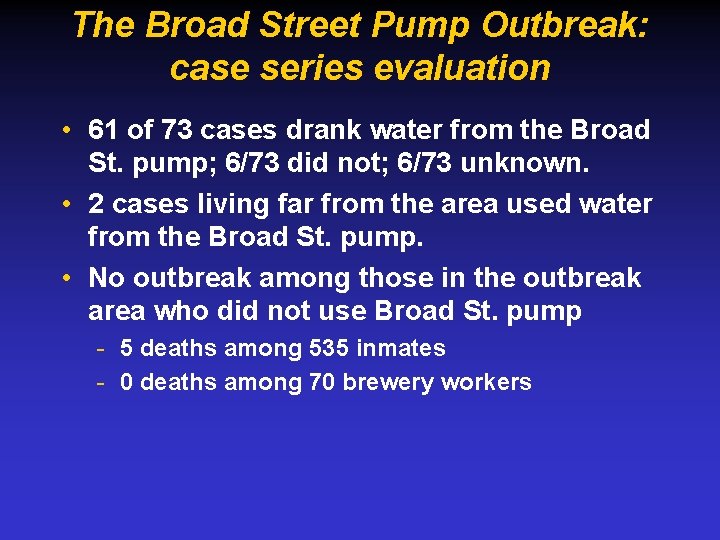
The Broad Street Pump Outbreak: case series evaluation • 61 of 73 cases drank water from the Broad St. pump; 6/73 did not; 6/73 unknown. • 2 cases living far from the area used water from the Broad St. pump. • No outbreak among those in the outbreak area who did not use Broad St. pump - 5 deaths among 535 inmates - 0 deaths among 70 brewery workers
Cholera outbreak in Golden Square, Broad Street, London 1854
Lessons from Snow’s Investigations • Based on review of what was known about cholera, Snow formed a hypothesis: - sewage in drinking water causes cholera • Snow tested hypothesis using available data to conduct an ecologic study comparing cholera rates in districts and subdistricts
Lessons from Snow’s Investigations • Snow recognized the limitations of the ecologic study: - could not directly link individual cases to exposure to contaminated drinking water - alternative explanation for findings: confounding by SES factors
Lessons from Snow’s Investigations • Snow identified a study area and study population that: - provided an excellent exposure contrast (high vs no exposure) - minimized confounding by SES factors - districts with intermingled supplies of high and low contamination serving homes in a virtual random fashion - a natural experiment
Lessons from Snow’s Investigations • shoe-leather epidemiology approach to case verification & exposure assessment: - visiting the homes of the cholera cases - obtaining verification of source of water for each case residence (receipt, water sample)
Lessons from Snow’s Investigations • collected denominator data from water companies in order to calculate disease rates among exposed and unexposed.
Lessons from Snow’s Investigations • Explored alternative explanations: - focused on districts with intermingled supplies to minimize confounding by SES factors - in the cluster investigation, Snow identified: - - brewery workers and inmates unexposed to the contaminated water but worked in cluster area in order to rule out air pathway of exposure high SES cholera cases living far from the cluster area whose only link to the cluster was drinking from Broad St pump
Lessons from Snow’s Investigations • Snow found an association between exposure and disease and used this information for prevention • Snow utilized tables and maps to present a strong case for a causal relationship between sewage-contaminated drinking water and cholera