Conducting statistical investigations to develop learner statistical thinking




- Slides: 33
Conducting statistical investigations to develop learner statistical thinking
Rethinking Junior Statistics What do we wish students understood better in the senior school? We don’t have time in the senior school to teach big foundational ideas. Not so assessment driven Opportunity to teach BIG IDEAS A lot more freedom and flexibility
Key statistical concepts: types of variables (science department) shape and distribution strong interpretation skills of dot plots and box-and-whisker plots samples and populations, sampling variability and making an inference develop insight into the process of conducting a statistical investigation
Senior learners need to be able to: conduct their own investigation/ experiment make insightful comments about the results of others' investigations. It is difficult for learners to make insightful comments without first appreciating the complexities of conducting an investigation.
I am keen for the junior learners to work in groups to conduct their own investigations to help them realise that there are different ways of collecting and recording data and that decisions made in the planning stage will impact on the results found.
Assessment task want them to learn big ideas learners focus on what’s assessed and how it’s assessed assessment-for-learning learners show us the best work they can produce
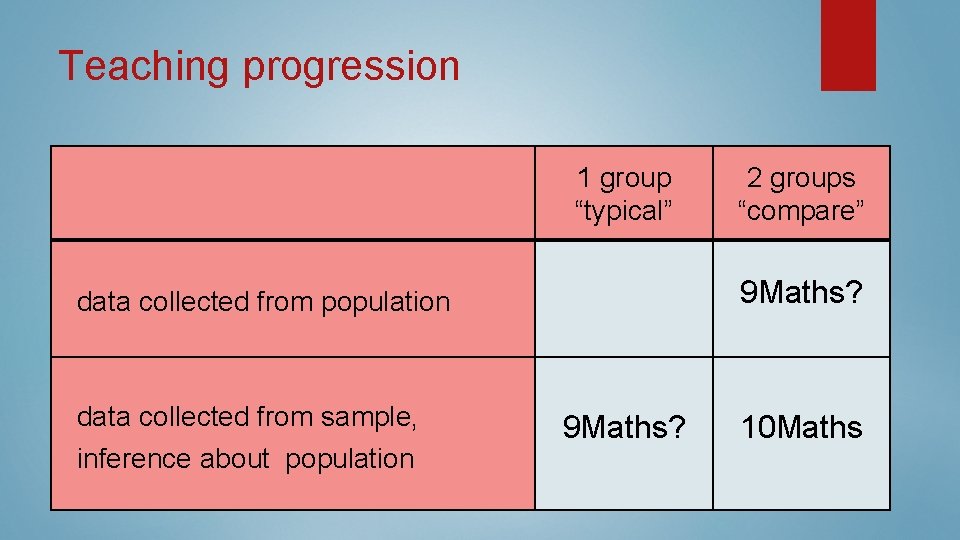
Teaching progression 1 group “typical” data collected from population data collected from sample, inference about population 2 groups “compare” 9 Maths? 10 Maths
Year 9 to focus on 1 group of learners what they can see about that 1 group of learners what is “typical” make an inference about the rest of Year 9 s in context eg. My class is really sporty so our results will be better than the general Year 9 results
Year 10 to compare 2 different groups of learners samples need to come from 2 different populations Year 8 learners vs Year 10 learners make an inference about the populations in context.
Teaching sequence PPDAC – where everything fits in. I like to see big picture first Start with categorical. Bar graphs or pictograms Shape/ distribution is a key focus of this topic Need to teach shape before calculations Pip Arnold’s stuff on Census at Schools
Graphs - in Context want learners to realise that each dot on the dot plot represents something within that context eg. someone’s shoe length, the number of countries one learner has visited
Number of Letters in Your First Name Teaching Activity each student works out number of letters in their first name define variable – possible issues write data value on paper physically form a line ordering data values find 5 point summary
First Name Teaching Activity draw dot plot and box-and-whisker each dot is the number of letters in a particular learner’s first name median is the number of letters in Jaeden’s name every dot has a story!
Teaching and Learning time 9 Maths: 4 weeks 10 Maths: 4 weeks → 5 weeks this year more time for sampling variability
Teaching sequence 2 & 3 weeks teaching: PPDAC Shape Writing questions Analysis Sampling variability
Investigations Start investigations Split lessons First half: working in groups to decide what to investigate, variables, write their questions Second half: continue teaching analysis
Investigation conditions Problem and Plan written collaboratively in groups Data collected collaboratively in groups Analysis and Conclusion written individually under test conditions, open book Learners show us their best work!
Choose a Question Spend a few minutes trying to come up with some examples of questions students might choose Identify any issues they would face in trying to collect appropriate data Decide whether or not these issues could be addressed
Questions How old are you? What type of music do you like? How much time do you spend playing sport? How long can you hold a wall sit for? What is the length of your foot? How many windows do you have in your house? How sporty are you?
9 Maths: Data collection Collected data from their own class in groups Group Stations
10 Maths: Data Collection Needed to collect data from 2 different Year levels Organised a timetable where each Year 10 class paired up with a Year 8 class Year 10’s practised collecting data from their own class first Even if not fully ready to complete assessment task, still stick to timetable Group Stations for collecting data
Analysis Hand-drawn graphs no technology or use technology? Absent students were given data by their group members
Conclusion Answer your initial question Make inference about the populations of all Year 8 and Year 10 learners at Whangaparaoa College Consider whether your sample reflects the population/ reflect on investigation process/ is this what I expected
Comments A lot of buy-in from learners High quality work Contextual writing Insightful comments Does this make sense to me? Not enough time on sampling variability
Questions
Probability No test – not assessment focused Fun and challenging activities
Graphs Historically taught abstract concepts and then contextual problems as applications After teaching coordinates for years, taught party preparations Number of sausages for a party – intuitive – don’t need to teach Now straight into context and later draw out abstract Linear Algebra projects
9 Maths Linear Graphs Project Students: designed their own linear pattern drew shapes constructed a table constructed a graph wrote the formula
9 Maths Linear Graphs Project Excellence made a change to their pattern drew the graph of this adapted pattern on the axes commented on how the change to the pattern had affected the line graph (gradient, y-intercept) same
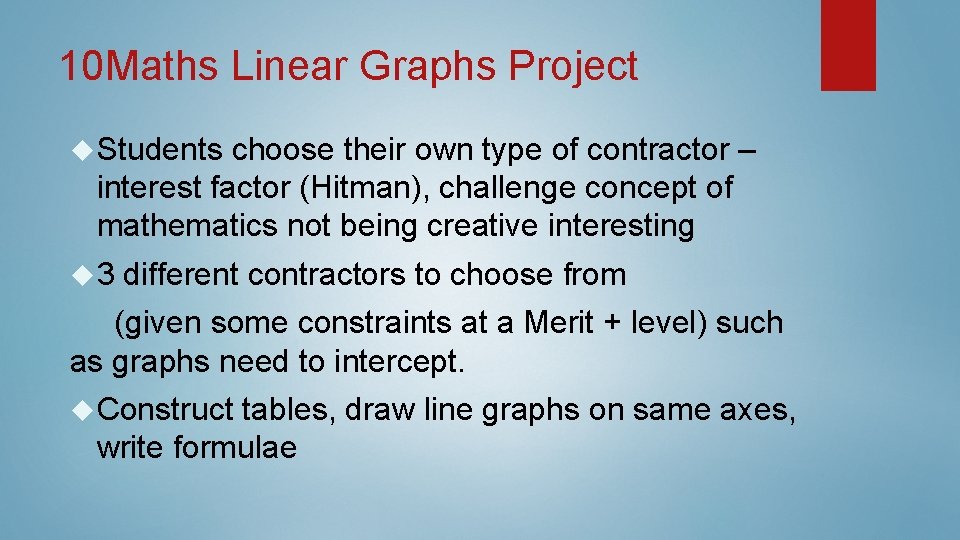
10 Maths Linear Graphs Project Students choose their own type of contractor – interest factor (Hitman), challenge concept of mathematics not being creative interesting 3 different contractors to choose from (given some constraints at a Merit + level) such as graphs need to intercept. Construct tables, draw line graphs on same axes, write formulae
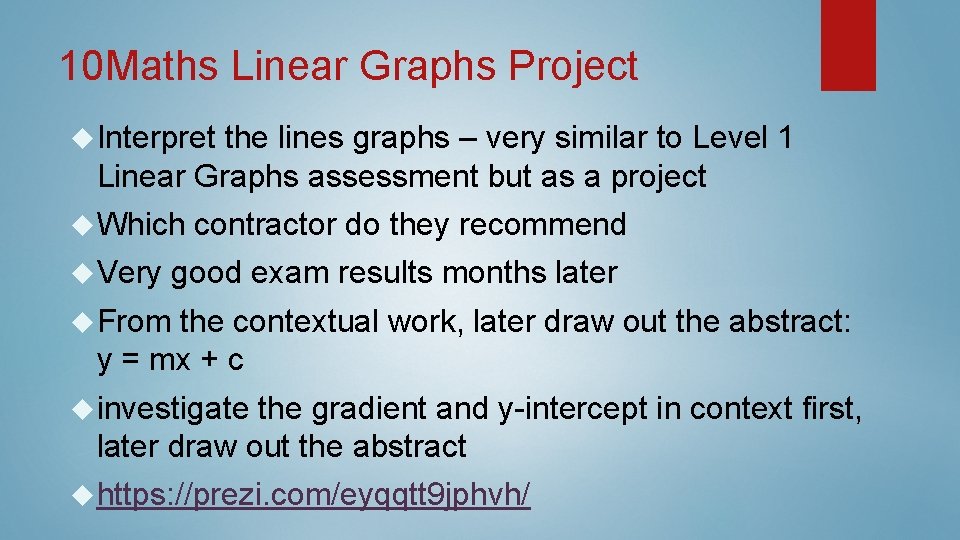
10 Maths Linear Graphs Project Interpret the lines graphs – very similar to Level 1 Linear Graphs assessment but as a project Which contractor do they recommend Very good exam results months later From the contextual work, later draw out the abstract: y = mx + c investigate the gradient and y-intercept in context first, later draw out the abstract https: //prezi. com/eyqqtt 9 jphvh/
Questions
Thank you!