INVENTORY KPI PER FACTORIES IC Tula IC Omsk


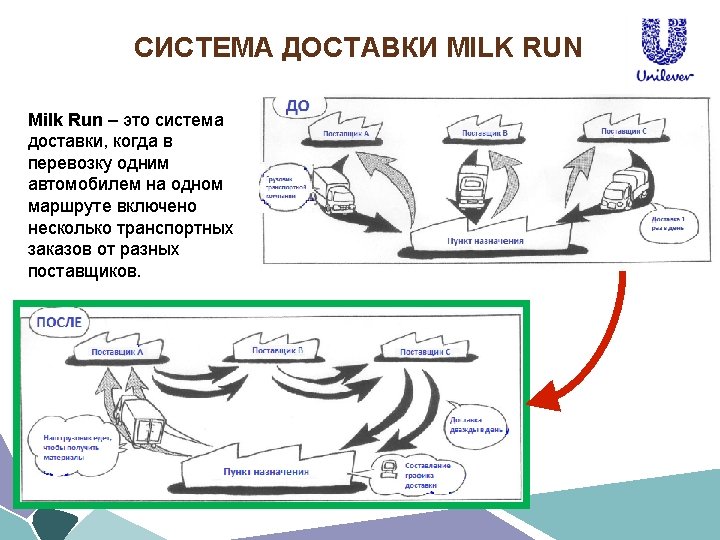
 Consolidate Suppliers to Local & Import Milk Runs")

")

 Supplier LT reduced to")

- Slides: 34
INVENTORY KPI PER FACTORIES Ноябрь IC Tula IC Omsk Foods Tula Tea HPC Ekat HPC SPete 19, 6 MAT DOH 11 8 13 Days inventory 14 10 14 15 21, 8 21 1
ПРИЧИНЫ ВЫСОКИХ ЗАПАСОВ сырья и упаковки Storage - Safety stock set too high Production Issues - Labor issues - Technological constraints - Breakdown / Downtime / Changeovers - Inaccurate BOM - Change in OR Sourcing - Availability / Cost / Quality of RM - Price fluctuations - Lead time variation - On Time In Full - Contractual Policies Master Data Demand related issues - Forecasting inaccuracy - Demand variability - No. of new products HIGH INVENTORY - Suppliers MOQ - Long LT 2
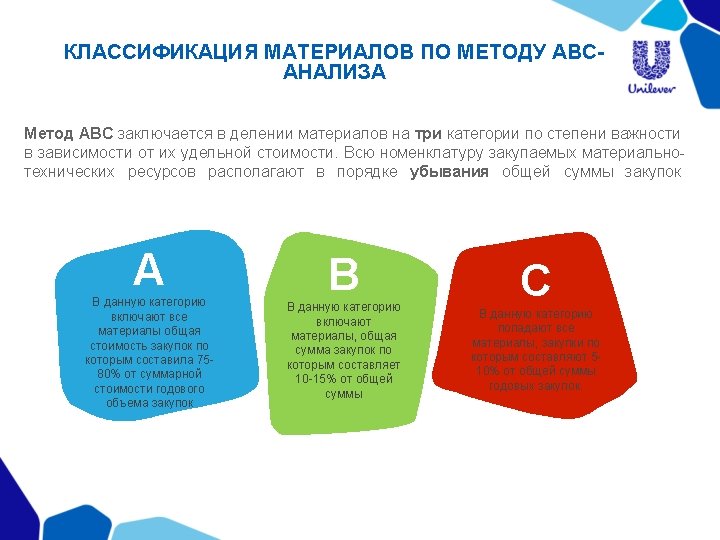
Пример Классификация сырья и упаковки Priority Average consumption Price per item Lead Time Shelf life A: > 15 k€ (70%) B: > 4, 5 k€ (20%) C: < 4, 5 k€ (10%) A: > 5 € B: > 1 € C: < 1 € A: > 2 months B: > 1 month C: >2 weeks A: < 6 months B: > 6 months C: > 1 year Classification goals: -To define supply strategies for different groups of RPM in order to minimize stock value; - To prioritize RPM issues
RPM LOSS TREE Stock loss tree – стратификация товарного запаса по причинам его происхождения Цель Stock loss tree - понять в каких зонах (товарных группах / причинах возникновения) лежат самые большие возможности для оптимизации запаса RM/PM stocks classified as Safety, Cycle and Over Stock. ABC classification of RM/PM stocks are done and most important RM/PM stocks (A class) are deeply analyzed as they contribute to most of the stocks Before proceeding with analysis and stock reduction activities, Master Data should be controlled on SAP. Having correct Master Data on SAP is critically important as MRP plans orders with the defined parameters as MOQ, lead time on SAP. Quarterly review of master data results in better stock management and reduction.
RPM LOSS TREE Safety Stock Root cause of safety stock is Demand variation during Lead Time. Какая же корневая причина? Main actions to reduce LT are: • Reduction of LT by Supplier – JIT shipments especially for local PM. • Localization of Material • Consignment Agreement with Supplier
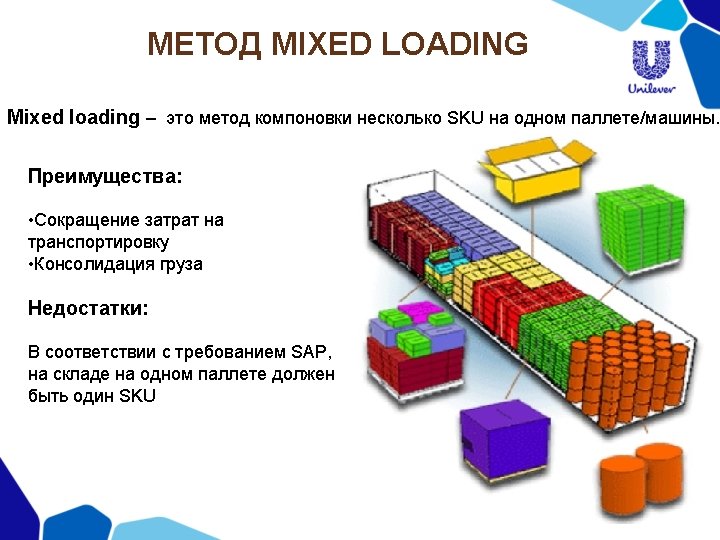
RPM LOSS TREE Cycle Stock: Root cause of Cycle Stock in Minimum Order Quantity (MOQ). MOQ reduction activities should be taken with Procurement support for high MOQ – high Cycle stock materials От чего зависит MOQ? Main actions to reduce Cycle stock are • Milk run delivery • Mixed load delivery • MOQ reduction
RPM LOSS TREE Over Stock Root cause of overstock is demand variation during Lead Time While managing RM/PM stocks, we keep the flexibility for market demand changes. Main action to reduce overstock is dynamic management of stock & call-offs, while ensuring the responsiveness to market demand changes. Main actions to reduce Over stock are • LT reduction • MOQ reduction • Push-back of call-offs according to Production Plan Changes: Reviewing call-offs and giving instant information to suppliers for push back of orders where necessary • RND support
Loss tree example
Loss tree example
Loss tree example RPM Average 500 450 400 350 300 250 200 150 100 50 0 Cycle Stock Safety stock Cycle stock Root cause: high batch quantity derived by MOQ or full truck delivery Overstock Blocked stock Quarantine stock Safety stock Root cause: forecast fluctuation (uplifts) during lead time, quality rejections Blocked stock Root cause: Quality of raw or packaging Overstock with forecast Root cause: demand drop during lead time Quarantine stock Root cause: long time for quality control (up to 7 days)
SAFETY & OVERSTOCK REDUCTION DUE TO LT REDUCTION Raspberry sauce stock, k. E Localization Oct 60 40 2016 20 2017 0 Jan Feb. Mar Apr. May. Jun Jul Aug. Sep Oct Nov. Dec Opportunity for lead time decrease by means of localization Sticks stock, k. E 120 Supplier change Jun 2016 70 2017 20 Jan Feb Mar Apr May Jun Jul Aug. Sep Oct Nov. Dec Opportunity for lead time reduction by means of change of supplier (from China to Europe) Lids for Cornetto LT reduction Capacity increase in supplier site Lids for Cornetto stock, k. E 60 40 2016 20 2017 LT reduction due to production process change by supplier Jan Feb Mar Apr May Jun Jul Aug Sep Oct Nov Dec -
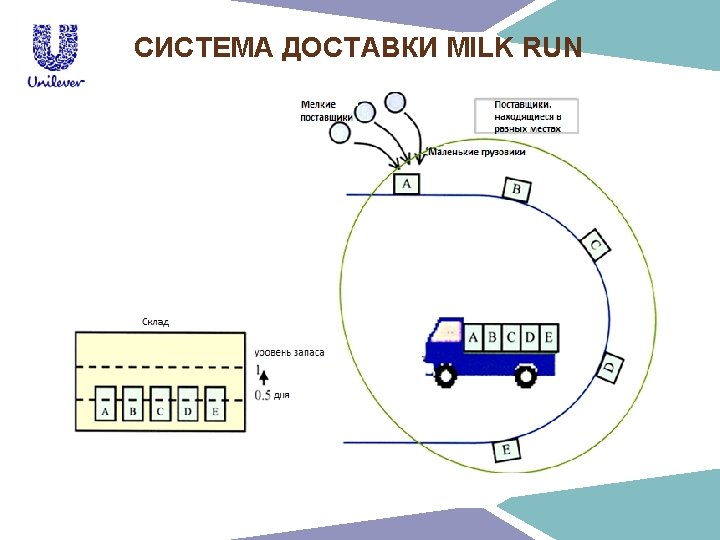
CYCLE STOCK REDUCE VIA MILKRUN 1) Consolidate Suppliers to Local & Import Milk Runs HPC Factory Supplier TEA Factory HPC Cycle Stock Reduction: -0, 78 CRITERIA TO CONSOLIDATION: Ø Cover from 1 delivery lot Ø Location Ø # of pallets required per month Ø Cost of transportation 2) Transform Milk Runs from Fixed Routes to Flexible Routes: Modify Them for Every Delivery Based on Demand 3) Consolidate Deliveries from Single Supplier to St. Petersburg Site -> Increased Frequency of Deliveries TEA Cycle Stock Reduction: -0, 5
CYCLE STOCK REDUCTION VIA MOQ optimisation ABC CLASSIFICATION MATERIALS: 3 X 3 MATRIX TOP 5 AA ROOT CAUSE high batch delivery (1 batch delivery = 1 production lot of supplier) ACTION Negotiation with supplier, procurement and marketing: ü the delivery batch is synchronized with the finished product batch RESULT Cycle stock reduction 26, 5 k. E
LT reduction example Localization/chang e of supplier SS at Unilever (low consumption, small cost) Expensive material with high SS Constraining LT (we have to keep SS for this material) SS at WH of Change of production supplier SS for strategic raw technology at Capacity increase supplier site 65 Lead time reduction from at supplier site days to 7 days on average 65 days Variability during this lead-time was covered by RPM Safety Stock
LT reduction example stages that cannot be shortened technologically BEFORE – 38 days Unilever RPM ordering the longest critical stage Sales order processing Order technical specification analysis Raw components ordering and approving Prepress Printing cylinder preparation Production plan update Printing exposure The 1 st Lamination Post lamination stage The 2 nd Lamination Post laminatio n stage Cutting Polymerization Delivery 1 day 4 days 3 days 6 days 2 days 1 day 2 days 1 day 10 days 1 day Stages eliminated AFTER – 19 days Unilever RPM ordering Stages synchronized Sales order processing Order technical specification analysis 50% LT REDUCTION Raw components ordering and approving Production plan update Printing exposure The 1 st Lamination Post lamination stage The 2 st Lamination 1 day 1/2 days 1/4 days Post lamination stage Cutting 2 day Polymerization Delivery 10 days 1 day 17
LT reduction example SS at Unilever (low consumption, small cost) Supplier LT reduced to 19 days, SS decreased by 68 k. E SS for strategic raw of lead Time, 1 day is Finally, Lead Time optimized to 7 Out days scheduling - we can parallel it 148 KE SS reduction with RPM ordering. 2 days for delivery to RDS and preparation for shipment – we can organize direct delivery.