Introduction to Statistics Quantitative Methods in HPELS 6210
- Slides: 36
Introduction to Statistics Quantitative Methods in HPELS 6210
Agenda Roadmap n Basic concepts n Inferential statistics n Scales of measurement n Statistical notation n
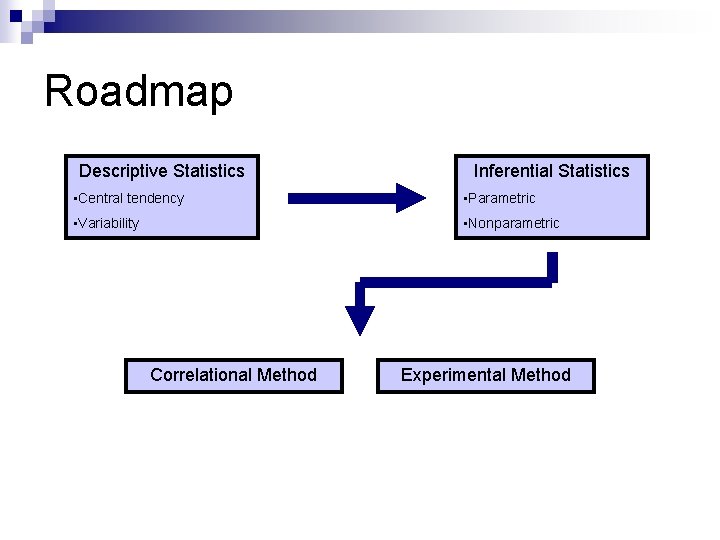
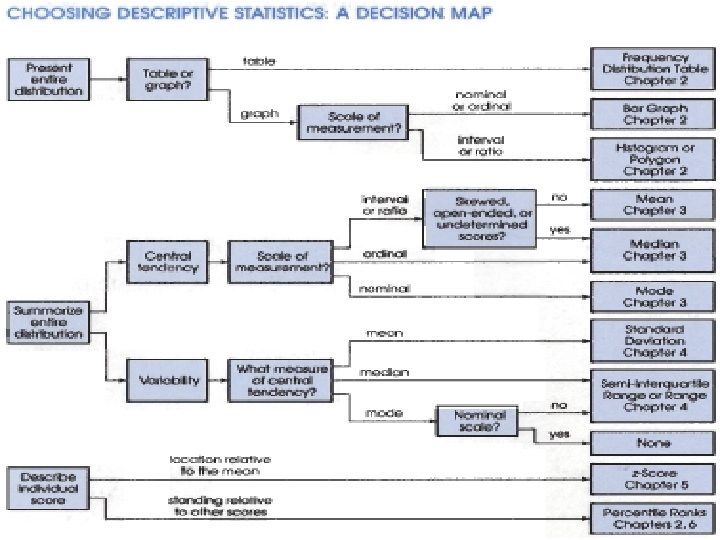
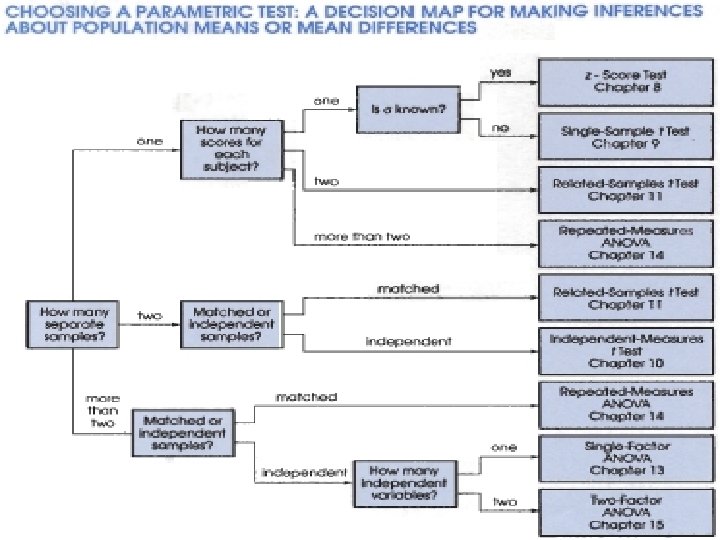
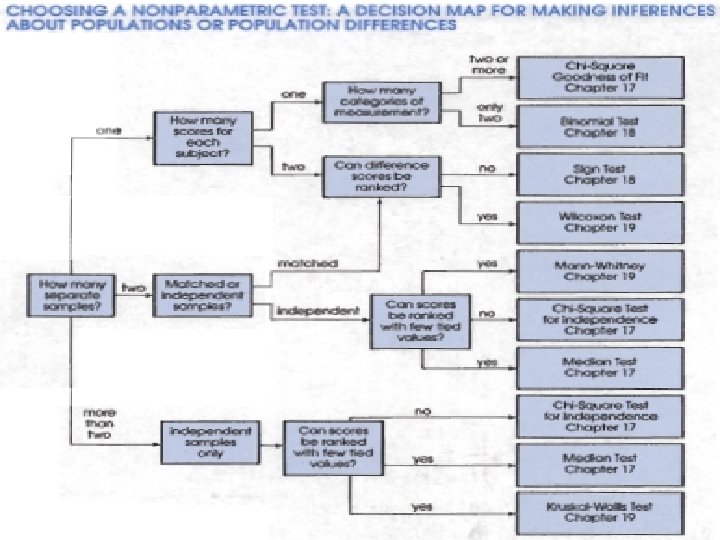
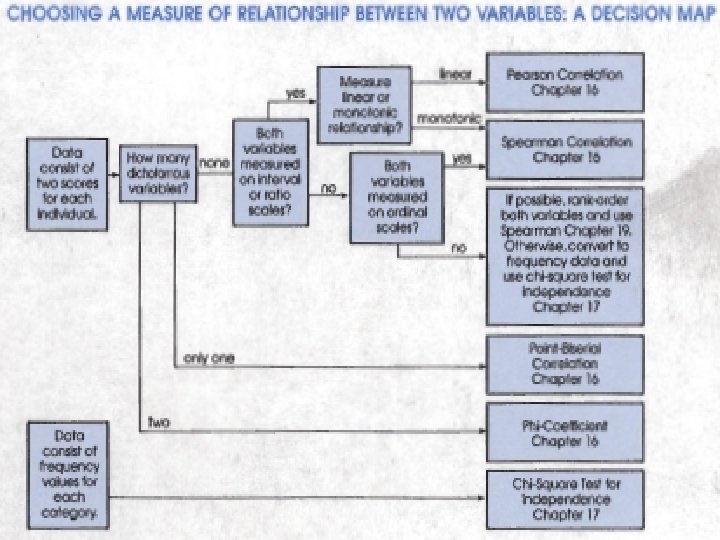
Roadmap Descriptive Statistics Inferential Statistics • Central tendency • Parametric • Variability • Nonparametric Correlational Method Experimental Method
Agenda Roadmap n Basic concepts n Inferential statistics n Scales of measurement n Statistical notation n
Basic Concepts Statistics: A set of mathematical procedures for organizing, summarizing and interpreting information n Statistics generally serve two purposes: n ¨ Organize and summarize n Descriptive statistics information ¨ Answer questions (interpretation) n Inferential statistics
Basic Concepts n n Population: The set of all individuals or subjects of interest in a particular study Sample: The set of individuals or subjects selected from a population intended to represent the population of interest Parameter: A value that describes a population Statistic or test statistic: A value that describes a sample
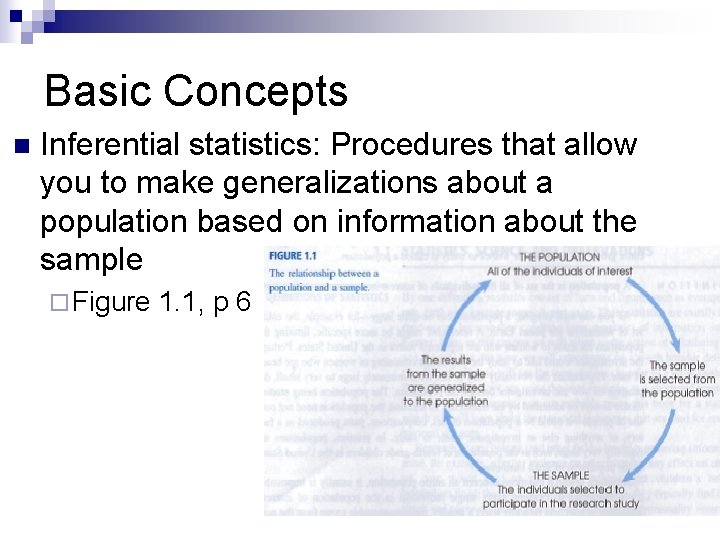
Basic Concepts n Inferential statistics: Procedures that allow you to make generalizations about a population based on information about the sample ¨ Figure 1. 1, p 6
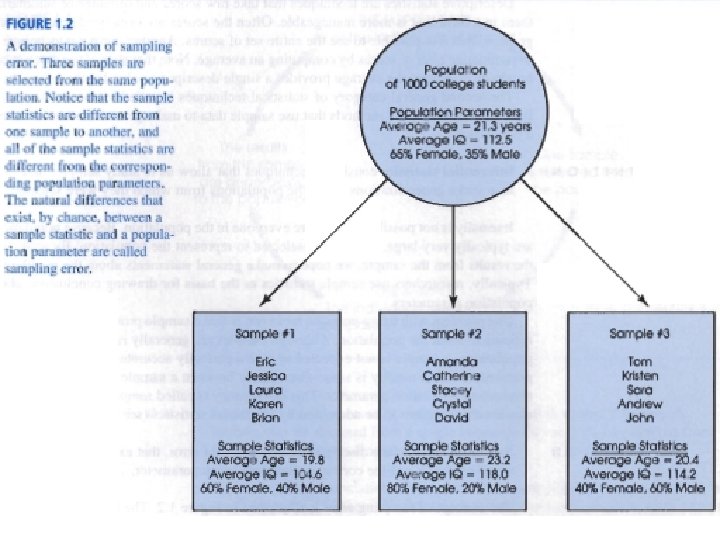
Basic Concepts n Sampling error: The discrepancy that exists between a sample statistic and the population parameter ¨ Figure 1. 2, p 8
Agenda Roadmap n Basic concepts n Inferential statistics n Scales of measurement n Statistical notation n
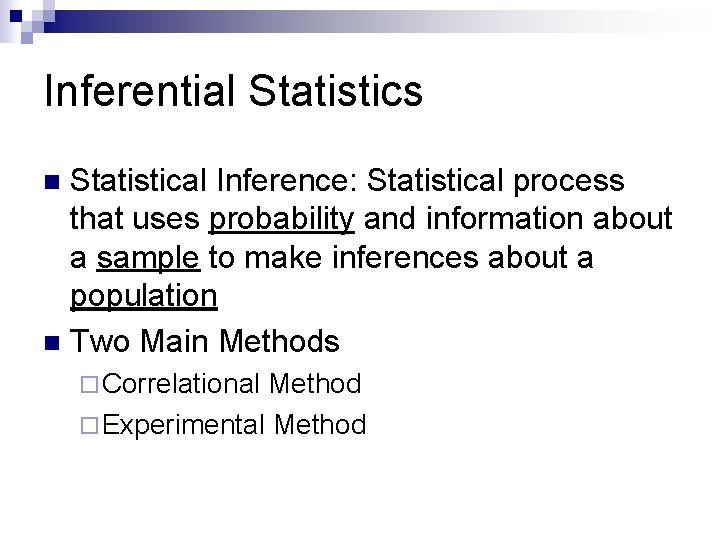
Inferential Statistics Statistical Inference: Statistical process that uses probability and information about a sample to make inferences about a population n Two Main Methods n ¨ Correlational Method ¨ Experimental Method
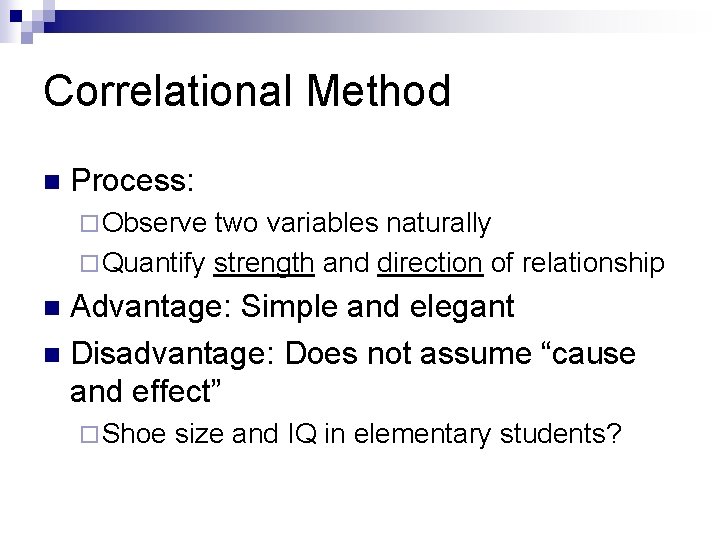
Correlational Method n Process: ¨ Observe two variables naturally ¨ Quantify strength and direction of relationship Advantage: Simple and elegant n Disadvantage: Does not assume “cause and effect” n ¨ Shoe size and IQ in elementary students?
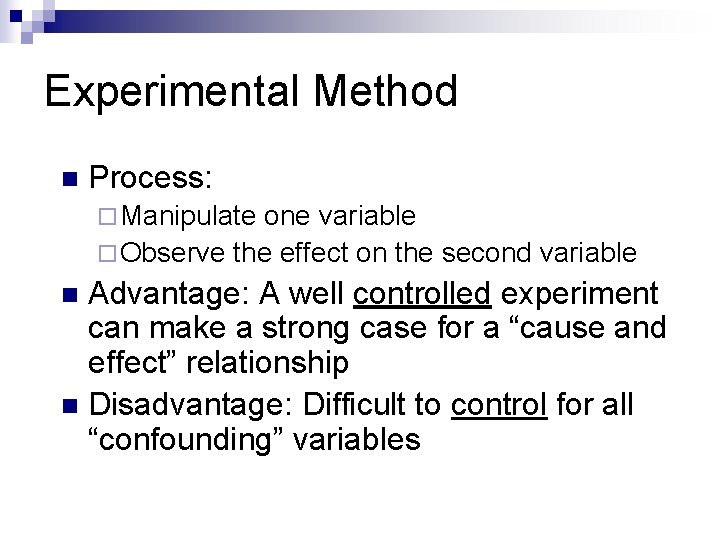
Experimental Method n Process: ¨ Manipulate one variable ¨ Observe the effect on the second variable Advantage: A well controlled experiment can make a strong case for a “cause and effect” relationship n Disadvantage: Difficult to control for all “confounding” variables n
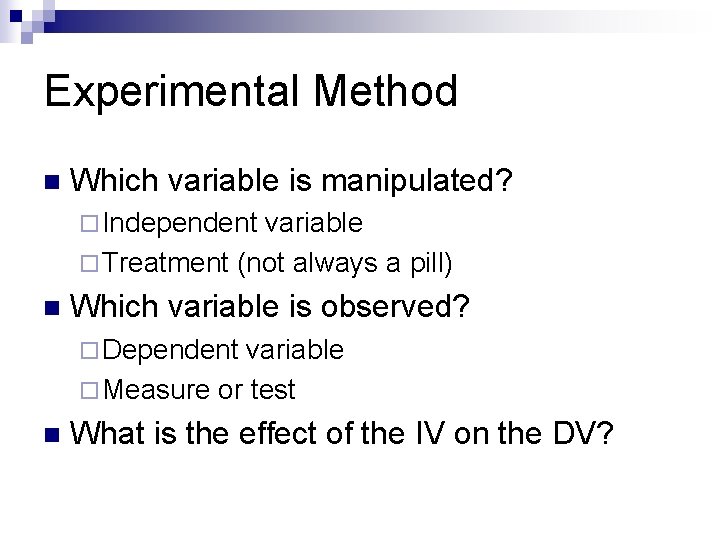
Experimental Method n Which variable is manipulated? ¨ Independent variable ¨ Treatment (not always a pill) n Which variable is observed? ¨ Dependent variable ¨ Measure or test n What is the effect of the IV on the DV?
Agenda Roadmap n Basic concepts n Inferential statistics n Scales of measurement n Statistical notation n
Scales of Measurement n n n The scales of measurement describe the nature/properties of data The scale of measurement affects the selection of the test statistic The are four scales of measurement: 1. Nominal 2. Ordinal 3. Interval 4. Ratio
Scales of Measurement: Nominal n 1. 2. 3. Characteristics of Nominal Data: Assigns names to variables based on a particular attribute Divides data into discrete categories No quantitative meaning
Scales of Measurement: Nominal n 1. Example: Gender as a variable Names assigned to variables based on particular attribute -Male or female 2. Divides data into discrete categories -Male or female (not both) 3. No quantitative meaning -Males cannot be quantified as “more or less” than girls
Scales of Measurement: Ordinal n 1. 2. Characteristics of Ordinal Data: Has quantifiable meaning Intervals between values not assumed to be equal
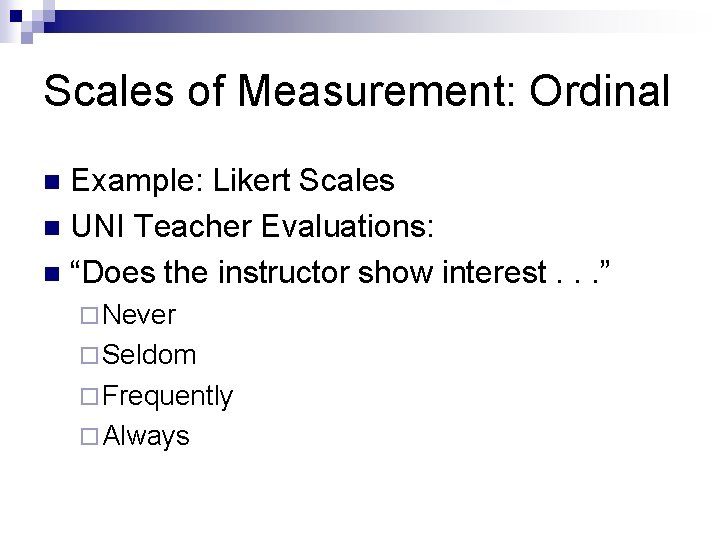
Scales of Measurement: Ordinal Example: Likert Scales n UNI Teacher Evaluations: n “Does the instructor show interest. . . ” n ¨ Never ¨ Seldom ¨ Frequently ¨ Always
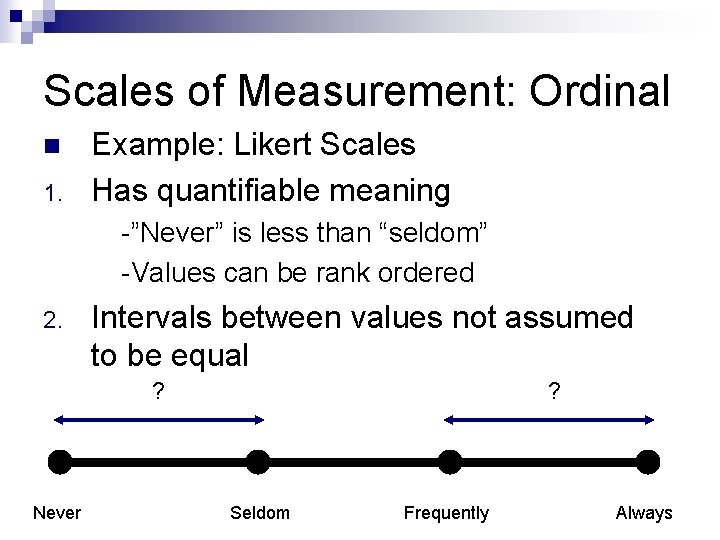
Scales of Measurement: Ordinal n 1. Example: Likert Scales Has quantifiable meaning -”Never” is less than “seldom” -Values can be rank ordered 2. Intervals between values not assumed to be equal ? Never ? Seldom Frequently Always
Scales of Measurement: Ordinal n Other examples: ¨ Small, medium, large sizes ¨ Low, medium, high performance
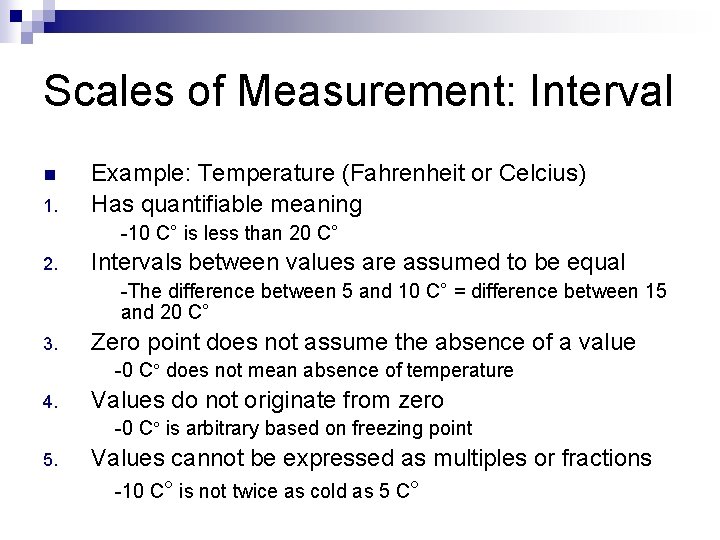
Scales of Measurement: Interval n 1. 2. 3. 4. 5. Characteristics of Interval Data: Has quantifiable meaning Intervals between values are assumed to be equal Zero point does not assume the absence of a value Values do not originate from zero Values cannot be expressed as multiples or fractions
Scales of Measurement: Interval n 1. Example: Temperature (Fahrenheit or Celcius) Has quantifiable meaning -10 C° is less than 20 C° 2. Intervals between values are assumed to be equal -The difference between 5 and 10 C° = difference between 15 and 20 C° 3. Zero point does not assume the absence of a value -0 C° does not mean absence of temperature 4. Values do not originate from zero -0 C° is arbitrary based on freezing point 5. Values cannot be expressed as multiples or fractions -10 C° is not twice as cold as 5 C°
Scales of Measurement: Ratio n 1. 2. 3. 4. 5. Characteristics: Has quantifiable meaning Intervals between values are assumed to be equal Zero point assumes the absence of a value Values originate from zero Values can be expressed as multiples or fractions
Scales of Measurement: Ratio n 1. 2. 3. 4. 5. Example: Length Has quantifiable meaning Intervals between values are assumed to be equal Zero point assumes the absence of a value Values originate from zero Values can be expressed as multiples or fractions
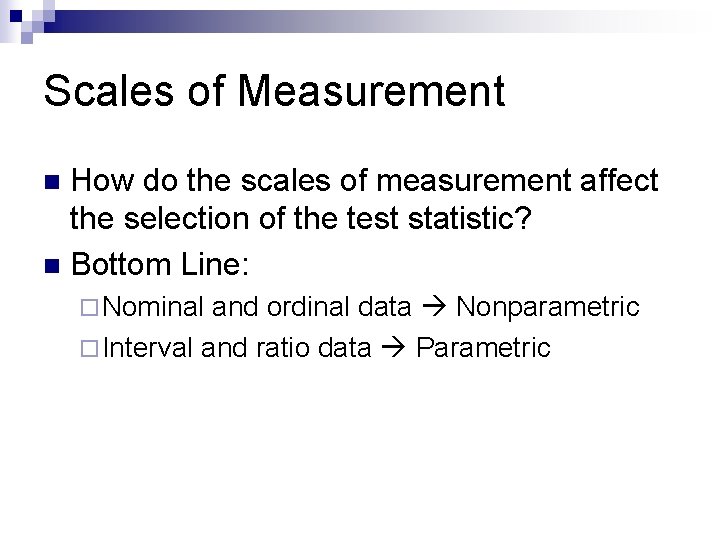
Scales of Measurement How do the scales of measurement affect the selection of the test statistic? n Bottom Line: n ¨ Nominal and ordinal data Nonparametric ¨ Interval and ratio data Parametric
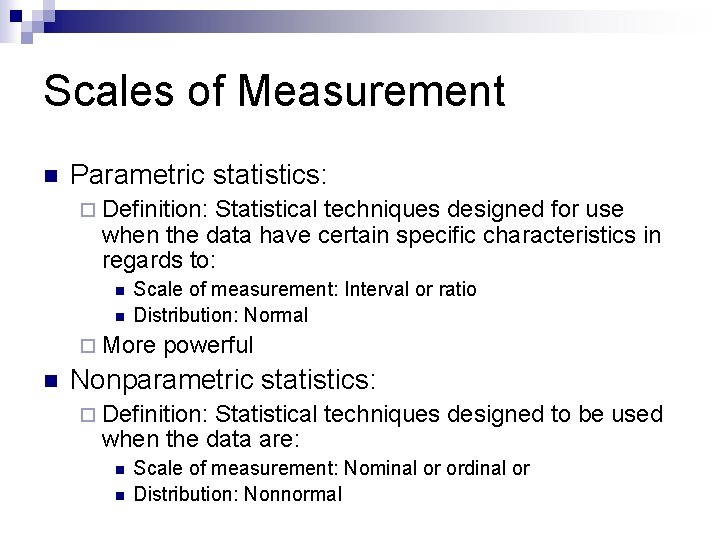
Scales of Measurement n Parametric statistics: ¨ Definition: Statistical techniques designed for use when the data have certain specific characteristics in regards to: n n Scale of measurement: Interval or ratio Distribution: Normal ¨ More n powerful Nonparametric statistics: ¨ Definition: Statistical techniques designed to be used when the data are: n n Scale of measurement: Nominal or ordinal or Distribution: Nonnormal
Agenda Roadmap n Basic concepts n Inferential statistics n Scales of measurement n Statistical notation n
Statistical Notation Textbook progressive introduction of statistical notation n Summation = n
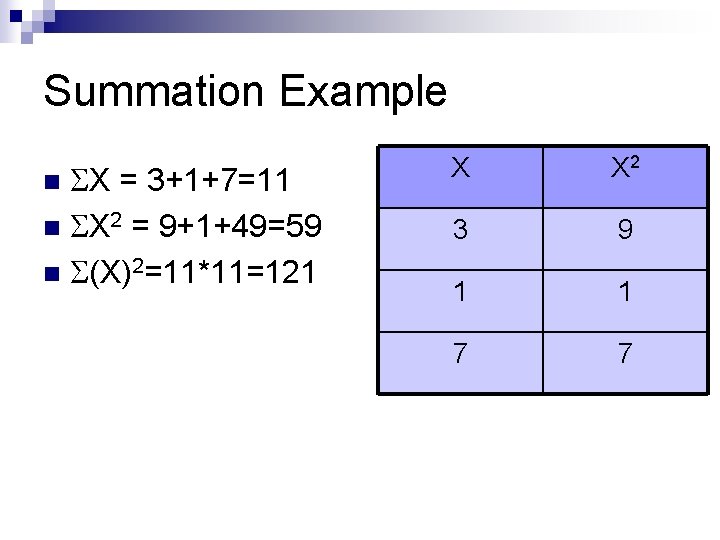
Summation Example X = 3+1+7=11 n X 2 = 9+1+49=59 n (X)2=11*11=121 n X X 2 3 9 1 1 7 7
Textbook Problem Assignment n Problems: 2, 8, 12 a, 12 c, 16, 20.