variable Variable Qualitative variable Quantitative variable Discrete variable

變數variable Variable 變數 Qualitative variable 類別變數 Quantitative variable 量化變數 Discrete variable 間斷變數 Continuous variable 連續變數 社會統計(上) 2
 定 義 • 一個連續數值的變數如何整理? • A frequency distribution is a listing of")
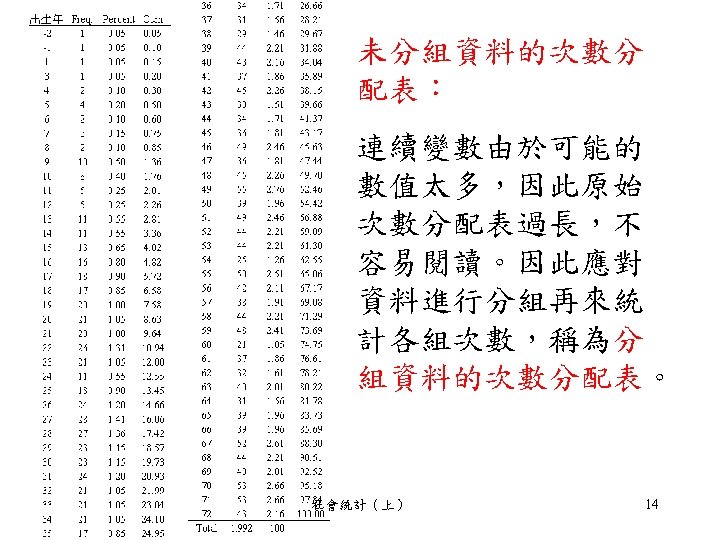
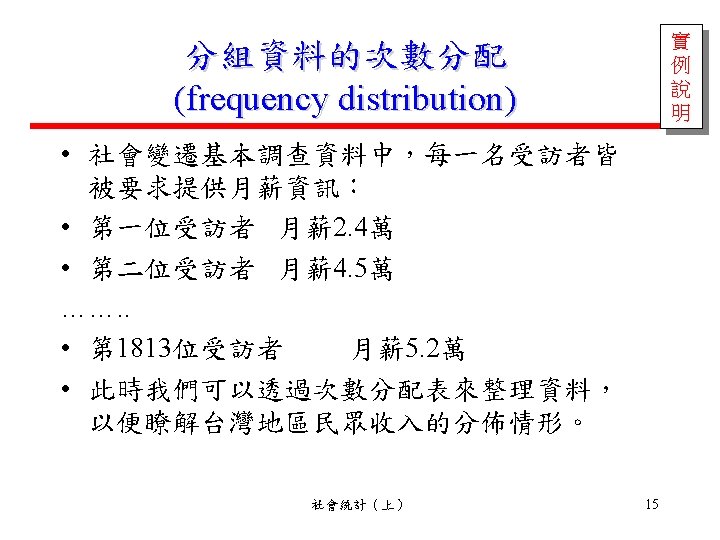
次數分配(frequency distribution) 定 義 • 一個連續數值的變數如何整理? • A frequency distribution is a listing of intervals of possible values for a variable, together with a tabulation of the number of observations in each interval. • 連續變數的次數分配必須先將資料進行分 組,即是將一個變數所有可能的數值分成 若干個區間(intervals),然後再按照每個觀 察值所屬的區間進行歸類(tabulate),計算 並列出每一個區間的觀察值個數。 社會統計(上) 13
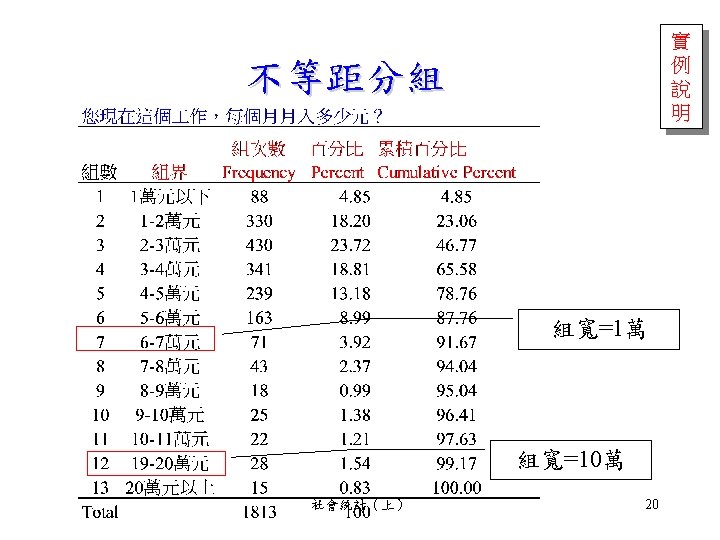
 定 義 上組界 Upper limit 下組界 Lower limit 組中點=(Bk+Bk-1)/2 Width of class組寬=")
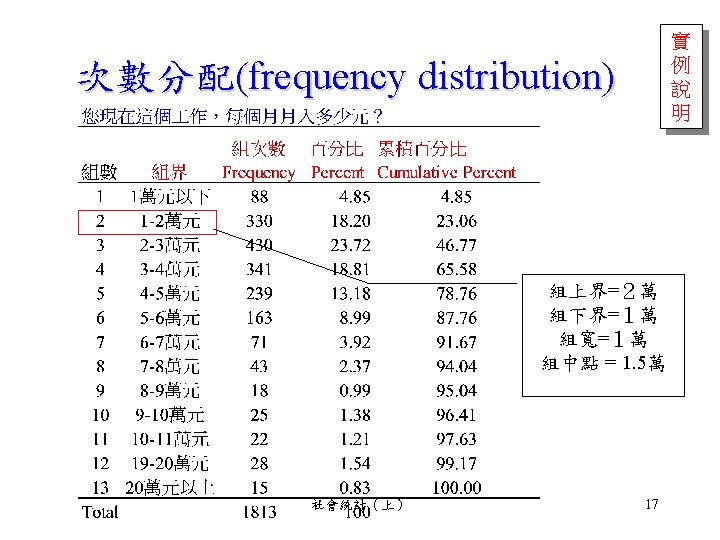
次數分配(frequency distribution) 定 義 上組界 Upper limit 下組界 Lower limit 組中點=(Bk+Bk-1)/2 Width of class組寬= Bk-1 社會統計(上) 16

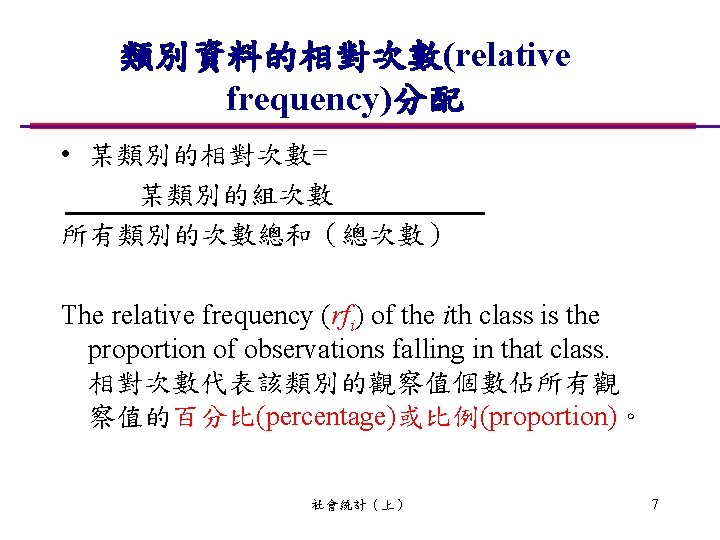
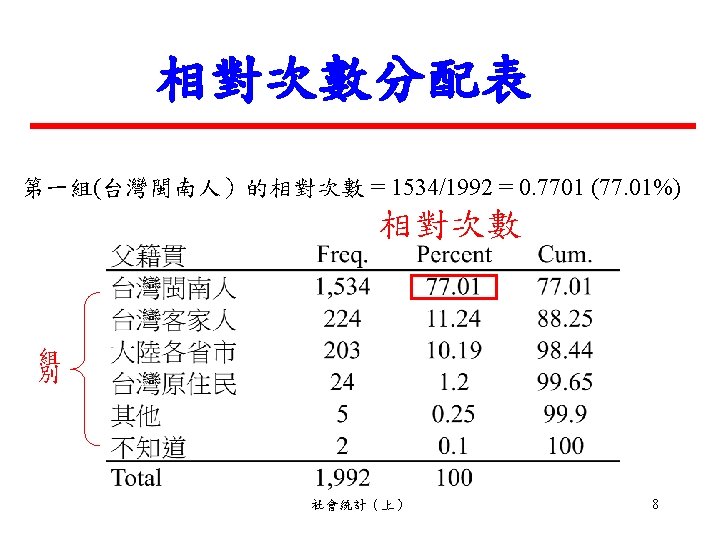
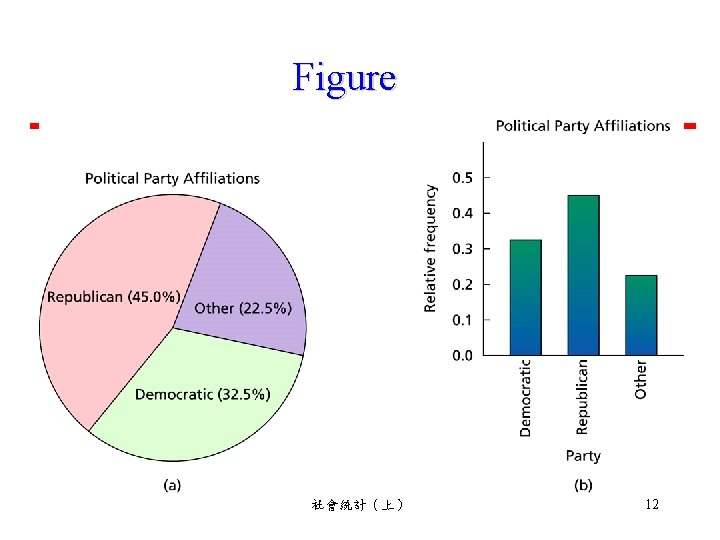
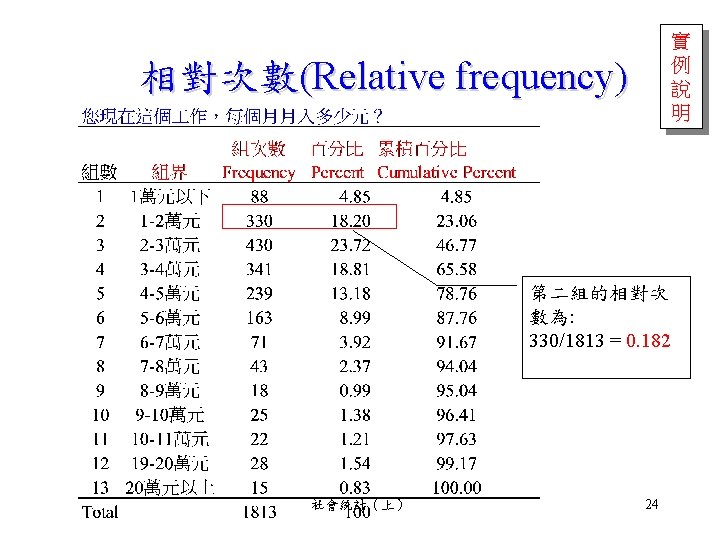
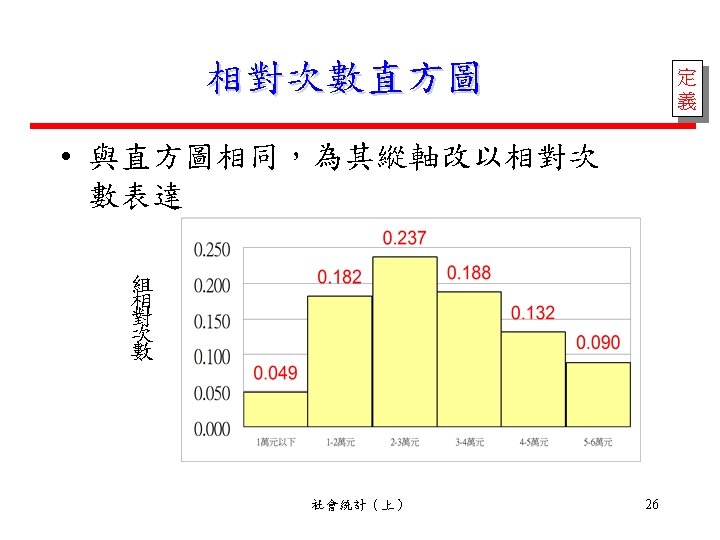
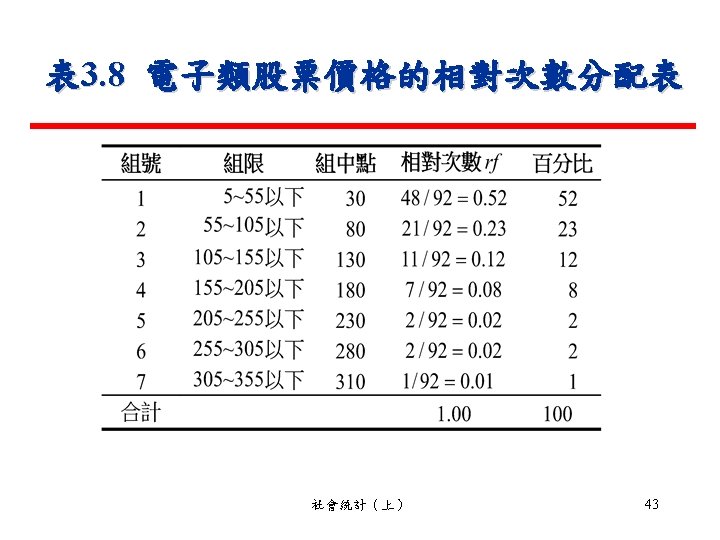
Relative Frequency Distributions 相對次數 定 義 • Relative frequency for an interval is the proportion of the sample observations that fall in that interval • 相對次數為第i組的次數,佔全體的比例。 社會統計(上) 23

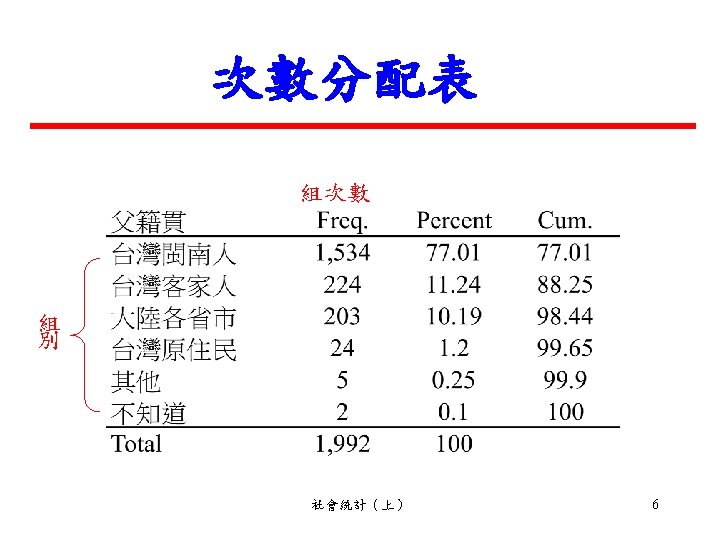
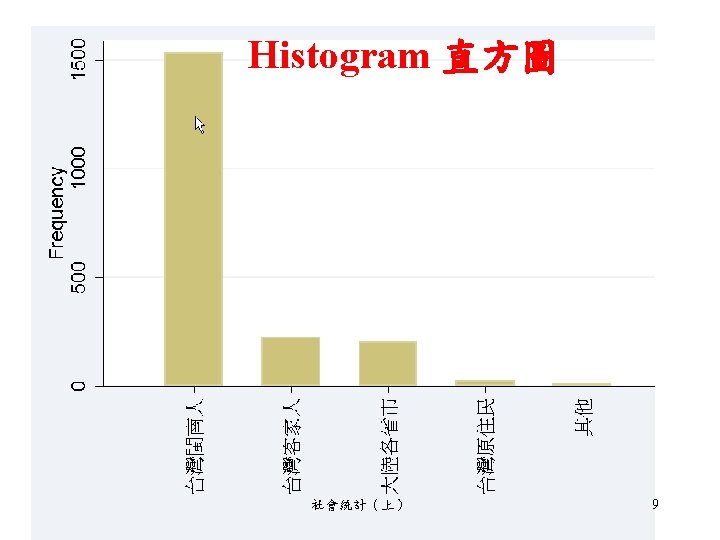
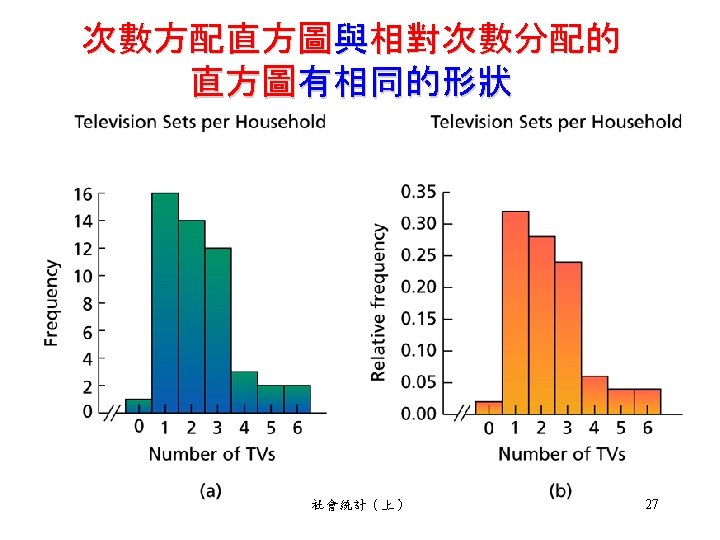
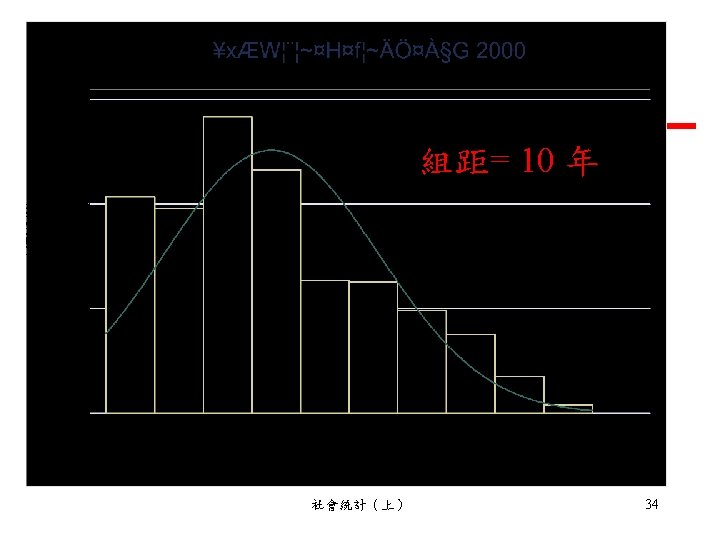
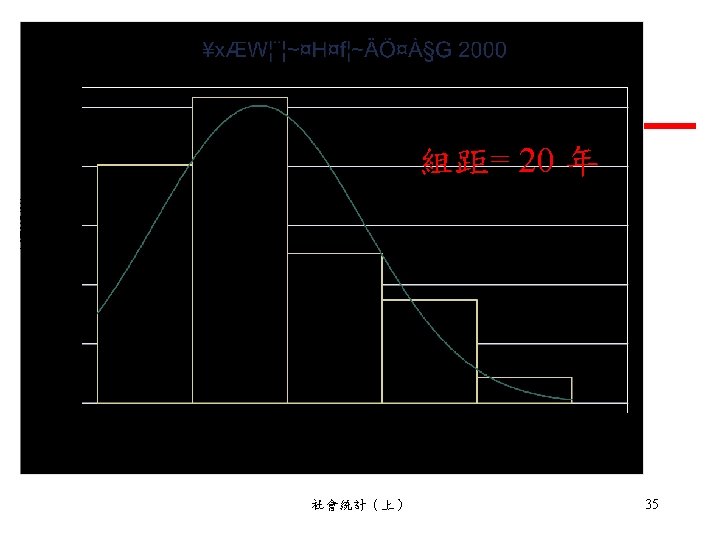
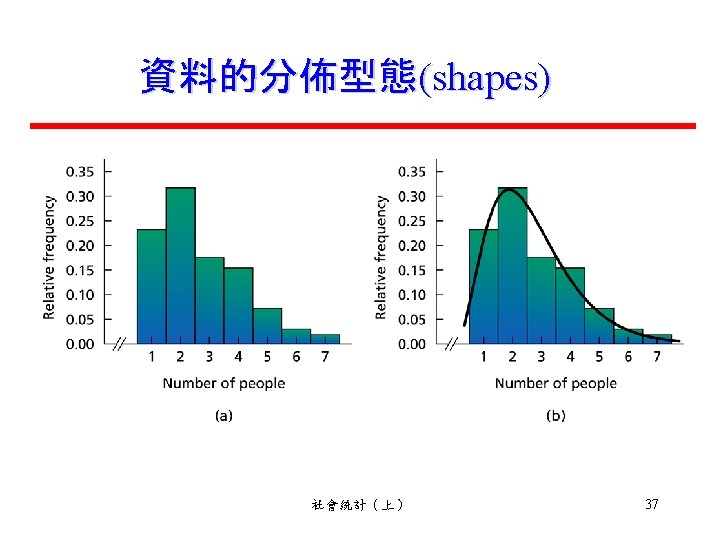
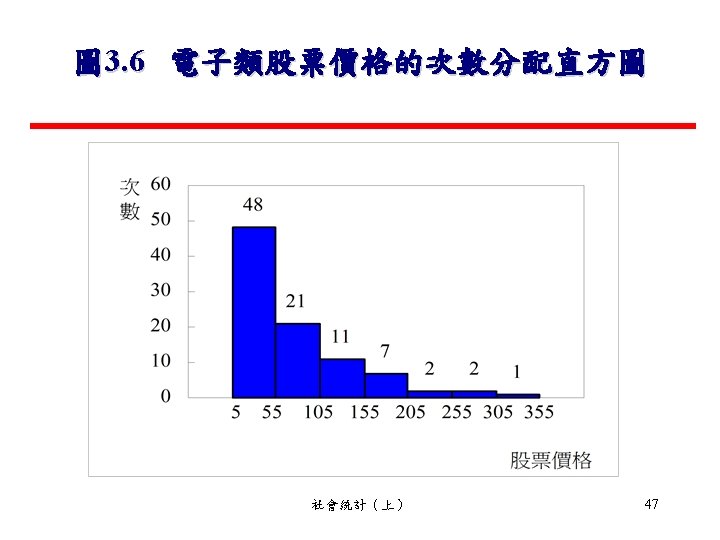
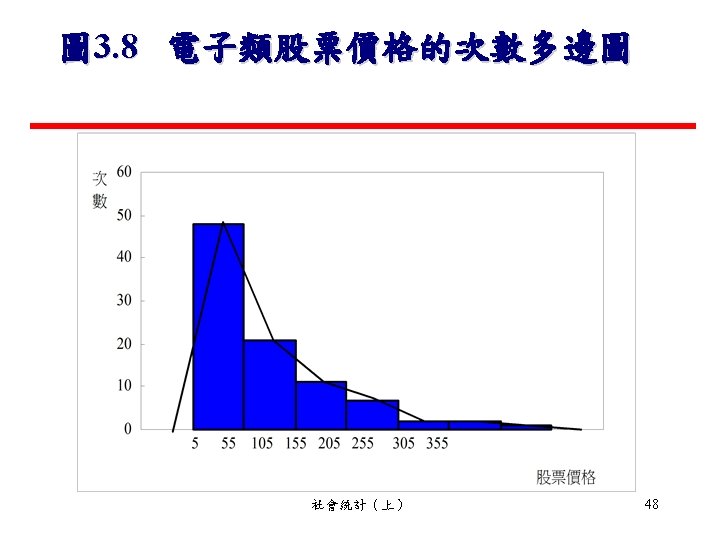
分組資料的直方圖 Frequency Histogram 定 義 • A frequency histogram is a graphical presentation of a frequency distribution. 組 次 數 社會統計(上) 25
 28")
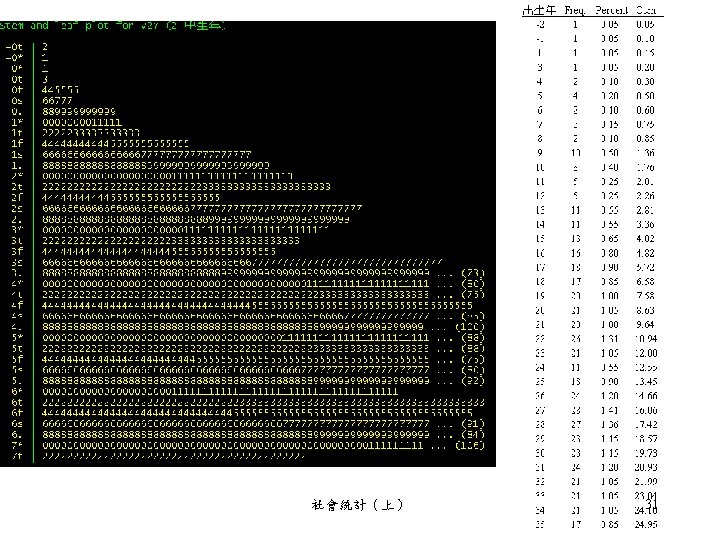
Stem-and-Leaf Plot 枝葉圖 社會統計(上) 28

Stem-and-Leaf Plot 枝葉圖 • • • • 統計期中考 Stem-and-Leaf Plot Frequency Stem & Leaf 1. 00 0. 8 1. 00 1. 8 2. 00 2. 45 5. 00 3. 44468 9. 00 4. 003466888 8. 00 5. 00044667 8. 00 6. 00224666 2. 00 7. 48 5. 00 8. 08889 5. 00 9. 02244 2. 00 10. 26 1. 00 11. 0 Stem width: 10 表示Stem為十位數, Leaf為個位數 社會統計(上) 29
 30")
Splitting stem分枝 社會統計(上) 30
 38")
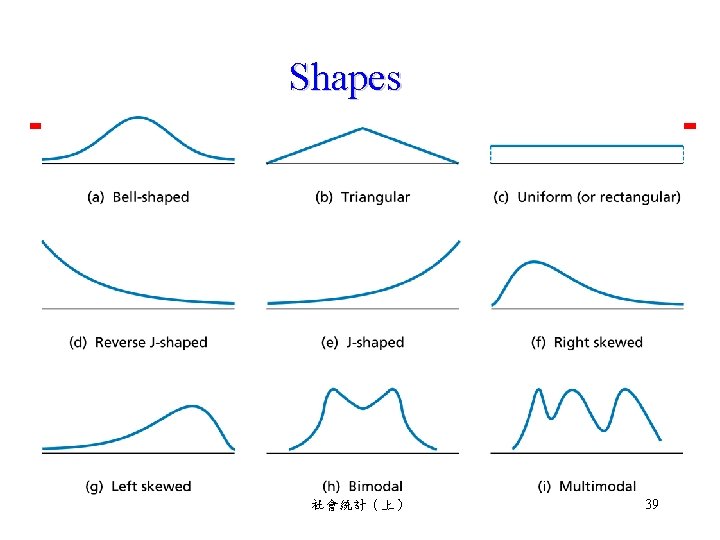
Symmetric distribution 對稱的資料分佈 社會統計(上) 38
 41")
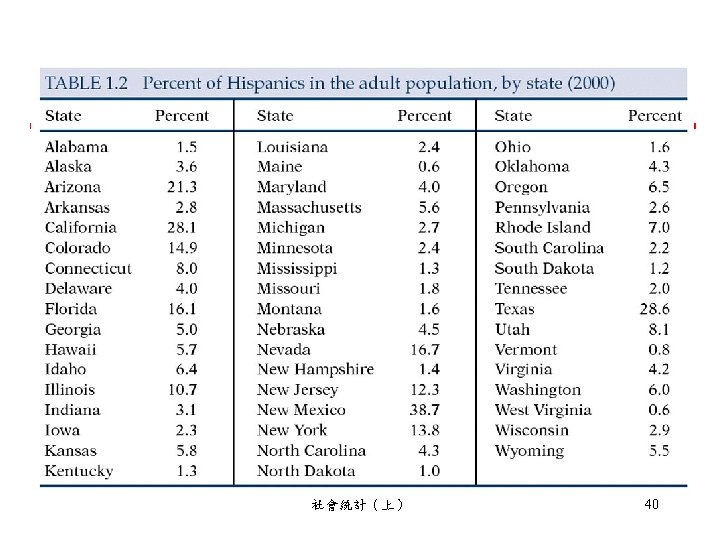
單峰unimodal 中心點約4% spread: 0%-40% 右偏skewed to the right outliers 社會統計(上) 41
 44")
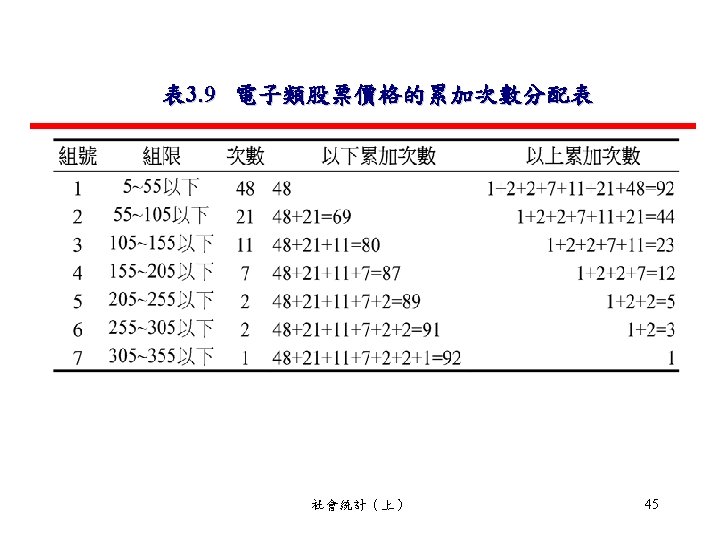
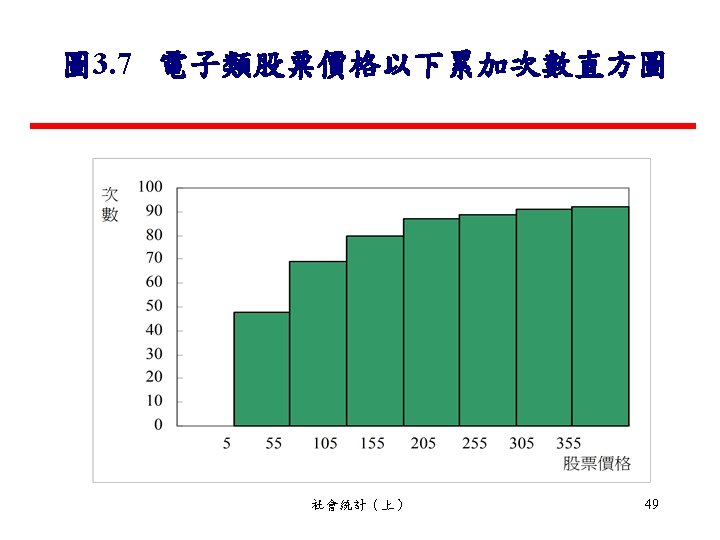
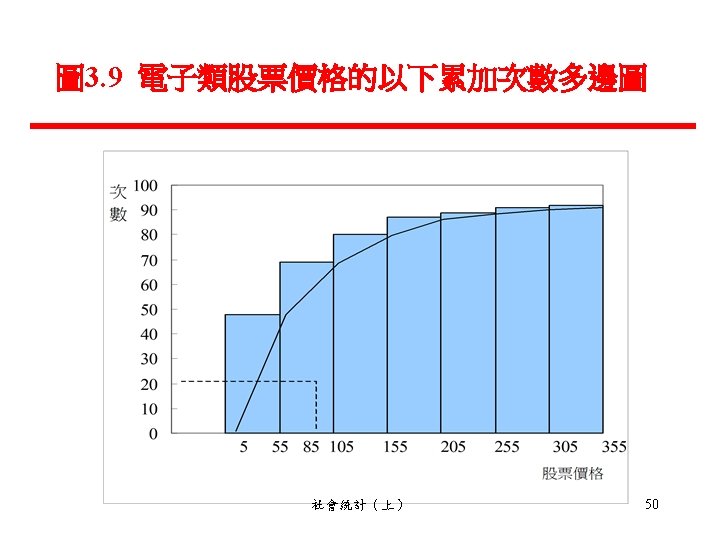
1 -1 Cumulative Frequency累加次數 社會統計(上) 44
與吉尼係數(Gini coefiicient) 社會統計(上) 54")
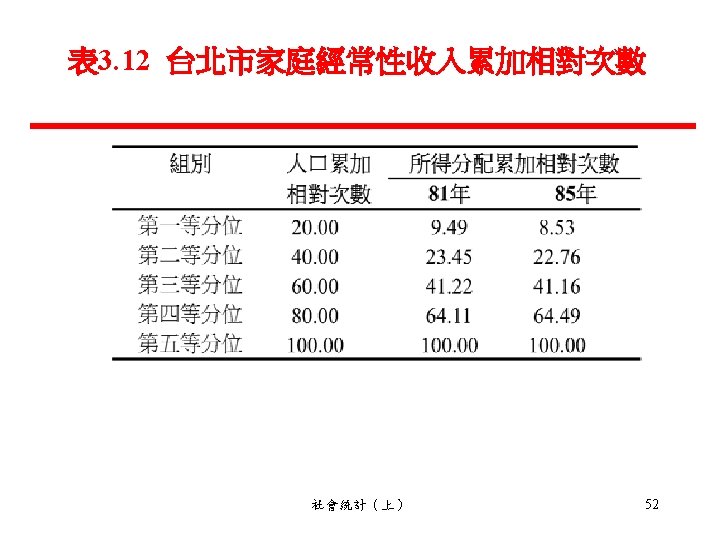
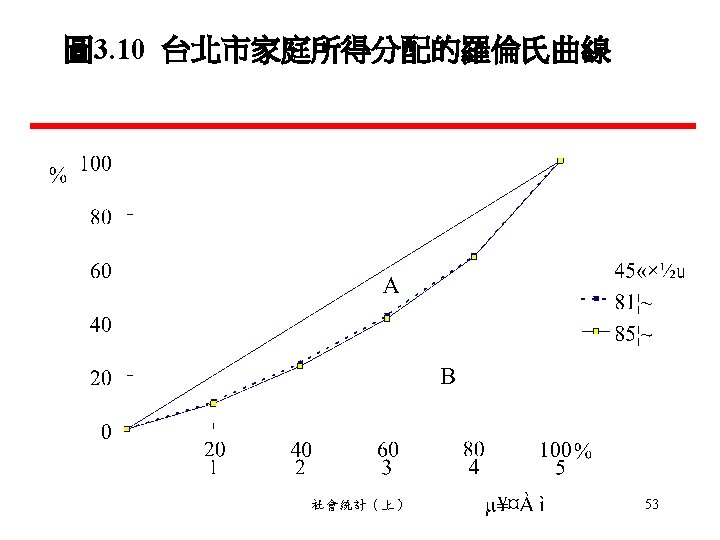
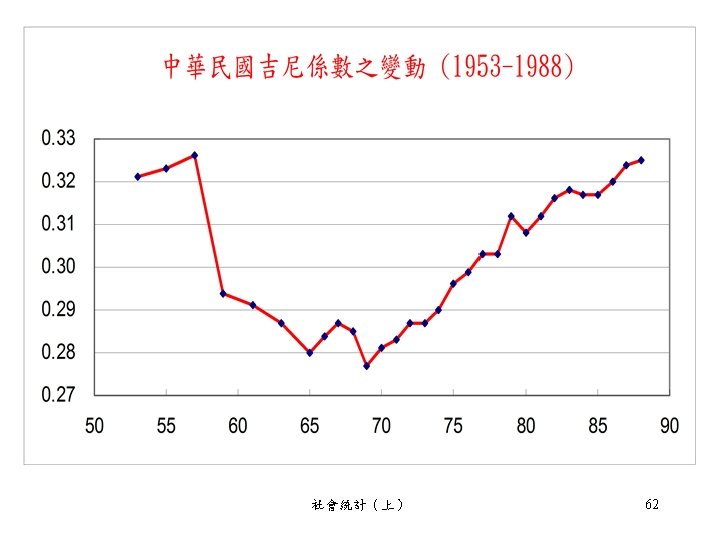
羅倫氏曲線Lorenz curve)與吉尼係數(Gini coefiicient) 社會統計(上) 54
與吉尼係數(Gini coefiicient) 社會統計(上) 55")
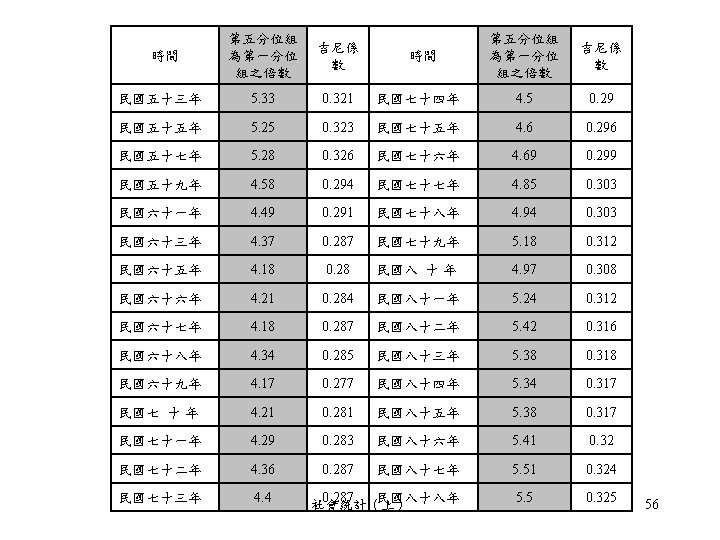
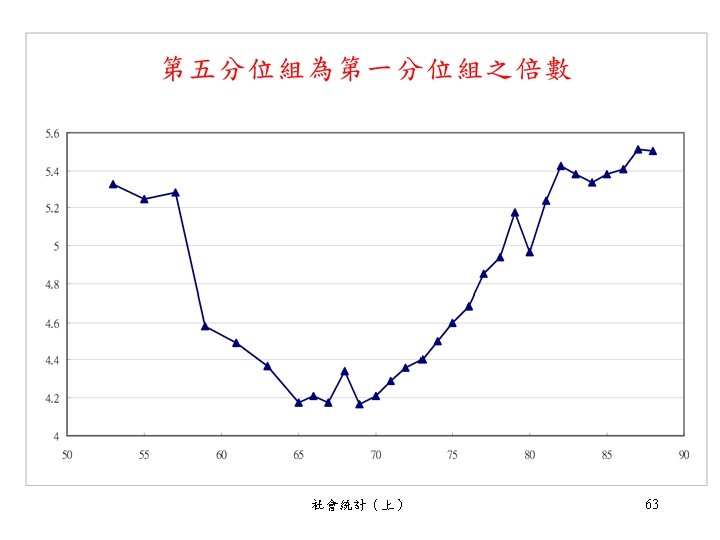
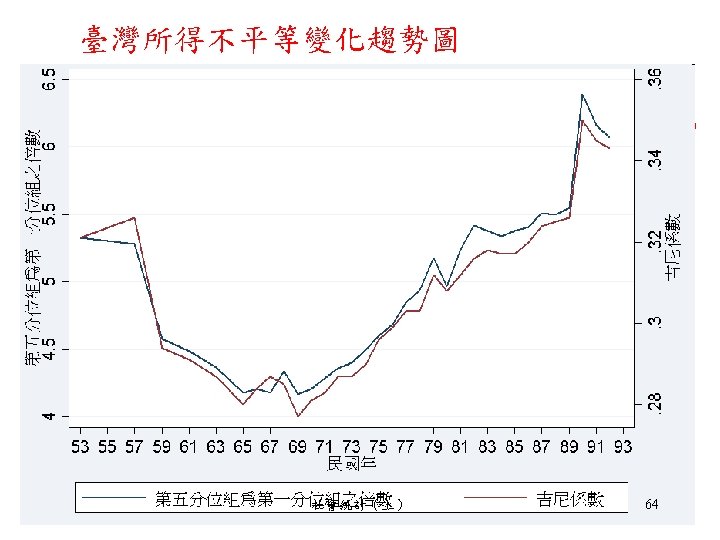
羅倫氏曲線Lorenz curve)與吉尼係數(Gini coefiicient) 社會統計(上) 55
 TAIWAN 0. 343 (2003) 社會統計(上) 65")
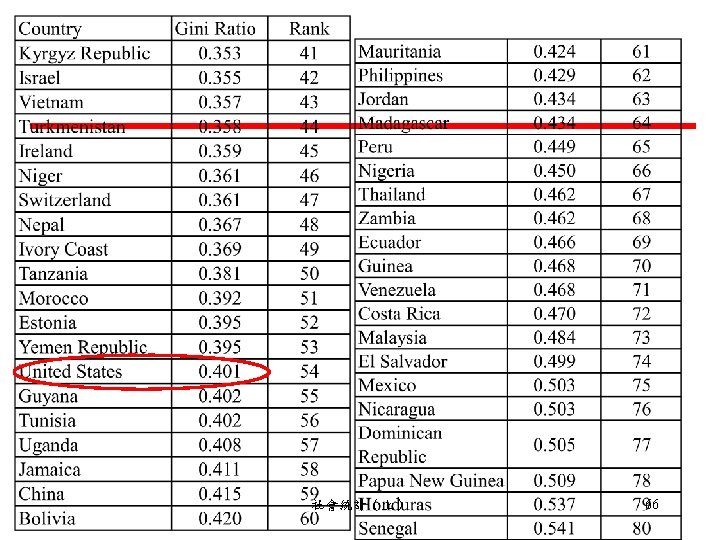
TAIWAN 0. 324 (1998) TAIWAN 0. 343 (2003) 社會統計(上) 65
- Slides: 66