Intransparency of the Amsterdam office market The underlying















- Slides: 52
In-transparency of the Amsterdam office market: The underlying incentive and effective rental price development A quantitative research into the market dynamics and spatial segmentation of the Amsterdam office market over the period 2002 -2012 Graduation Presentation Delft, University of Technology 1 st Mentor: Philip Koppels 2 nd Mentor: Hilde Remøy Commissoner: Remon Rooij Lab coordinator: Theo van der Voordt Student number: 1382136 Date: 21 -05 -2014 1 /50
Content I. III. IV. V. VI. Problem introduction Problem definition, Approach & Methods Theoretical framework Empirical research Conclusions Reflection on outcomes Content | I – Problem introduction | II – Problem definition | III -Theoretical framework | IV - Empirical research | V – Conclusions | VI – Reflection 2 / 50
I. Problem introduction II. Problem definition III. Theoretical framework and conclusions IV. Empirical research V. Conclusions VI. Reflection on outcomes 3 / 50
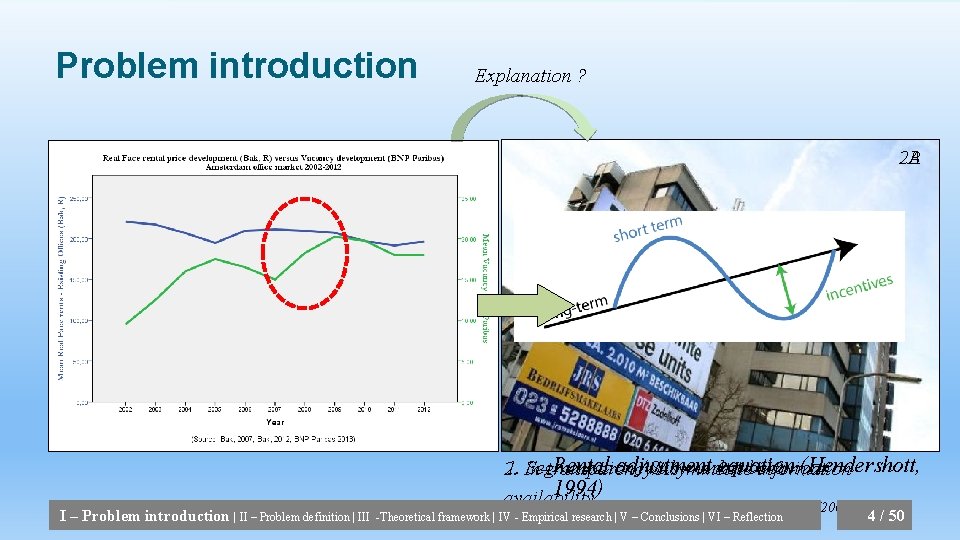
Problem introduction Explanation ? 2 B 2 A Face rental price Incentive Effective rental price I – Problem introduction | II – Problem definition | III Rental adjustment equation (Hendershott, 1. In-transparency/Asymmetric Segmentation / Sub-market behaviour 2. information 1994) availability Schematically illustrated by Koppels & Keeris (2006) -Theoretical framework | IV - Empirical research | V – Conclusions | VI – Reflection 4 / 50
Other consequences of limited/in-transparency • 1. Self-sustaining system • • 3. Research implications 2. Barrier third parties & Competitive functioning market I – Problem introduction | II – Problem definition | III -Theoretical framework | IV - Empirical research | V – Conclusions | VI – Reflection 5 / 50
I. Problem introduction II. Problem definition III. Theoretical framework and conclusions IV. Empirical research V. Conclusions VI. Reflection on outcomes 6 / 50
Main research questions • 1. To what extend does a price index based on face rents, provide an accurate reflection of the market dynamics in the Amsterdam Office market over the period 2002 – 2012? • 2. Do spatial market segments differentiate in market dynamics in the Amsterdam office market over the period 2002 -2012? I – Problem introduction | II – Problem definition | III -Theoretical framework | IV - Empirical research | V – Conclusions | VI – Reflection 7 / 50
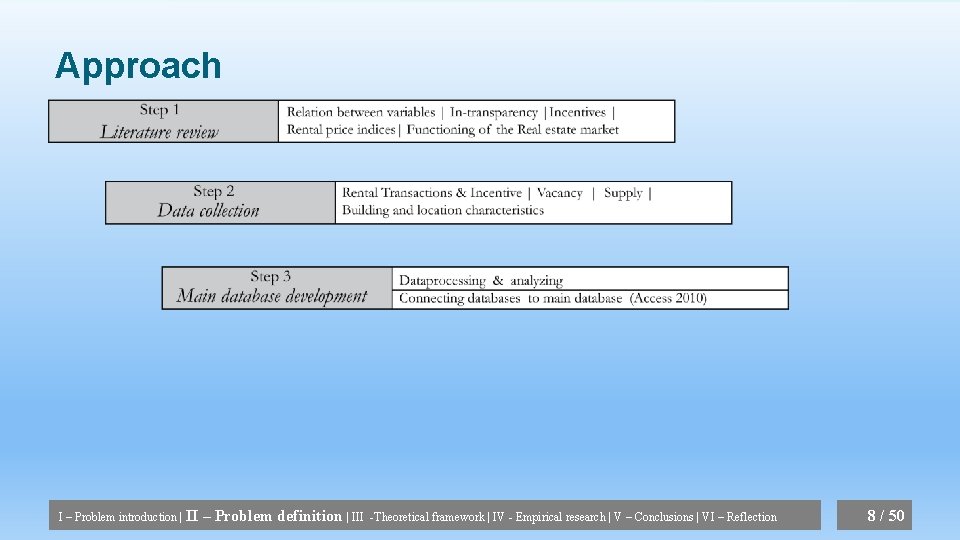
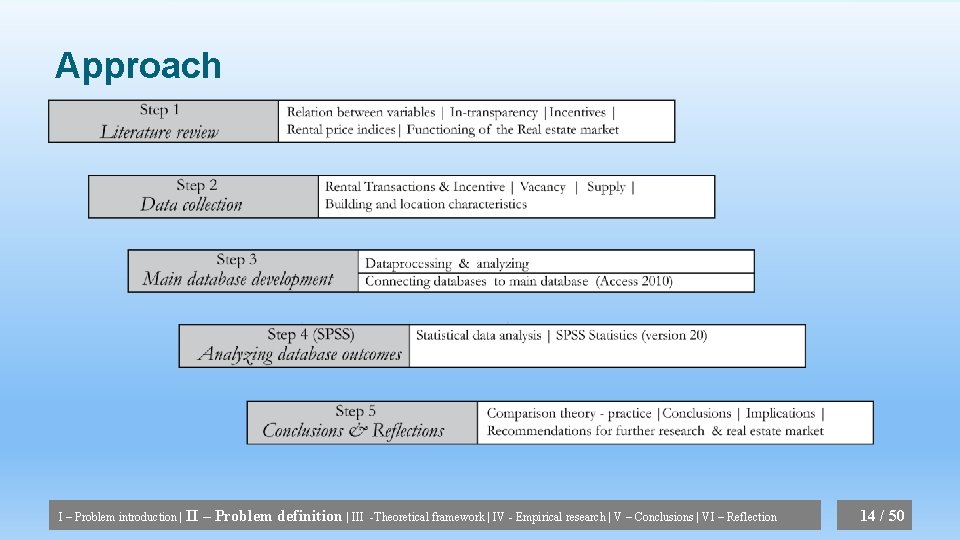
Approach I – Problem introduction | II – Problem definition | III -Theoretical framework | IV - Empirical research | V – Conclusions | VI – Reflection 8 / 50
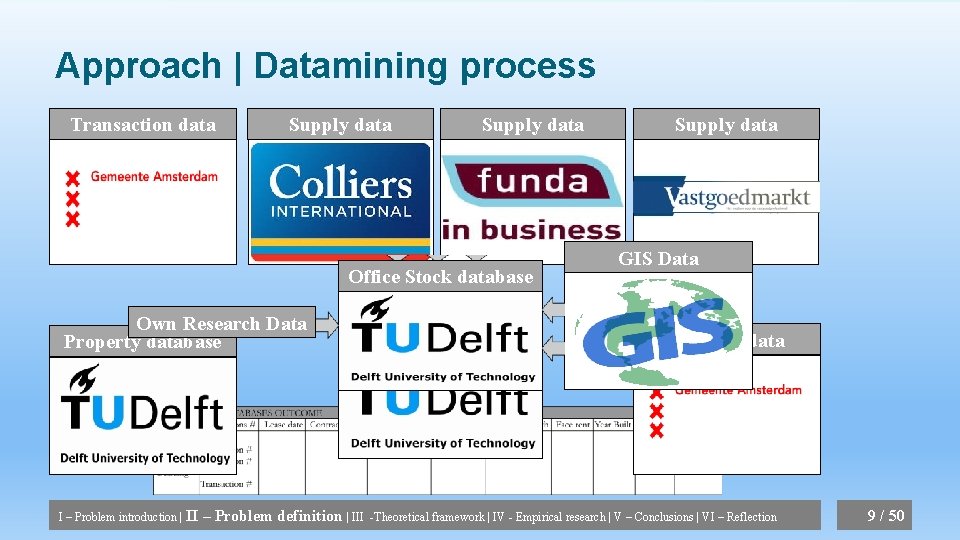
Approach | Datamining process Transaction data Supply data Office Stock database Own Research Data Property database I – Problem introduction | II – Problem definition | III BAG Database Supply data GIS Data Vacancy data -Theoretical framework | IV - Empirical research | V – Conclusions | VI – Reflection 9 / 50
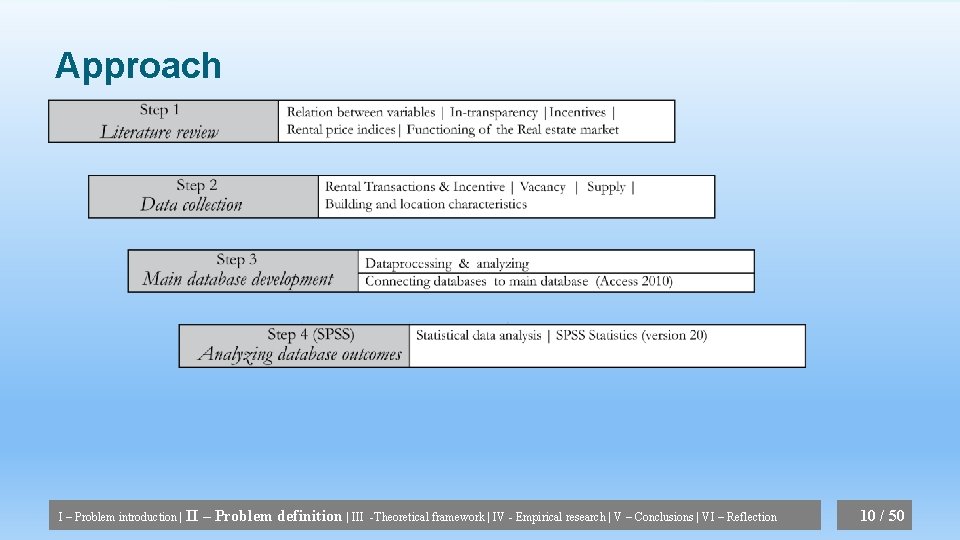
Approach I – Problem introduction | II – Problem definition | III -Theoretical framework | IV - Empirical research | V – Conclusions | VI – Reflection 10 / 50
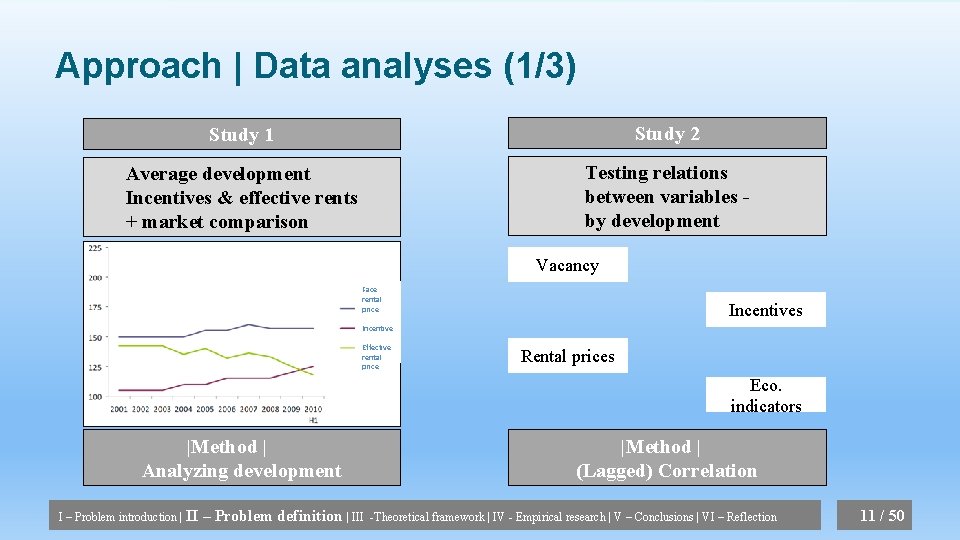
Approach | Data analyses (1/3) Study 1 Study 2 Average development Incentives & effective rents + market comparison Testing relations between variables by development Vacancy Face rental price Incentives Incentive Effective rental price Rental prices Eco. indicators |Method | Analyzing development I – Problem introduction | II – Problem definition | III |Method | (Lagged) Correlation -Theoretical framework | IV - Empirical research | V – Conclusions | VI – Reflection 11 / 50
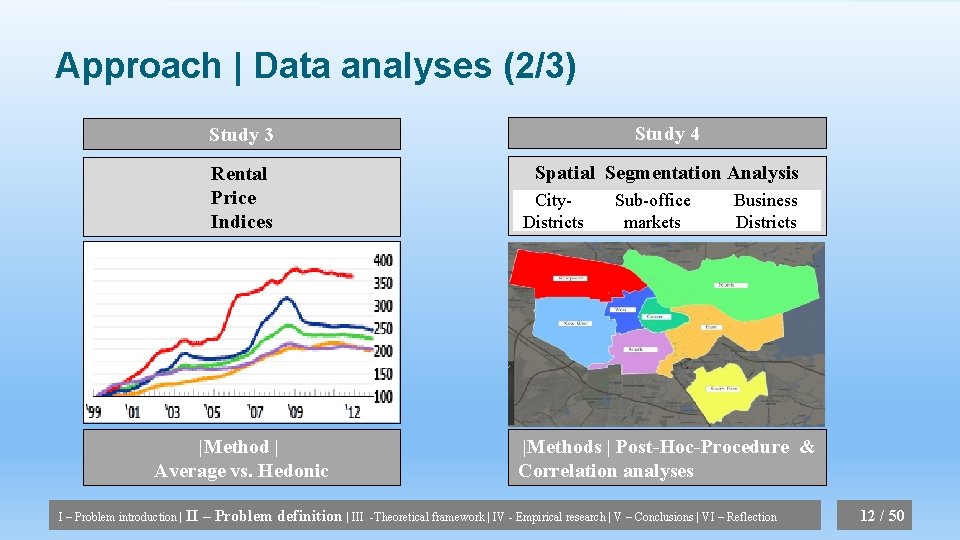
Approach | Data analyses (2/3) Study 3 Study 4 Rental Price Indices Spatial Segmentation Analysis |Method | Average vs. Hedonic I – Problem introduction | II – Problem definition | III City. Districts Sub-office markets Business Districts |Methods | Post-Hoc-Procedure & Correlation analyses -Theoretical framework | IV - Empirical research | V – Conclusions | VI – Reflection 12 / 50
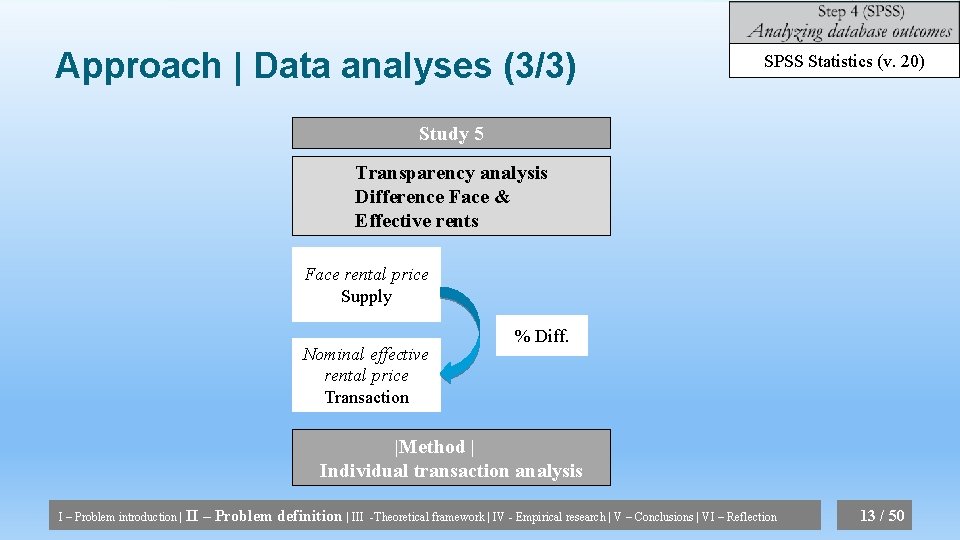
Approach | Data analyses (3/3) SPSS Statistics (v. 20) Study 5 Transparency analysis Difference Face & Effective rents Face rental price Supply Nominal effective rental price Transaction % Diff. |Method | Individual transaction analysis I – Problem introduction | II – Problem definition | III -Theoretical framework | IV - Empirical research | V – Conclusions | VI – Reflection 13 / 50
Approach I – Problem introduction | II – Problem definition | III -Theoretical framework | IV - Empirical research | V – Conclusions | VI – Reflection 14 / 50
Relevance • Societal perspective • Academic perspective • Real Estate Market I – Problem introduction | II – Problem definition | III -Theoretical framework | IV - Empirical research | V – Conclusions | VI – Reflection 15 / 50
I. Problem introduction II. Problem definition III. Theoretical framework and conclusions IV. Empirical research V. Conclusions VI. Reflection on outcomes 16 / 50
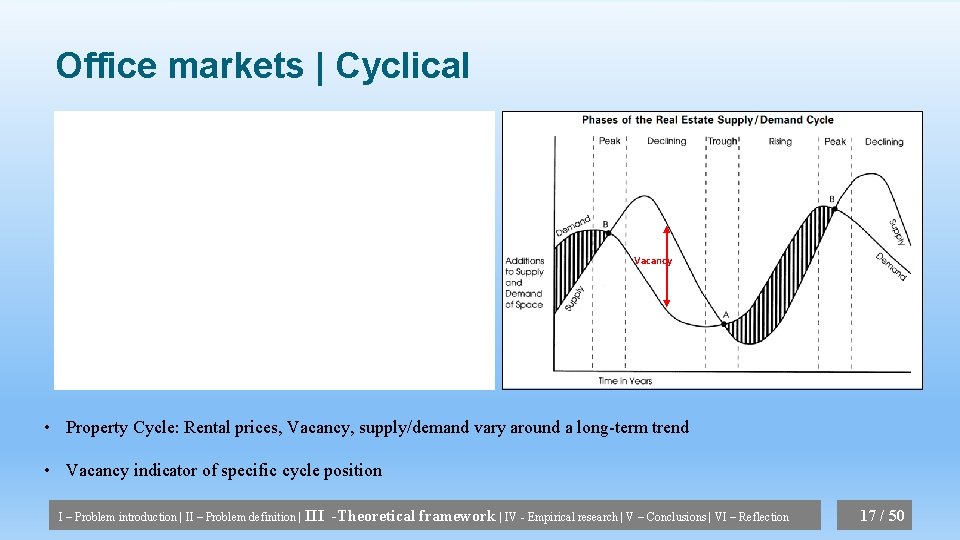
Office markets | Cyclical Vacancy • Property Cycle: Rental prices, Vacancy, supply/demand vary around a long-term trend • Vacancy indicator of specific cycle position I – Problem introduction | II – Problem definition | III -Theoretical framework | IV - Empirical research | V – Conclusions | VI – Reflection 17 / 50
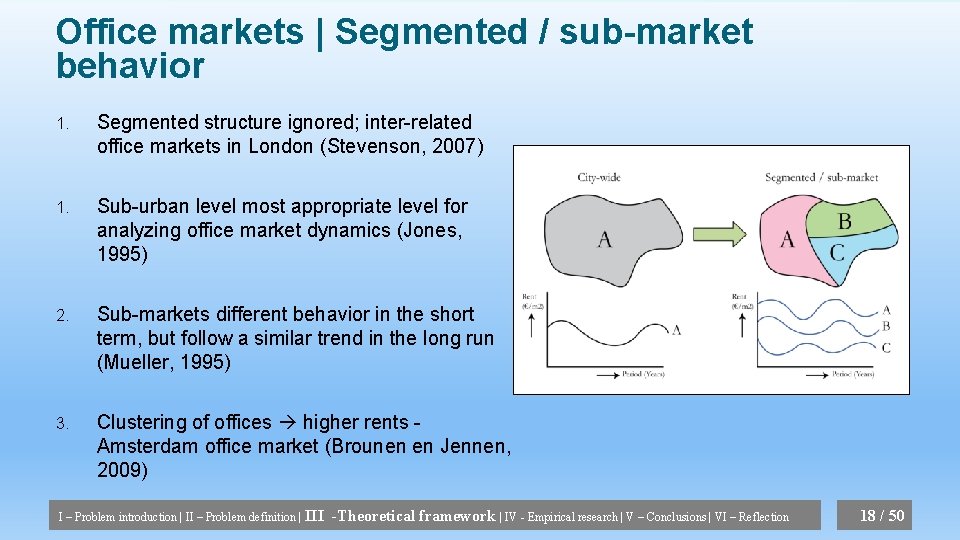
Office markets | Segmented / sub-market behavior 1. Segmented structure ignored; inter-related office markets in London (Stevenson, 2007) 1. Sub-urban level most appropriate level for analyzing office market dynamics (Jones, 1995) 2. Sub-markets different behavior in the short term, but follow a similar trend in the long run (Mueller, 1995) 3. Clustering of offices higher rents Amsterdam office market (Brounen en Jennen, 2009) I – Problem introduction | II – Problem definition | III -Theoretical framework | IV - Empirical research | V – Conclusions | VI – Reflection 18 / 50
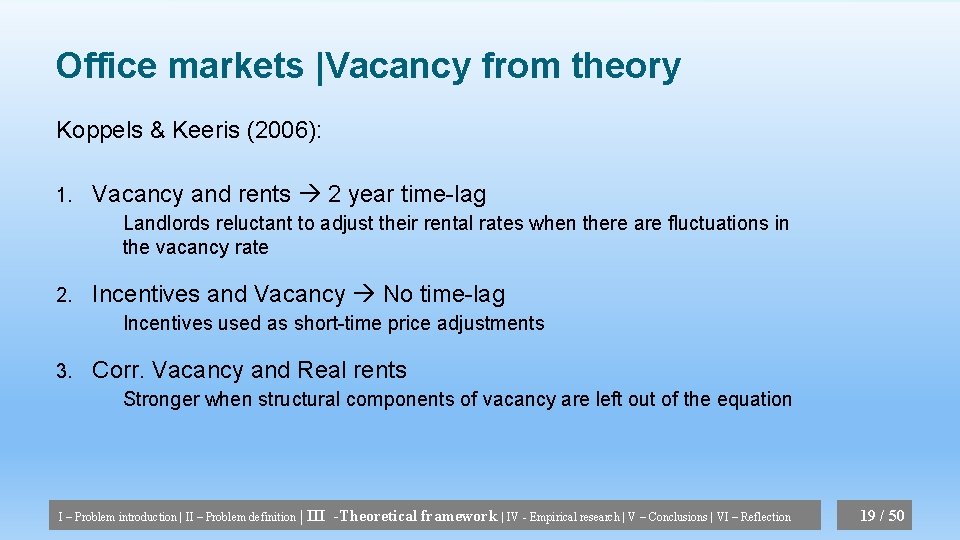
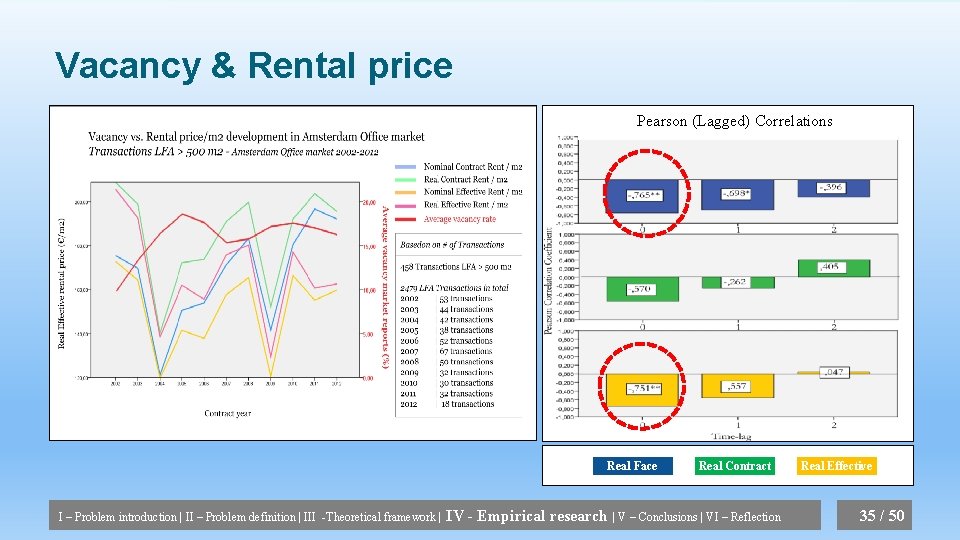
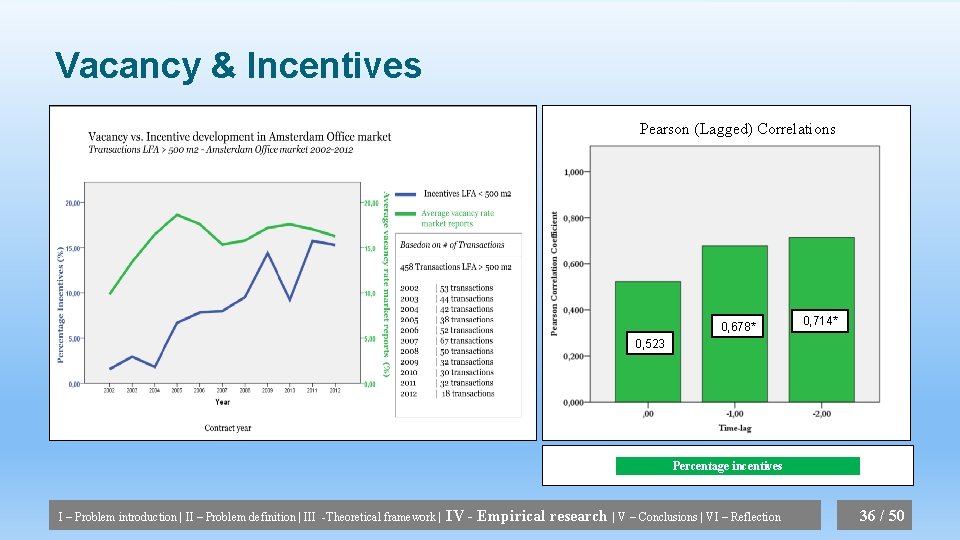
Office markets |Vacancy from theory Koppels & Keeris (2006): 1. Vacancy and rents 2 year time-lag Landlords reluctant to adjust their rental rates when there are fluctuations in the vacancy rate 2. Incentives and Vacancy No time-lag Incentives used as short-time price adjustments 3. Corr. Vacancy and Real rents Stronger when structural components of vacancy are left out of the equation I – Problem introduction | II – Problem definition | III -Theoretical framework | IV - Empirical research | V – Conclusions | VI – Reflection 19 / 50
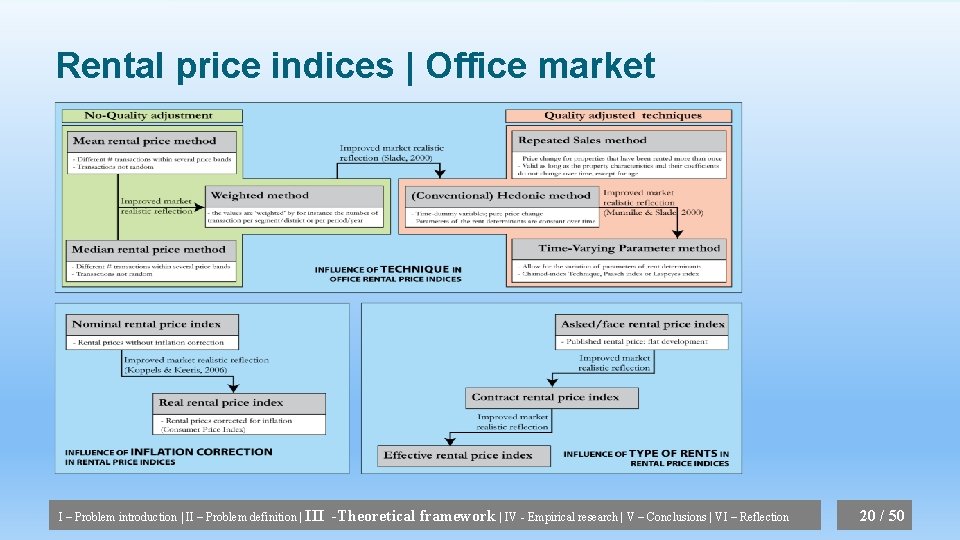
Rental price indices | Office market I – Problem introduction | II – Problem definition | III -Theoretical framework | IV - Empirical research | V – Conclusions | VI – Reflection 20 / 50
I. Problem introduction II. Problem definition III. Theoretical framework and conclusions IV. Empirical research V. Conclusions VI. Reflection on outcomes 21 / 50
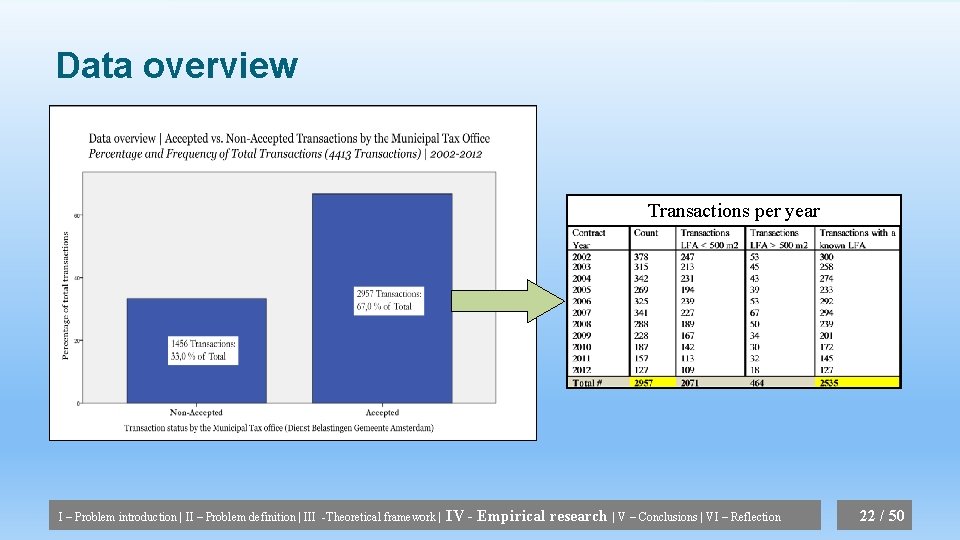
Data overview Transactions per year I – Problem introduction | II – Problem definition | III -Theoretical framework | IV - Empirical research | V – Conclusions | VI – Reflection 22 / 50
Study 1 | Average Incentive and Rental price development & market comparison I – Problem introduction | II – Problem definition | III -Theoretical framework | IV - Empirical research | V – Conclusions | VI – Reflection 23/ 50
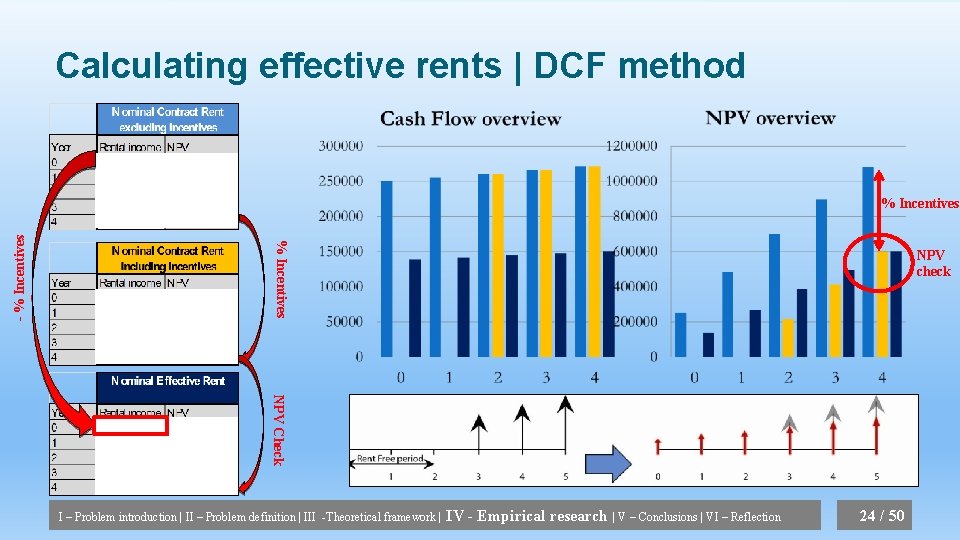
Calculating effective rents | DCF method % Incentives - % Incentives NPV check NPV Check I – Problem introduction | II – Problem definition | III -Theoretical framework | IV - Empirical research | V – Conclusions | VI – Reflection 24 / 50
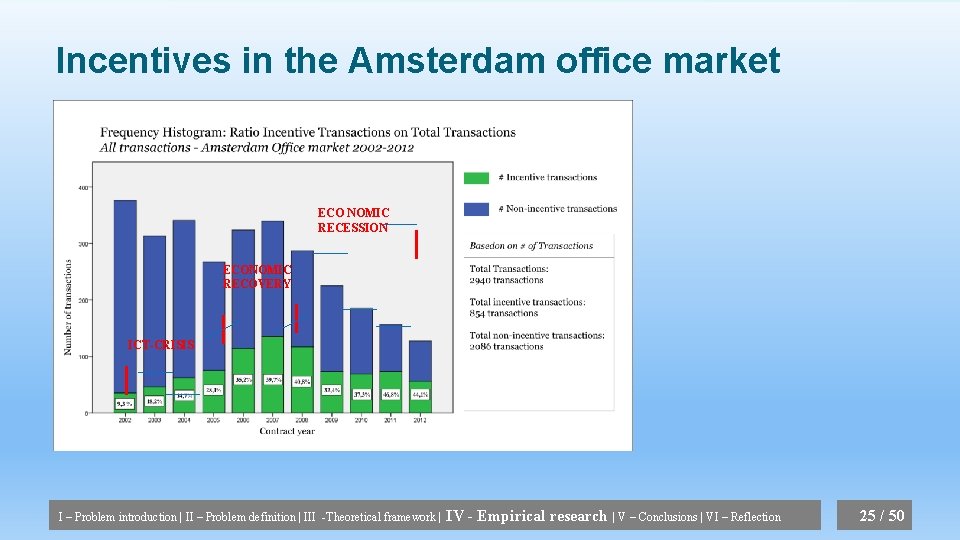
Incentives in the Amsterdam office market ECO NOMIC RECESSION ECONOMIC RECOVERY ICT-CRISIS I – Problem introduction | II – Problem definition | III -Theoretical framework | IV - Empirical research | V – Conclusions | VI – Reflection 25 / 50
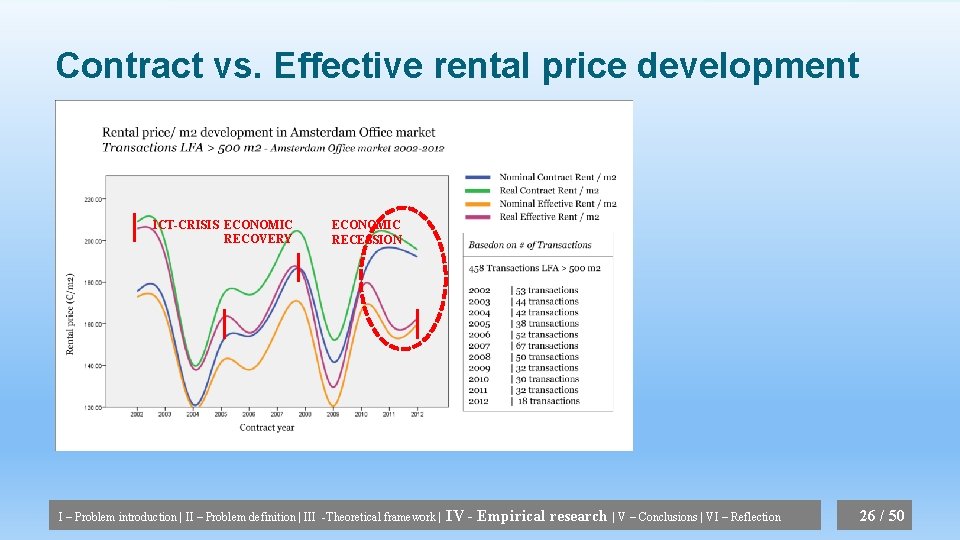
Contract vs. Effective rental price development ICT-CRISIS ECONOMIC RECOVERY ECONOMIC RECESSION I – Problem introduction | II – Problem definition | III -Theoretical framework | IV - Empirical research | V – Conclusions | VI – Reflection 26 / 50
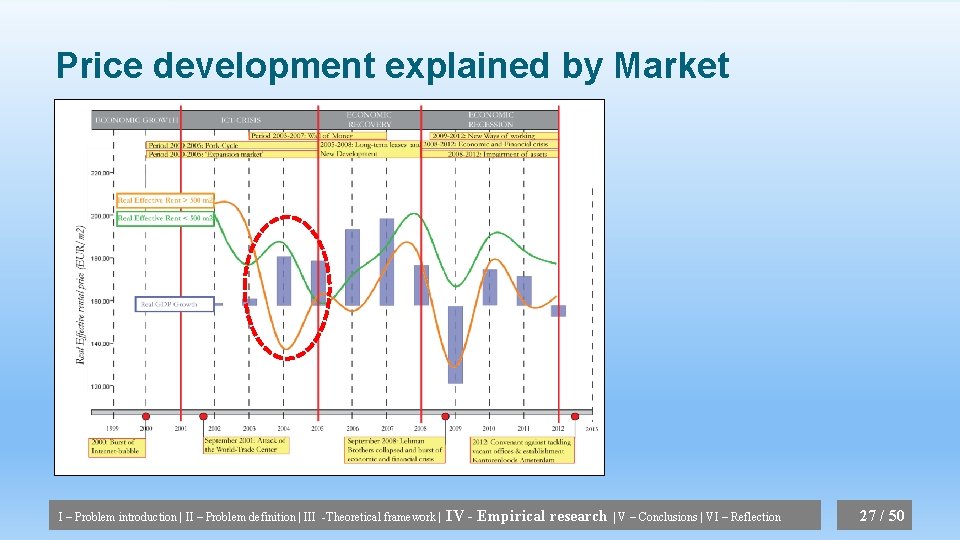
Price development explained by Market I – Problem introduction | II – Problem definition | III -Theoretical framework | IV - Empirical research | V – Conclusions | VI – Reflection 27 / 50
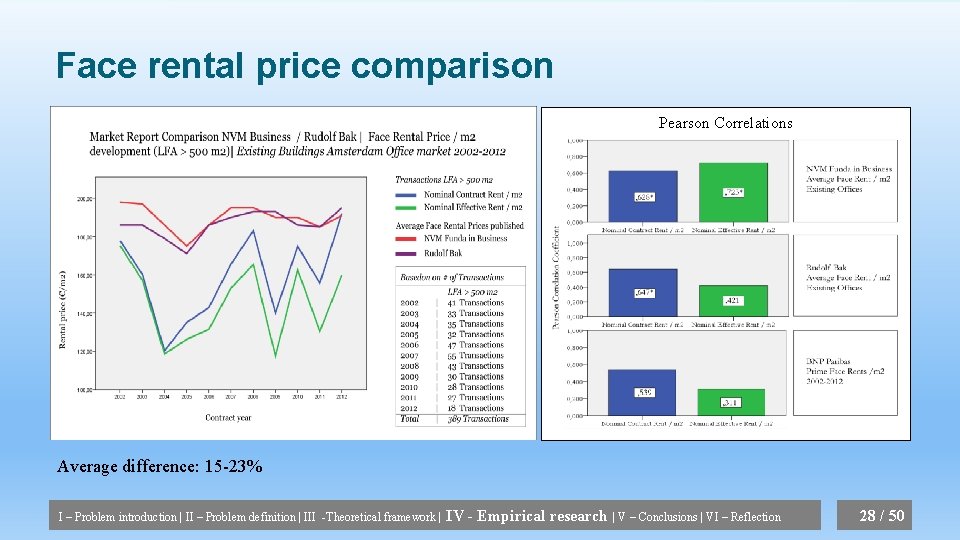
Face rental price comparison Pearson Correlations Average difference: 15 -23% I – Problem introduction | II – Problem definition | III -Theoretical framework | IV - Empirical research | V – Conclusions | VI – Reflection 28 / 50
Study 2 | Rental price indices I – Problem introduction | II – Problem definition | III -Theoretical framework | IV - Empirical research | V – Conclusions | VI – Reflection 29 / 50
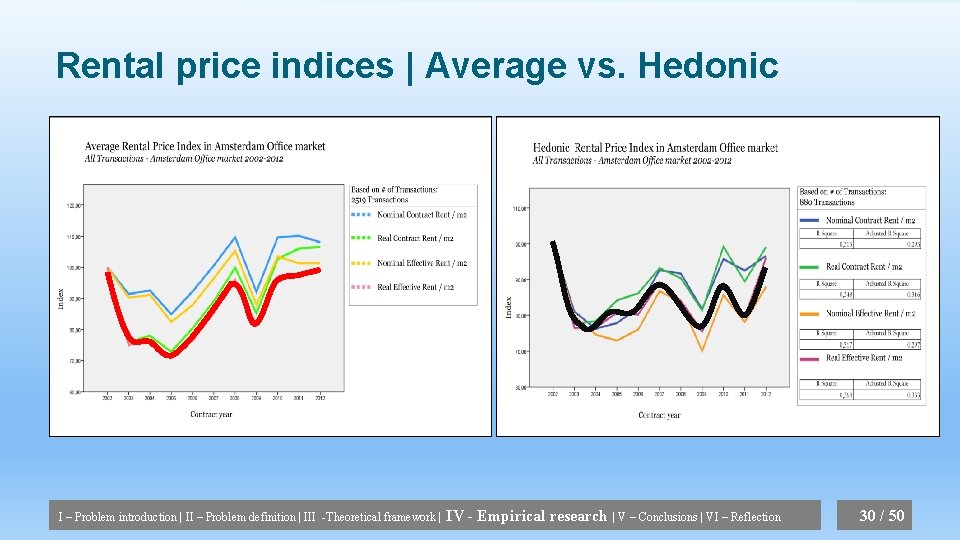
Rental price indices | Average vs. Hedonic I – Problem introduction | II – Problem definition | III -Theoretical framework | IV - Empirical research | V – Conclusions | VI – Reflection 30 / 50
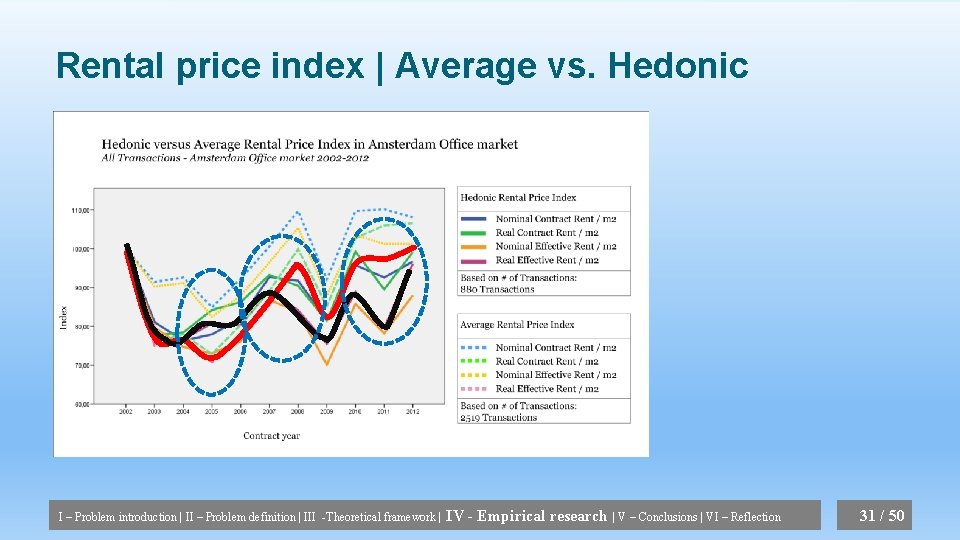
Rental price index | Average vs. Hedonic I – Problem introduction | II – Problem definition | III -Theoretical framework | IV - Empirical research | V – Conclusions | VI – Reflection 31 / 50
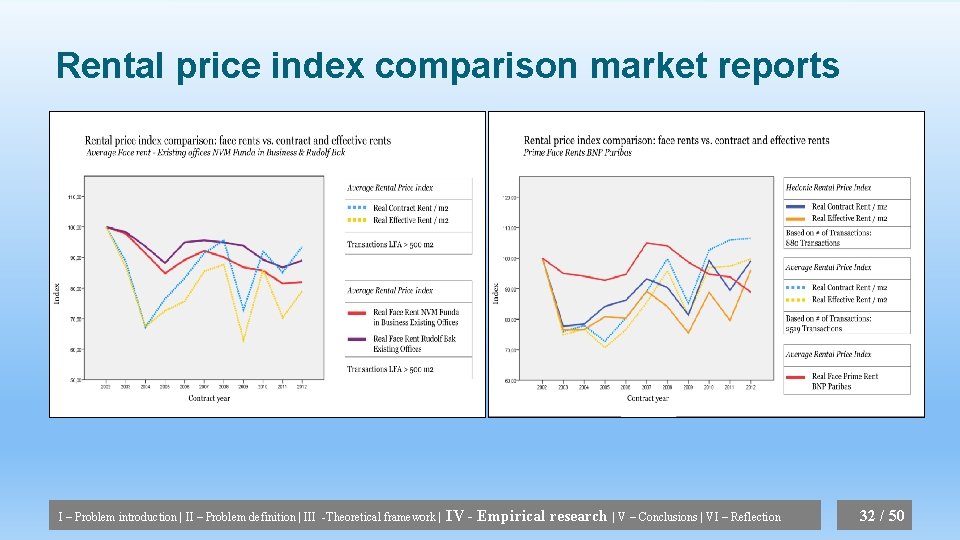
Rental price index comparison market reports I – Problem introduction | II – Problem definition | III -Theoretical framework | IV - Empirical research | V – Conclusions | VI – Reflection 32 / 50
Study 3| Testing relations between variables I – Problem introduction | II – Problem definition | III -Theoretical framework | IV - Empirical research | V – Conclusions | VI – Reflection 33/ 63
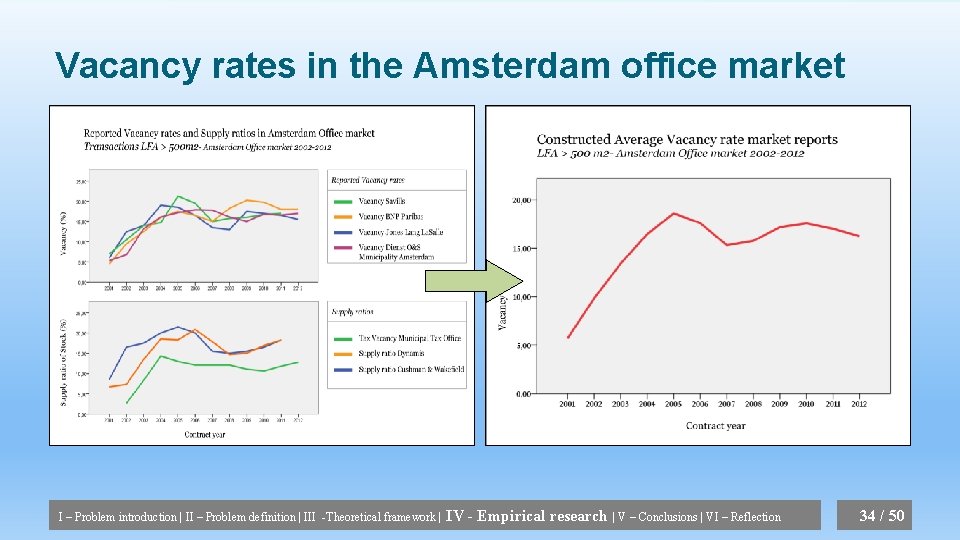
Vacancy rates in the Amsterdam office market I – Problem introduction | II – Problem definition | III -Theoretical framework | IV - Empirical research | V – Conclusions | VI – Reflection 34 / 50
Vacancy & Rental price Pearson (Lagged) Correlations Real Face I – Problem introduction | II – Problem definition | III -Theoretical framework | Real Contract IV - Empirical research | V – Conclusions | VI – Reflection Real Effective 35 / 50
Vacancy & Incentives Pearson (Lagged) Correlations 0, 678* 0, 714* 0, 523 Percentage incentives I – Problem introduction | II – Problem definition | III -Theoretical framework | IV - Empirical research | V – Conclusions | VI – Reflection 36 / 50
Study 4: Spatial Segmentation analysis I – Problem introduction | II – Problem definition | III -Theoretical framework | IV - Empirical research | V – Conclusions | VI – Reflection 37 / 50
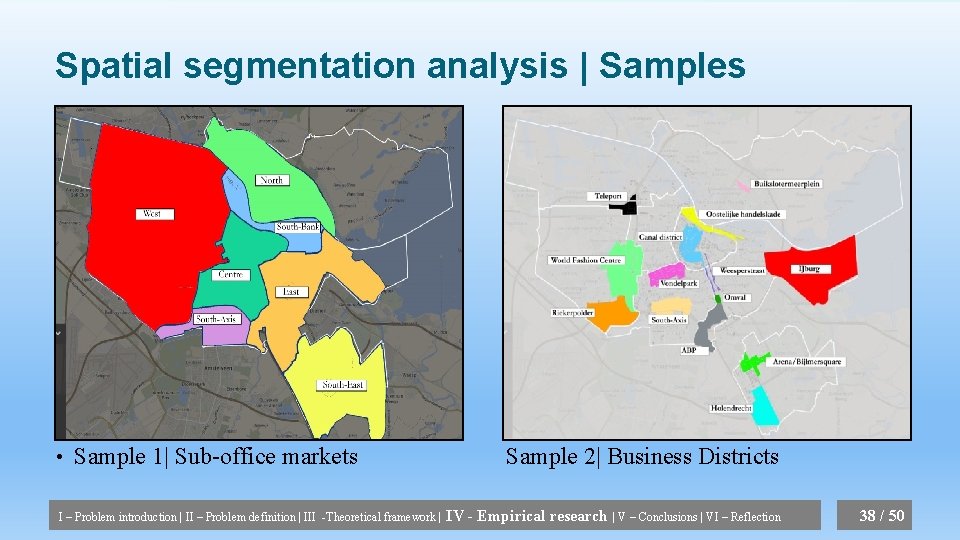
Spatial segmentation analysis | Samples • Sample 1| Sub-office markets I – Problem introduction | II – Problem definition | III -Theoretical framework | Sample 2| Business Districts IV - Empirical research | V – Conclusions | VI – Reflection 38 / 50
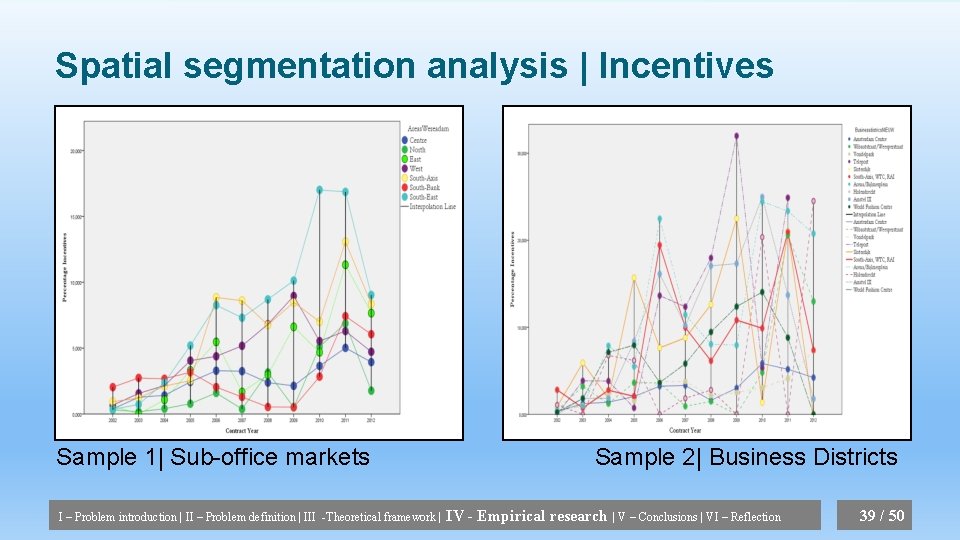
Spatial segmentation analysis | Incentives Sample 1| Sub-office markets I – Problem introduction | II – Problem definition | III -Theoretical framework | Sample 2| Business Districts IV - Empirical research | V – Conclusions | VI – Reflection 39 / 50
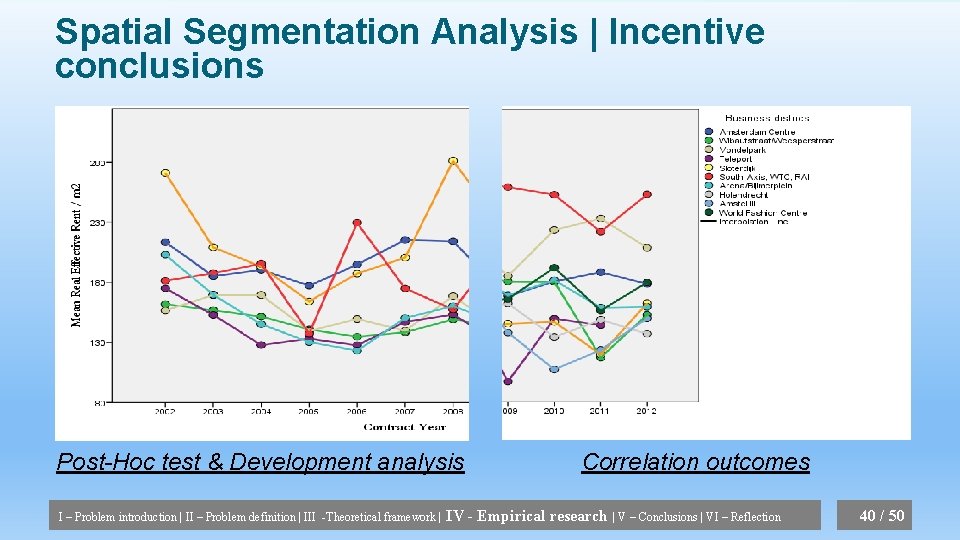
Spatial Segmentation Analysis | Incentive conclusions Post-Hoc test & Development analysis I – Problem introduction | II – Problem definition | III -Theoretical framework | Correlation outcomes IV - Empirical research | V – Conclusions | VI – Reflection 40 / 50
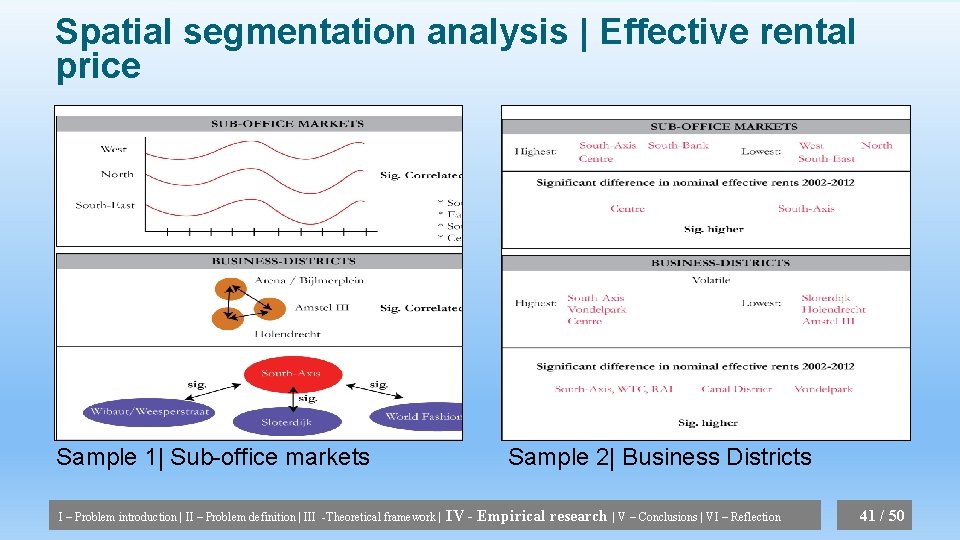
Spatial segmentation analysis | Effective rental price Sample 1| Sub-office markets I – Problem introduction | II – Problem definition | III -Theoretical framework | Sample 2| Business Districts IV - Empirical research | V – Conclusions | VI – Reflection 41 / 50
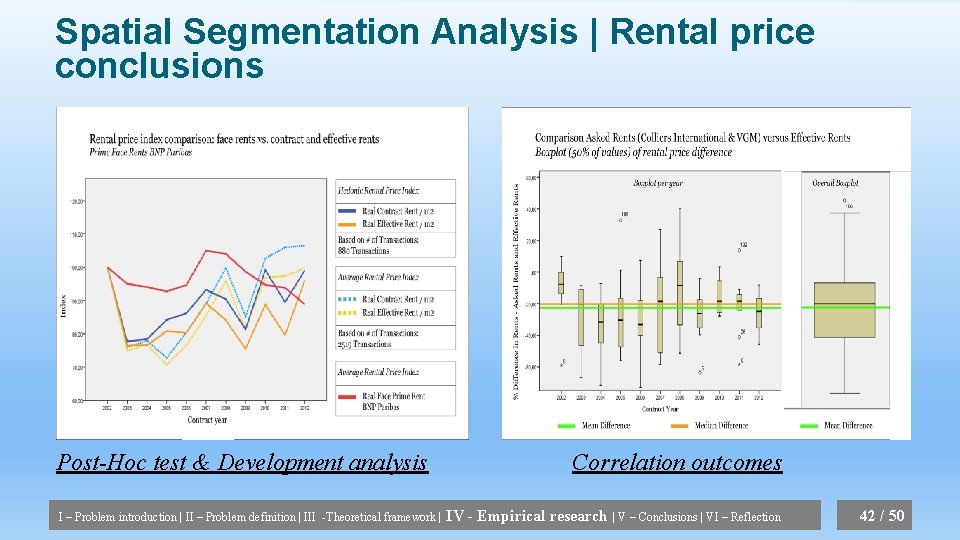
Spatial Segmentation Analysis | Rental price conclusions Post-Hoc test & Development analysis I – Problem introduction | II – Problem definition | III -Theoretical framework | Correlation outcomes IV - Empirical research | V – Conclusions | VI – Reflection 42 / 50
Study 5: “Transparency” analysis I – Problem introduction | II – Problem definition | III -Theoretical framework | IV - Empirical research | V – Conclusions | VI – Reflection 43 / 50
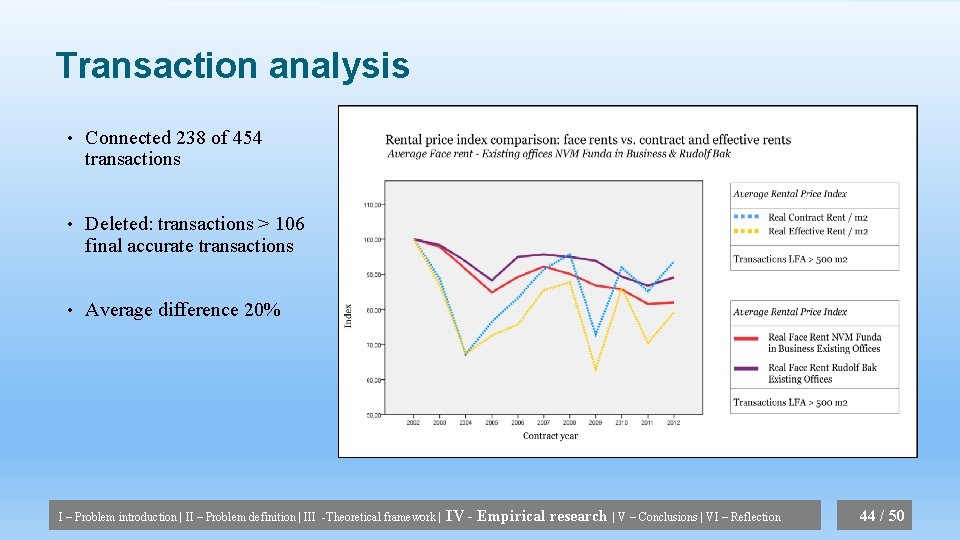
Transaction analysis • Connected 238 of 454 transactions • Deleted: transactions > 106 final accurate transactions • Average difference 20% I – Problem introduction | II – Problem definition | III -Theoretical framework | IV - Empirical research | V – Conclusions | VI – Reflection 44 / 50
I. Problem introduction II. Problem definition III. Theoretical framework and conclusions IV. Empirical research V. Conclusions VI. Reflection on outcomes 45 / 50
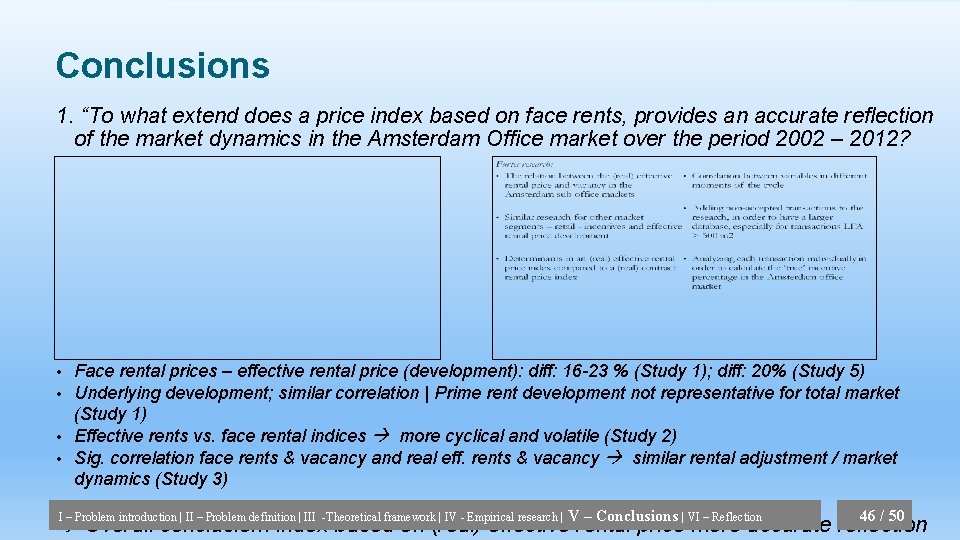
Conclusions 1. “To what extend does a price index based on face rents, provides an accurate reflection of the market dynamics in the Amsterdam Office market over the period 2002 – 2012? Face rental prices – effective rental price (development): diff: 16 -23 % (Study 1); diff: 20% (Study 5) Underlying development; similar correlation | Prime rent development not representative for total market (Study 1) • Effective rents vs. face rental indices more cyclical and volatile (Study 2) • Sig. correlation face rents & vacancy and real eff. rents & vacancy similar rental adjustment / market dynamics (Study 3) • • I – Problem introduction | II – Problem definition | III -Theoretical framework | IV - Empirical research | V – Conclusions | VI – Reflection 46 / 50 Overall conclusion: index based on (real) effective rental price more accurate reflection
Conclusions 2. “Do spatial market segments differentiate in market dynamics in the Amsterdam office market over the period 2002 -2012? ” Incentives : - Significant different in height No market segmentation in development; similar correlation in incentive development Surrounding business districts correlated; Centre / Sloterdijk Effective rental price: - Significant differences in height sub-office and business districts (nominal) Yes, partial market segmentation in development (Stevenson, 2007) West, North and South-East correlated Surrounding business districts in City-district South-East correlated I – Problem introduction | II – Problem definition | III -Theoretical framework | IV - Empirical research | V – Conclusions | VI – Reflection 47 / 50
I. Problem introduction II. Problem definition III. Theoretical framework and conclusions IV. Empirical research V. Conclusions VI. Reflection on outcomes 48 /50
Reflection on outcomes • Overall: Database limitations – Only Accepted – 1/5 th transactions: 450 ; LFA > 500 m 2 • Study 1: % Incentives and effective rental price – Higher incentives? – Market comparison; few transactions • • Rental adjustment equation: stronger correlation with real effective rents; possible explanations: • Small amount of transactions LFA > 500 m 2 • Vacancy existing offices instead of entire market • Current scale level not most appropriate Study 4: Spatial segmentation • No diff. above and below 500 m 2 • Post-Hoc only diff. between some variables Study 2: Hedonic price index – Low R Square (max. 0, 33) in research – Cyclicality and market realistic reflection might change in more accurate model • Study 5: Face and effective rental price • Study 3: Vacancy & Rents - Only 106 transactions; unsure whether transactions are well-connected • Other vacancy rates; different outcomes - Only indication of total difference • No difference from natural vacancy used • I – Problem introduction | II – Problem definition | III -Theoretical framework | IV - Empirical research | V – Conclusions | VI – Reflection 49 / 50
Questions & Answers? I – Problem introduction | II – Problem definition | III -Theoretical framework | IV - Empirical research | V – Conclusions | VI – Reflection 50 / 50
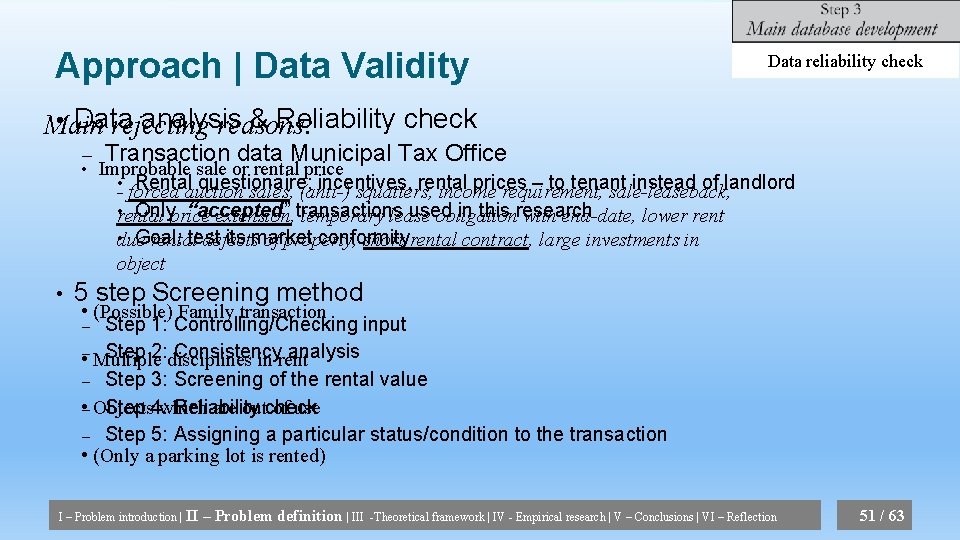
Approach | Data Validity Data reliability check • Data analysis & Reliability check Main rejecting reasons: – • • Transaction data Municipal Tax Office Improbable sale or rental price • Rental questionaire; incentives, rental prices – to tenant instead of landlord - forced auction sales, (anti-) squatters, income requirement, sale-leaseback, • rental Onlyprice “accepted” used in this research extension, transactions temporary lease obligation with end-date, lower rent • due Goal: test its market conformity rental defects of property, short rental contract, large investments in object 5 step Screening method • (Possible) Family transaction – Step 1: Controlling/Checking input Step 2: disciplines Consistency analysis • – Multiple in rent – Step 3: Screening of the rental value Step 4: which Reliability • – Objects are outcheck of use – Step 5: Assigning a particular status/condition to the transaction • (Only a parking lot is rented) I – Problem introduction | II – Problem definition | III -Theoretical framework | IV - Empirical research | V – Conclusions | VI – Reflection 51 / 63
Recommendations for further research I – Problem introduction | II – Problem definition | III -Theoretical framework | IV - Empirical research | V – Conclusions | VI – Reflection 52 / 63