Intermediate Accounting Seventeenth Edition Kieso Weygandt Warfield Chapter
- Slides: 75
Intermediate Accounting Seventeenth Edition Kieso ● Weygandt ● Warfield Chapter 11 Depreciation, Impairments, and Depletion This slide deck contains animations. Please disable animations if they cause issues with your device.
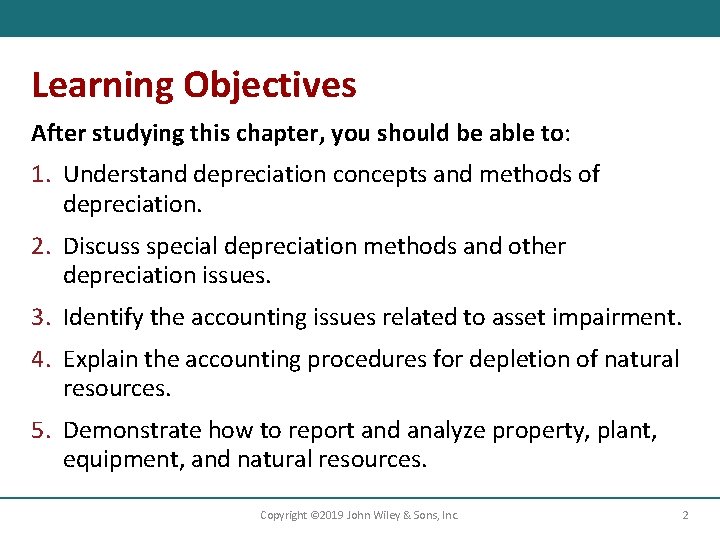
Learning Objectives After studying this chapter, you should be able to: 1. Understand depreciation concepts and methods of depreciation. 2. Discuss special depreciation methods and other depreciation issues. 3. Identify the accounting issues related to asset impairment. 4. Explain the accounting procedures for depletion of natural resources. 5. Demonstrate how to report and analyze property, plant, equipment, and natural resources. Copyright © 2019 John Wiley & Sons, Inc. 2
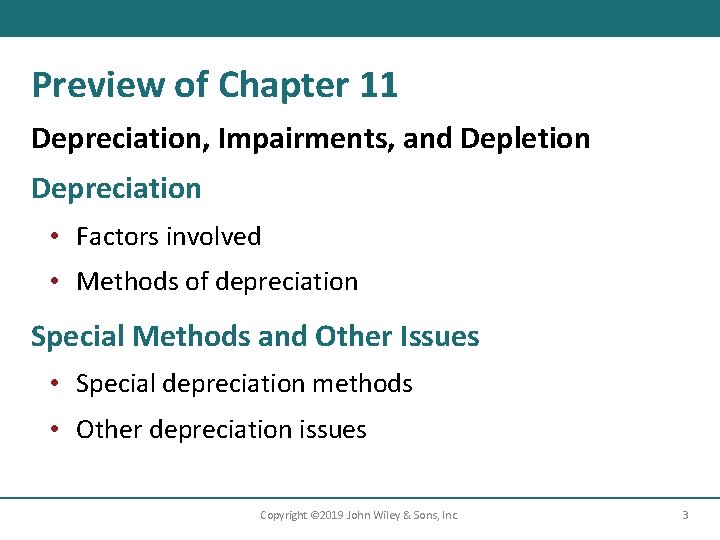
Preview of Chapter 11 Depreciation, Impairments, and Depletion Depreciation • Factors involved • Methods of depreciation Special Methods and Other Issues • Special depreciation methods • Other depreciation issues Copyright © 2019 John Wiley & Sons, Inc. 3
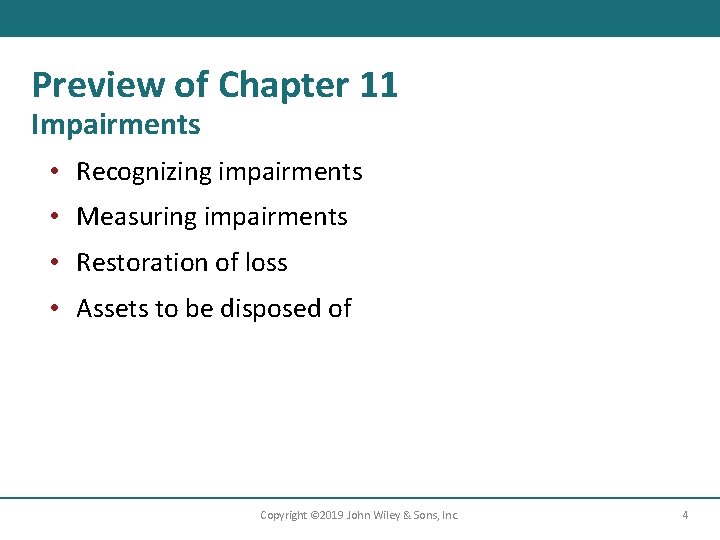
Preview of Chapter 11 Impairments • Recognizing impairments • Measuring impairments • Restoration of loss • Assets to be disposed of Copyright © 2019 John Wiley & Sons, Inc. 4
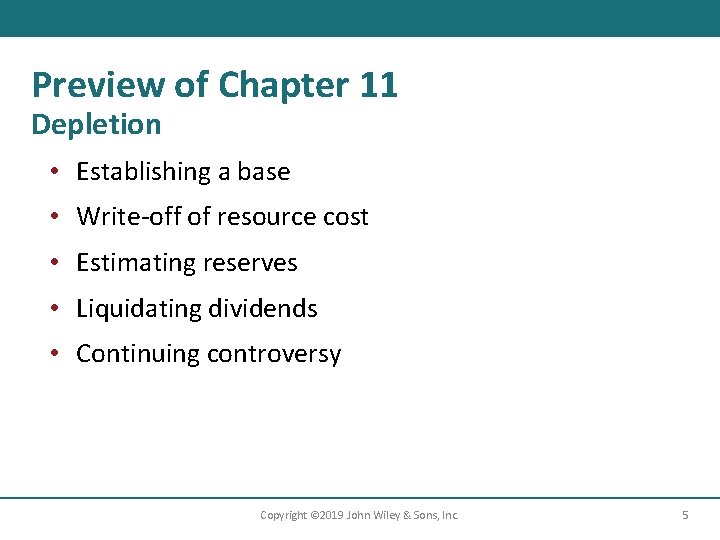
Preview of Chapter 11 Depletion • Establishing a base • Write-off of resource cost • Estimating reserves • Liquidating dividends • Continuing controversy Copyright © 2019 John Wiley & Sons, Inc. 5
Preview of Chapter 11 Presentation and Analysis • Presentation • Analysis Copyright © 2019 John Wiley & Sons, Inc. 6
Learning Objective 1 Describe Depreciation Concepts and Methods of Depreciation LO 1 Copyright © 2019 John Wiley & Sons, Inc. 7
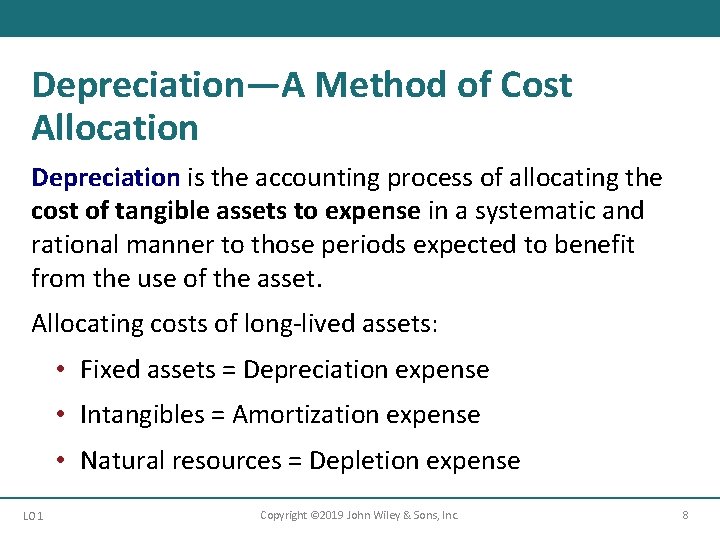
Depreciation—A Method of Cost Allocation Depreciation is the accounting process of allocating the cost of tangible assets to expense in a systematic and rational manner to those periods expected to benefit from the use of the asset. Allocating costs of long-lived assets: • Fixed assets = Depreciation expense • Intangibles = Amortization expense • Natural resources = Depletion expense LO 1 Copyright © 2019 John Wiley & Sons, Inc. 8
Factors Involved in the Depreciation Process Three basic questions: 1) What depreciable base is to be used? 2) What is the asset’s useful life? 3) What method of cost apportionment is best for this asset? LO 1 Copyright © 2019 John Wiley & Sons, Inc. 9
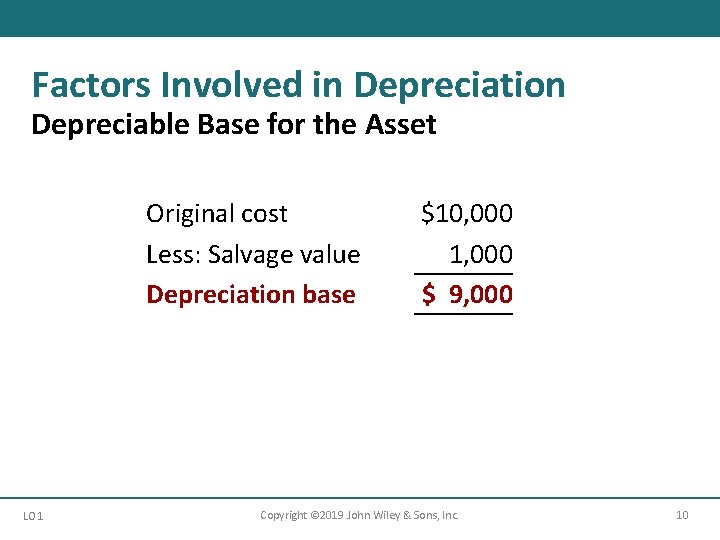
Factors Involved in Depreciation Depreciable Base for the Asset Original cost Less: Salvage value Depreciation base LO 1 $10, 000 1, 000 $ 9, 000 Copyright © 2019 John Wiley & Sons, Inc. 10
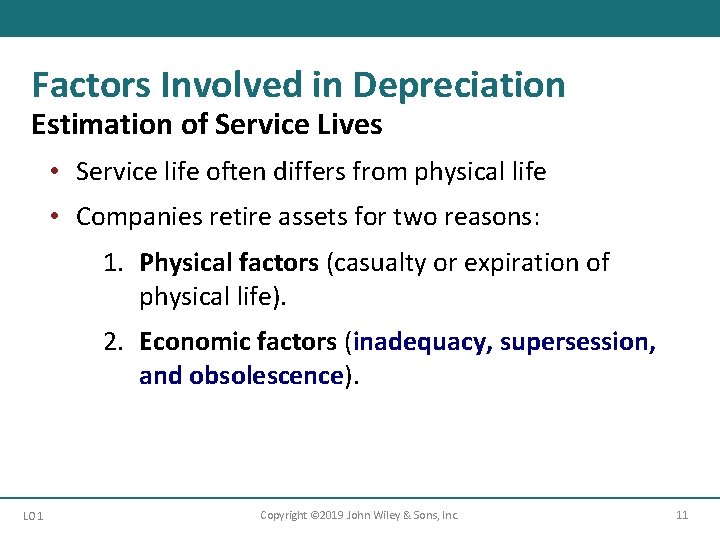
Factors Involved in Depreciation Estimation of Service Lives • Service life often differs from physical life • Companies retire assets for two reasons: 1. Physical factors (casualty or expiration of physical life). 2. Economic factors (inadequacy, supersession, and obsolescence). LO 1 Copyright © 2019 John Wiley & Sons, Inc. 11
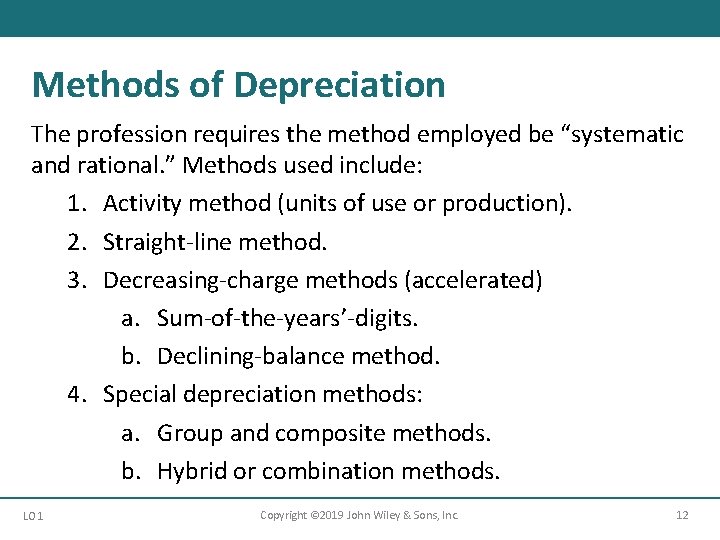
Methods of Depreciation The profession requires the method employed be “systematic and rational. ” Methods used include: 1. Activity method (units of use or production). 2. Straight-line method. 3. Decreasing-charge methods (accelerated) a. Sum-of-the-years’-digits. b. Declining-balance method. 4. Special depreciation methods: a. Group and composite methods. b. Hybrid or combination methods. LO 1 Copyright © 2019 John Wiley & Sons, Inc. 12
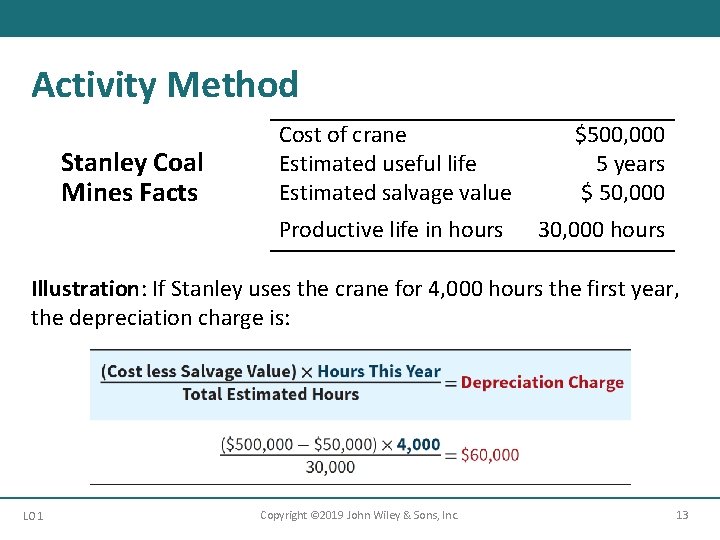
Activity Method Stanley Coal Mines Facts Cost of crane Estimated useful life Estimated salvage value Productive life in hours $500, 000 5 years $ 50, 000 30, 000 hours Illustration: If Stanley uses the crane for 4, 000 hours the first year, the depreciation charge is: LO 1 Copyright © 2019 John Wiley & Sons, Inc. 13
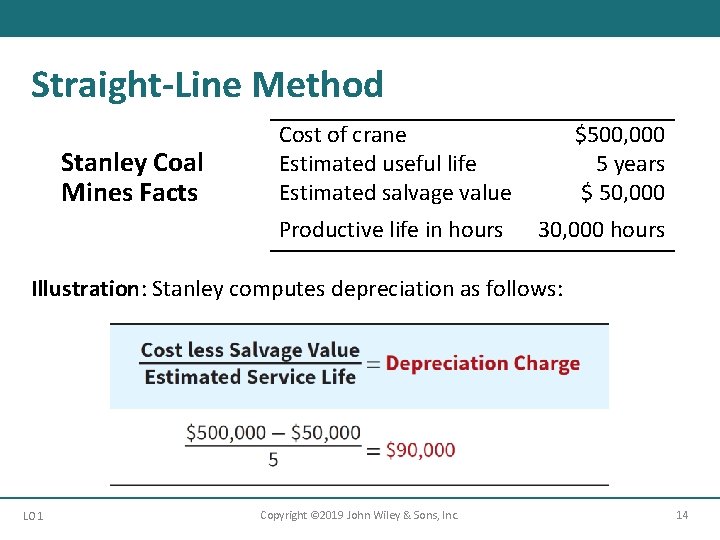
Straight-Line Method Stanley Coal Mines Facts Cost of crane Estimated useful life Estimated salvage value Productive life in hours $500, 000 5 years $ 50, 000 30, 000 hours Illustration: Stanley computes depreciation as follows: LO 1 Copyright © 2019 John Wiley & Sons, Inc. 14
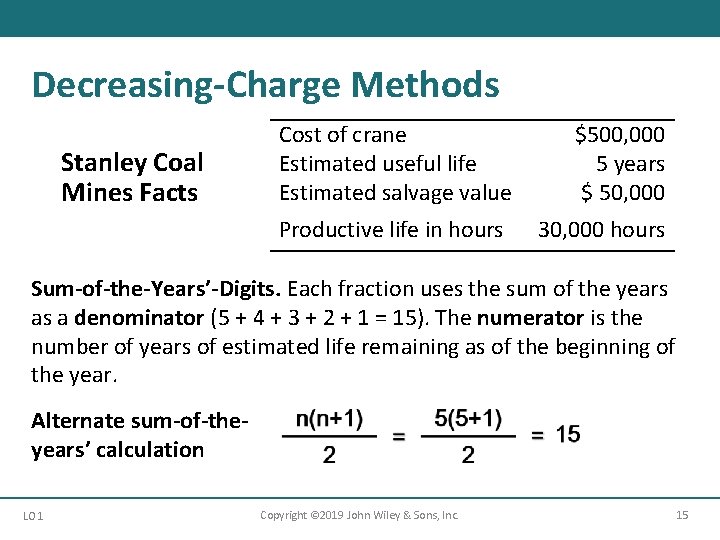
Decreasing-Charge Methods Stanley Coal Mines Facts Cost of crane Estimated useful life Estimated salvage value Productive life in hours $500, 000 5 years $ 50, 000 30, 000 hours Sum-of-the-Years’-Digits. Each fraction uses the sum of the years as a denominator (5 + 4 + 3 + 2 + 1 = 15). The numerator is the number of years of estimated life remaining as of the beginning of the year. Alternate sum-of-theyears’ calculation LO 1 Copyright © 2019 John Wiley & Sons, Inc. 15
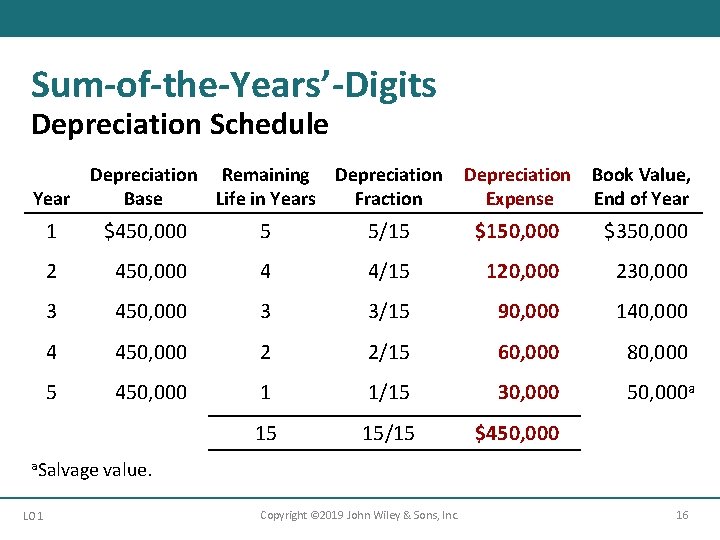
Sum-of-the-Years’-Digits Depreciation Schedule Year Depreciation Remaining Depreciation Base Life in Years Fraction Depreciation Expense Book Value, End of Year 1 $450, 000 5 5/15 $150, 000 $350, 000 2 450, 000 4 4/15 120, 000 230, 000 3 450, 000 3 3/15 90, 000 140, 000 4 450, 000 2 2/15 60, 000 80, 000 5 450, 000 1 1/15 30, 000 50, 000 a 15 15/15 $450, 000 a. Salvage value. LO 1 Copyright © 2019 John Wiley & Sons, Inc. 16
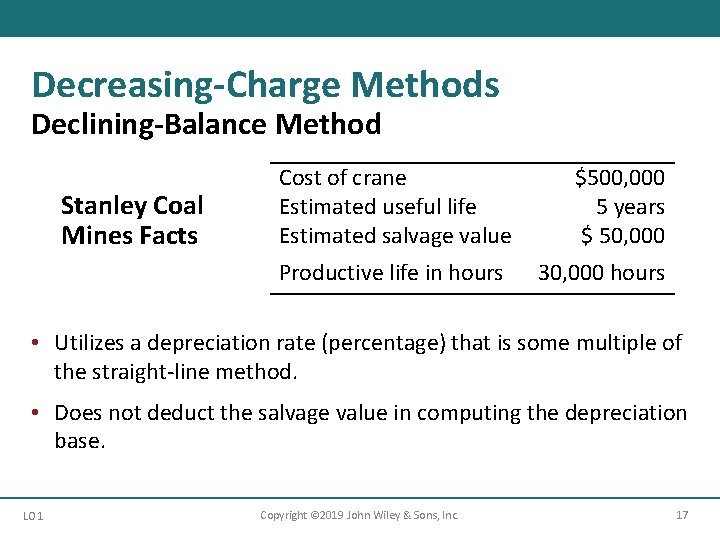
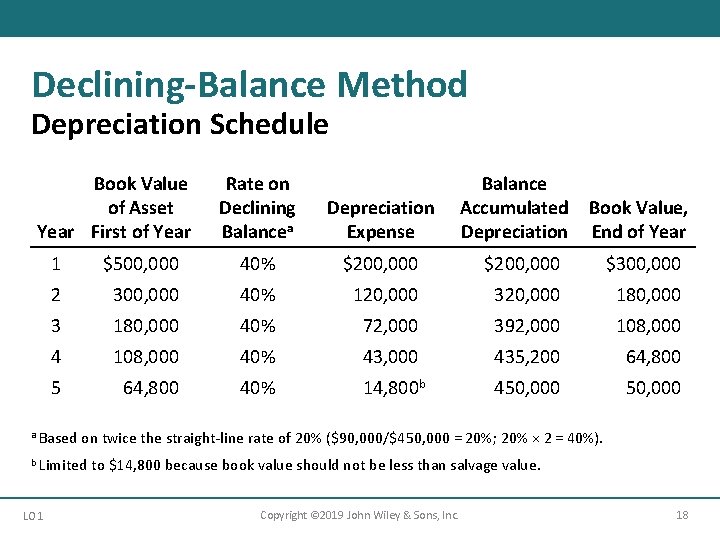
Decreasing-Charge Methods Declining-Balance Method Stanley Coal Mines Facts Cost of crane Estimated useful life Estimated salvage value Productive life in hours $500, 000 5 years $ 50, 000 30, 000 hours • Utilizes a depreciation rate (percentage) that is some multiple of the straight-line method. • Does not deduct the salvage value in computing the depreciation base. LO 1 Copyright © 2019 John Wiley & Sons, Inc. 17
Declining-Balance Method Depreciation Schedule Book Value of Asset Year First of Year Rate on Declining Balancea Depreciation Expense Balance Accumulated Depreciation Book Value, End of Year 1 $500, 000 40% $200, 000 $300, 000 2 300, 000 40% 120, 000 320, 000 180, 000 3 180, 000 40% 72, 000 392, 000 108, 000 40% 43, 000 435, 200 64, 800 5 64, 800 40% 14, 800 b 450, 000 a Based on twice the straight-line rate of 20% ($90, 000/$450, 000 = 20%; 20% × 2 = 40%). b Limited to $14, 800 because book value should not be less than salvage value. LO 1 Copyright © 2019 John Wiley & Sons, Inc. 18
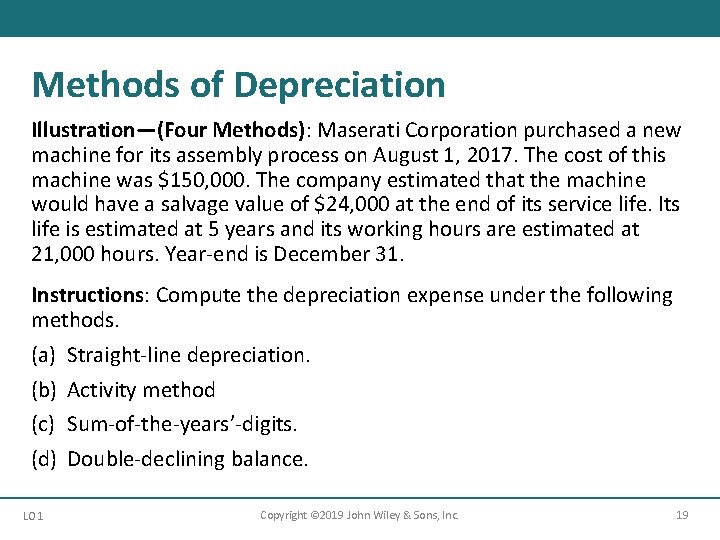
Methods of Depreciation Illustration—(Four Methods): Maserati Corporation purchased a new machine for its assembly process on August 1, 2017. The cost of this machine was $150, 000. The company estimated that the machine would have a salvage value of $24, 000 at the end of its service life. Its life is estimated at 5 years and its working hours are estimated at 21, 000 hours. Year-end is December 31. Instructions: Compute the depreciation expense under the following methods. (a) Straight-line depreciation. (b) Activity method (c) Sum-of-the-years’-digits. (d) Double-declining balance. LO 1 Copyright © 2019 John Wiley & Sons, Inc. 19
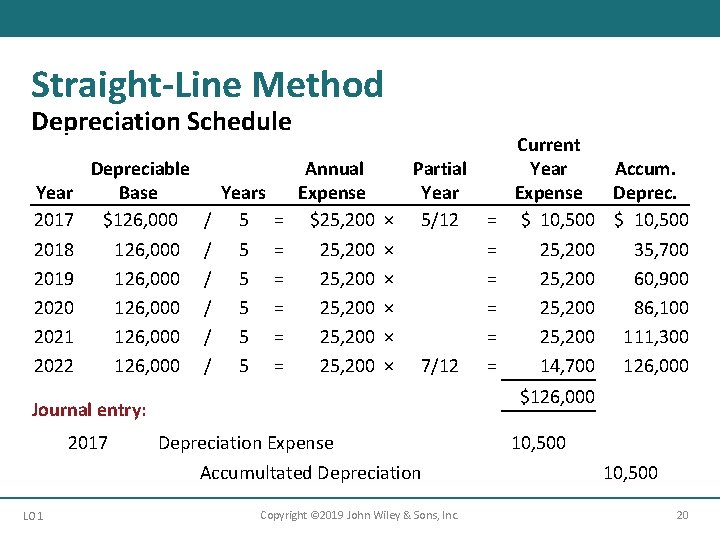
Straight-Line Method Depreciation Schedule Year 2017 2018 2019 2020 2021 2022 Depreciable Base $126, 000 126, 000 / / / Years 5 5 5 = = = Annual Partial Expense Year $25, 200 × 5/12 = 25, 200 × = 25, 200 × 7/12 = LO 1 Accum. Deprec. $ 10, 500 35, 700 60, 900 86, 100 111, 300 126, 000 $126, 000 Journal entry: 2017 Current Year Expense $ 10, 500 25, 200 14, 700 Depreciation Expense Accumultated Depreciation Copyright © 2019 John Wiley & Sons, Inc. 10, 500 20
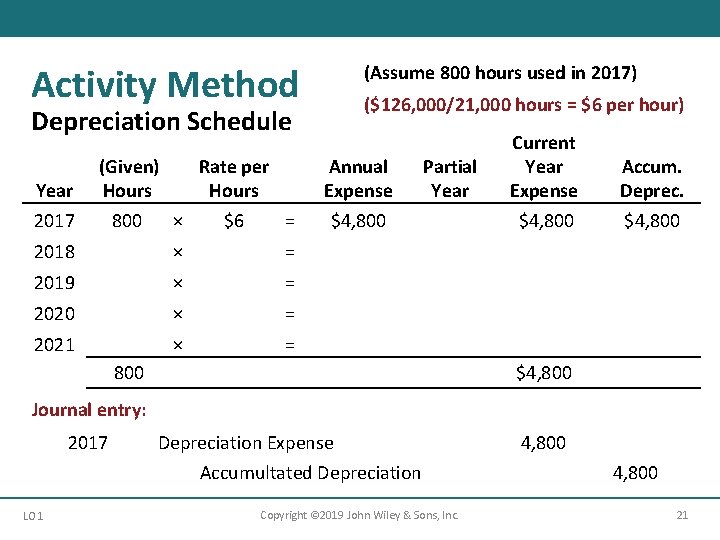
Activity Method Depreciation Schedule Year 2017 (Given) Rate per Hours 800 × $6 = 2018 × 2019 × = (Assume 800 hours used in 2017) ($126, 000/21, 000 hours = $6 per hour) Annual Expense $4, 800 Partial Year Current Year Expense $4, 800 = Accum. Deprec. $4, 800 2020 × = 2021 800 × = $4, 800 Depreciation Expense Accumultated Depreciation 4, 800 Journal entry: 2017 LO 1 Copyright © 2019 John Wiley & Sons, Inc. 4, 800 21
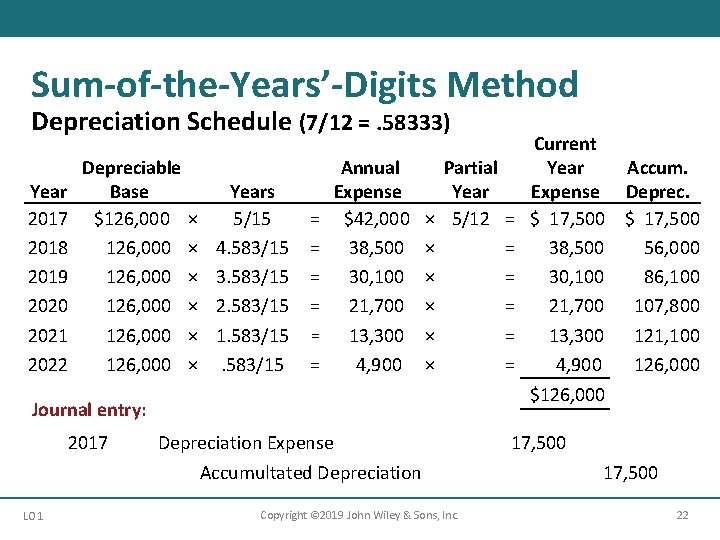
Sum-of-the-Years’-Digits Method Depreciation Schedule (7/12 =. 58333) Year 2017 2018 2019 2020 2021 2022 Depreciable Base $126, 000 126, 000 × × × Years 5/15 4. 583/15 3. 583/15 2. 583/15 1. 583/15 Annual Expense = $42, 000 = 38, 500 = 30, 100 = 21, 700 = 13, 300 = 4, 900 Partial Year × 5/12 × × × LO 1 Accum. Deprec. $ 17, 500 56, 000 86, 100 107, 800 121, 100 126, 000 $126, 000 Journal entry: 2017 = = = Current Year Expense $ 17, 500 38, 500 30, 100 21, 700 13, 300 4, 900 Depreciation Expense Accumultated Depreciation Copyright © 2019 John Wiley & Sons, Inc. 17, 500 22
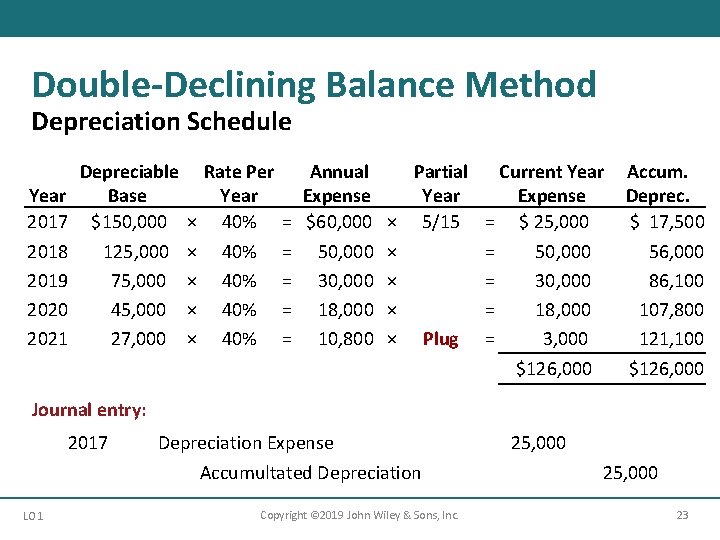
Double-Declining Balance Method Depreciation Schedule Year 2017 2018 2019 2020 2021 Depreciable Base $150, 000 125, 000 75, 000 45, 000 27, 000 × × × Rate Per Year 40% 40% 40% = = = Annual Partial Current Year Expense $60, 000 × 5/15 = $ 25, 000 50, 000 × = 50, 000 30, 000 × = 30, 000 18, 000 × = 18, 000 10, 800 × Plug = 3, 000 Accum. Deprec. $ 17, 500 56, 000 86, 100 107, 800 121, 100 $126, 000 Journal entry: 2017 LO 1 Depreciation Expense Accumultated Depreciation Copyright © 2019 John Wiley & Sons, Inc. 25, 000 23
Learning Objective 2 Discuss Special Depreciation Methods and Other Depreciation Issues LO 2 Copyright © 2019 John Wiley & Sons, Inc. 24
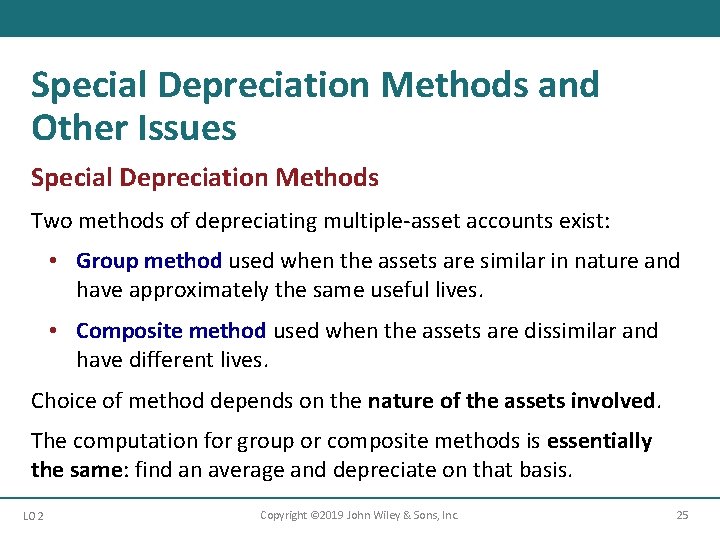
Special Depreciation Methods and Other Issues Special Depreciation Methods Two methods of depreciating multiple-asset accounts exist: • Group method used when the assets are similar in nature and have approximately the same useful lives. • Composite method used when the assets are dissimilar and have different lives. Choice of method depends on the nature of the assets involved. The computation for group or composite methods is essentially the same: find an average and depreciate on that basis. LO 2 Copyright © 2019 John Wiley & Sons, Inc. 25
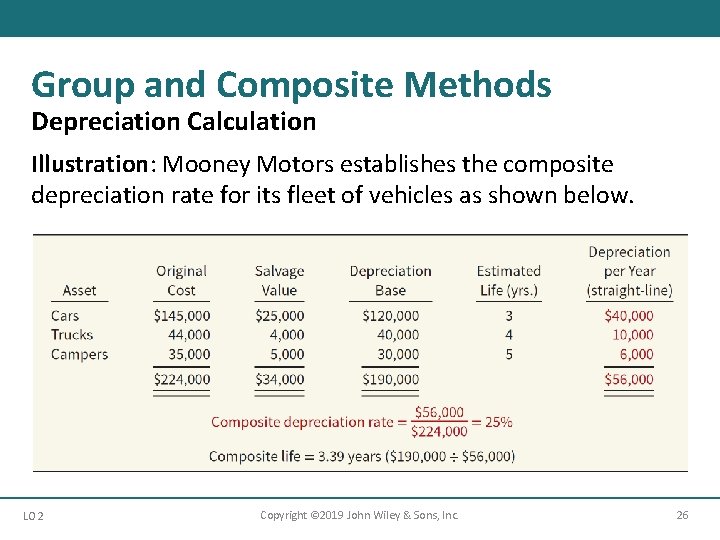
Group and Composite Methods Depreciation Calculation Illustration: Mooney Motors establishes the composite depreciation rate for its fleet of vehicles as shown below. LO 2 Copyright © 2019 John Wiley & Sons, Inc. 26
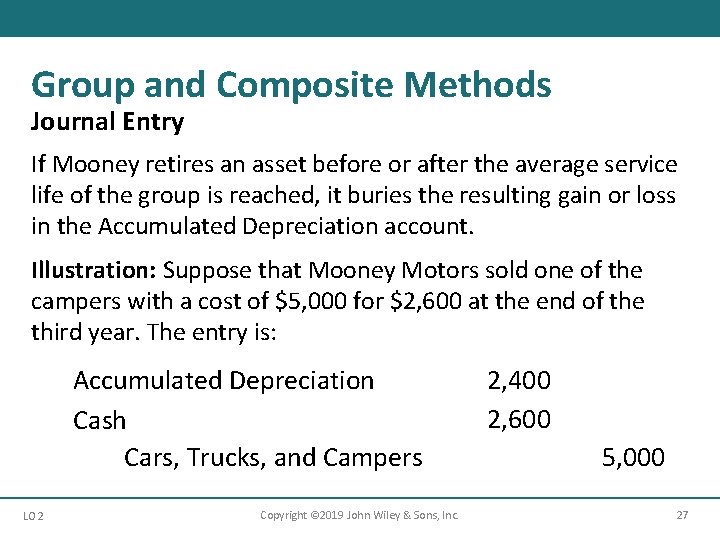
Group and Composite Methods Journal Entry If Mooney retires an asset before or after the average service life of the group is reached, it buries the resulting gain or loss in the Accumulated Depreciation account. Illustration: Suppose that Mooney Motors sold one of the campers with a cost of $5, 000 for $2, 600 at the end of the third year. The entry is: Accumulated Depreciation Cash Cars, Trucks, and Campers LO 2 Copyright © 2019 John Wiley & Sons, Inc. 2, 400 2, 600 5, 000 27
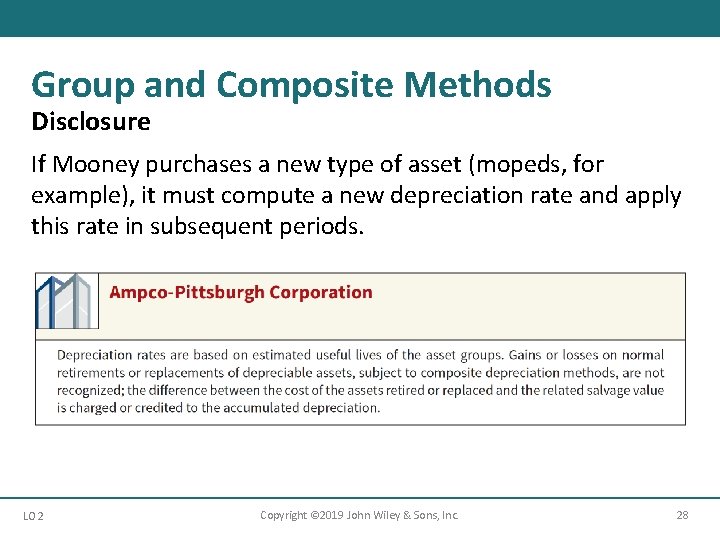
Group and Composite Methods Disclosure If Mooney purchases a new type of asset (mopeds, for example), it must compute a new depreciation rate and apply this rate in subsequent periods. LO 2 Copyright © 2019 John Wiley & Sons, Inc. 28
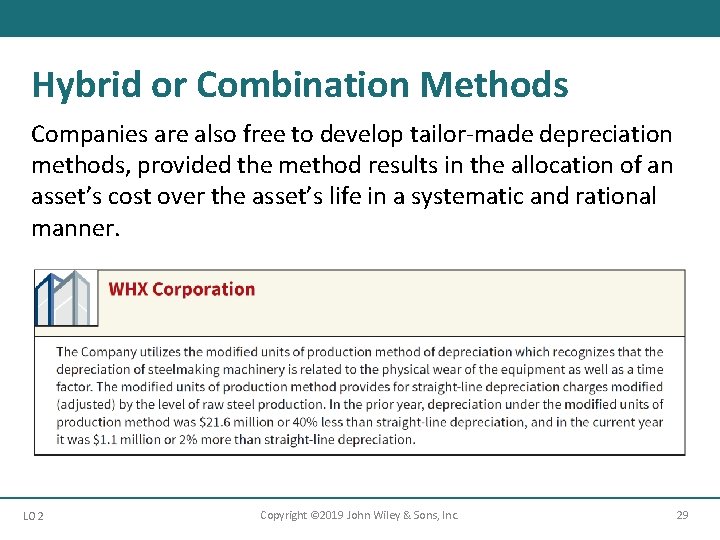
Hybrid or Combination Methods Companies are also free to develop tailor-made depreciation methods, provided the method results in the allocation of an asset’s cost over the asset’s life in a systematic and rational manner. LO 2 Copyright © 2019 John Wiley & Sons, Inc. 29
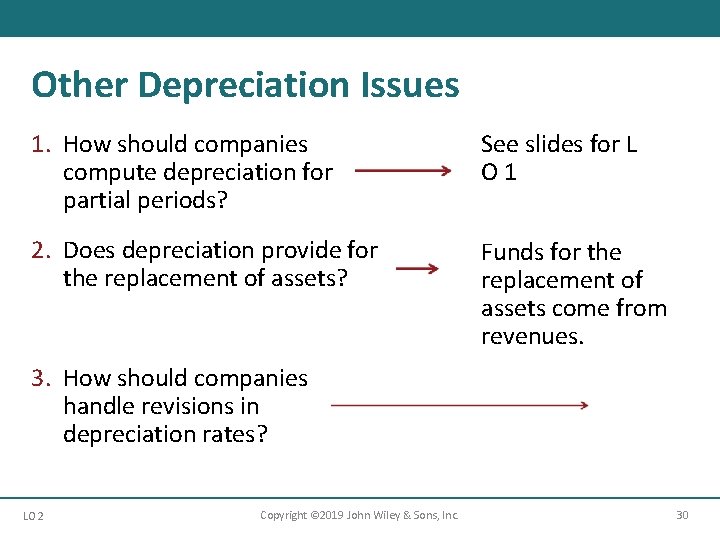
Other Depreciation Issues 1. How should companies compute depreciation for partial periods? See slides for L O 1 2. Does depreciation provide for the replacement of assets? Funds for the replacement of assets come from revenues. 3. How should companies handle revisions in depreciation rates? LO 2 Copyright © 2019 John Wiley & Sons, Inc. 30
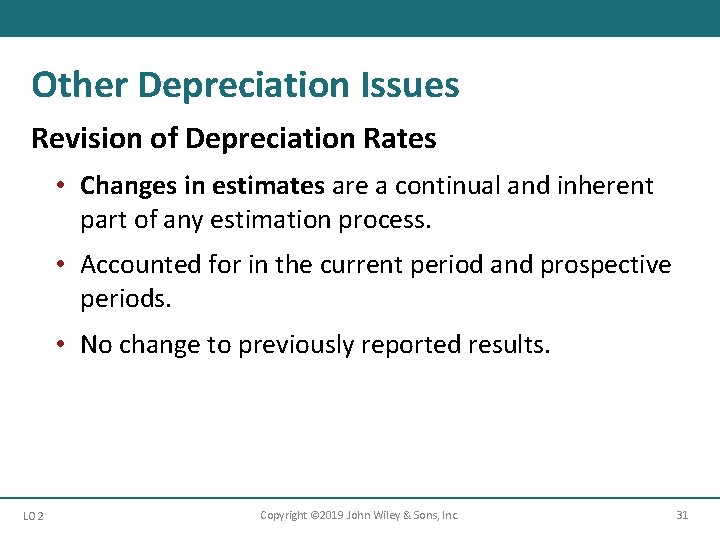
Other Depreciation Issues Revision of Depreciation Rates • Changes in estimates are a continual and inherent part of any estimation process. • Accounted for in the current period and prospective periods. • No change to previously reported results. LO 2 Copyright © 2019 John Wiley & Sons, Inc. 31
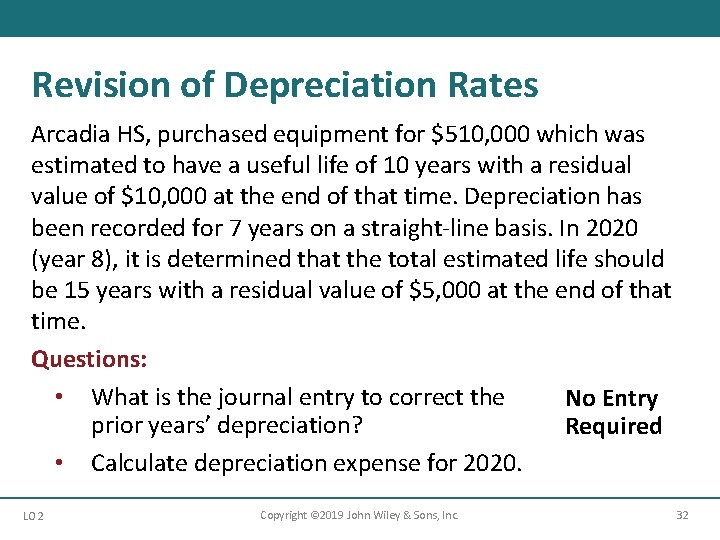
Revision of Depreciation Rates Arcadia HS, purchased equipment for $510, 000 which was estimated to have a useful life of 10 years with a residual value of $10, 000 at the end of that time. Depreciation has been recorded for 7 years on a straight-line basis. In 2020 (year 8), it is determined that the total estimated life should be 15 years with a residual value of $5, 000 at the end of that time. Questions: • What is the journal entry to correct the No Entry prior years’ depreciation? Required • Calculate depreciation expense for 2020. LO 2 Copyright © 2019 John Wiley & Sons, Inc. 32
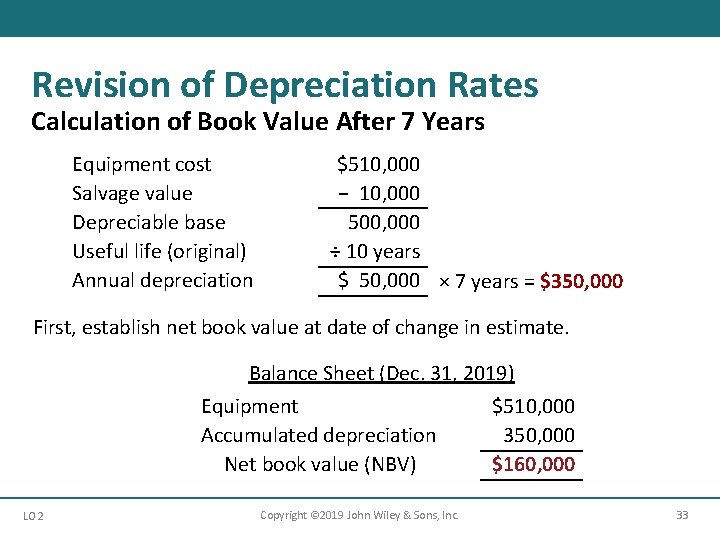
Revision of Depreciation Rates Calculation of Book Value After 7 Years Equipment cost Salvage value Depreciable base Useful life (original) Annual depreciation $510, 000 − 10, 000 500, 000 ÷ 10 years $ 50, 000 × 7 years = $350, 000 First, establish net book value at date of change in estimate. Balance Sheet (Dec. 31, 2019) Equipment $510, 000 Accumulated depreciation 350, 000 Net book value (NBV) $160, 000 LO 2 Copyright © 2019 John Wiley & Sons, Inc. 33
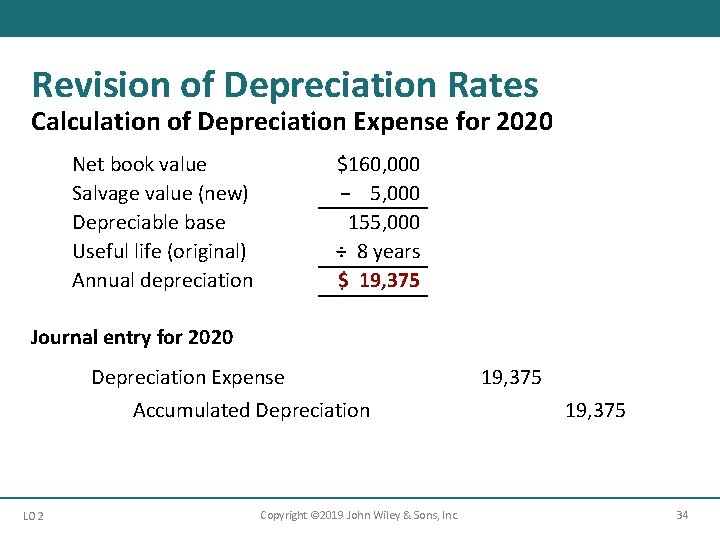
Revision of Depreciation Rates Calculation of Depreciation Expense for 2020 Net book value Salvage value (new) Depreciable base Useful life (original) Annual depreciation $160, 000 − 5, 000 155, 000 ÷ 8 years $ 19, 375 Journal entry for 2020 Depreciation Expense Accumulated Depreciation LO 2 Copyright © 2019 John Wiley & Sons, Inc. 19, 375 34
Learning Objective 3 Identify the Accounting Issues Related to Asset Impairment LO 3 Copyright © 2019 John Wiley & Sons, Inc. 35
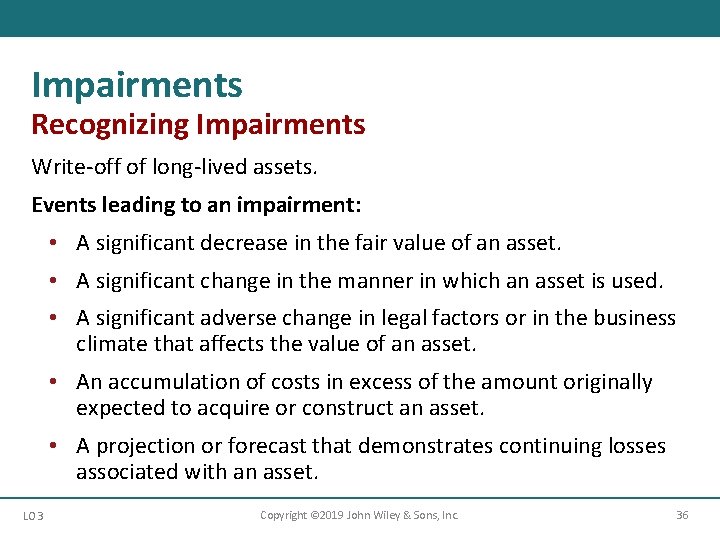
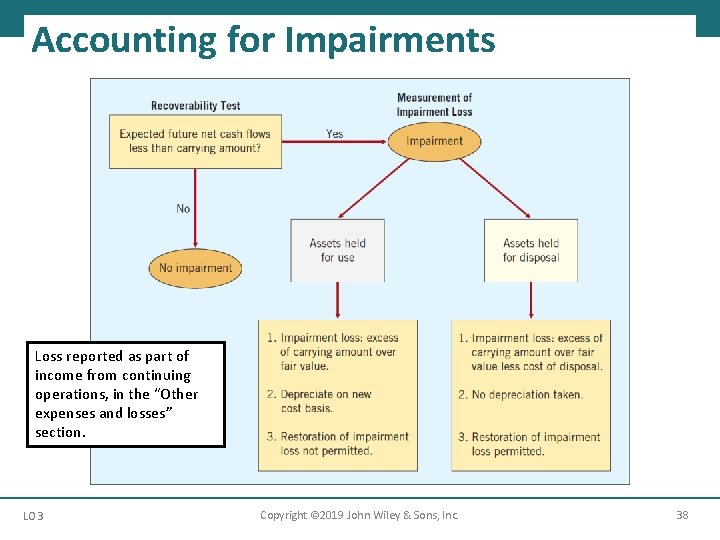
Impairments Recognizing Impairments Write-off of long-lived assets. Events leading to an impairment: • A significant decrease in the fair value of an asset. • A significant change in the manner in which an asset is used. • A significant adverse change in legal factors or in the business climate that affects the value of an asset. • An accumulation of costs in excess of the amount originally expected to acquire or construct an asset. • A projection or forecast that demonstrates continuing losses associated with an asset. LO 3 Copyright © 2019 John Wiley & Sons, Inc. 36
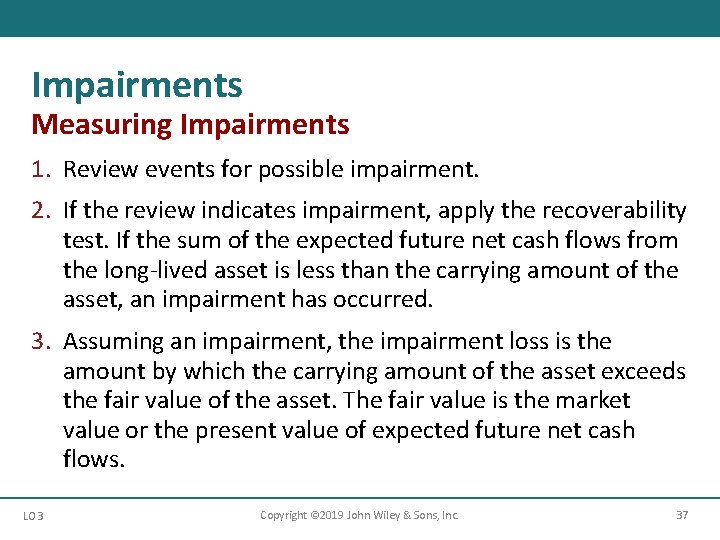
Impairments Measuring Impairments 1. Review events for possible impairment. 2. If the review indicates impairment, apply the recoverability test. If the sum of the expected future net cash flows from the long-lived asset is less than the carrying amount of the asset, an impairment has occurred. 3. Assuming an impairment, the impairment loss is the amount by which the carrying amount of the asset exceeds the fair value of the asset. The fair value is the market value or the present value of expected future net cash flows. LO 3 Copyright © 2019 John Wiley & Sons, Inc. 37
Accounting for Impairments Loss reported as part of income from continuing operations, in the “Other expenses and losses” section. LO 3 Copyright © 2019 John Wiley & Sons, Inc. 38
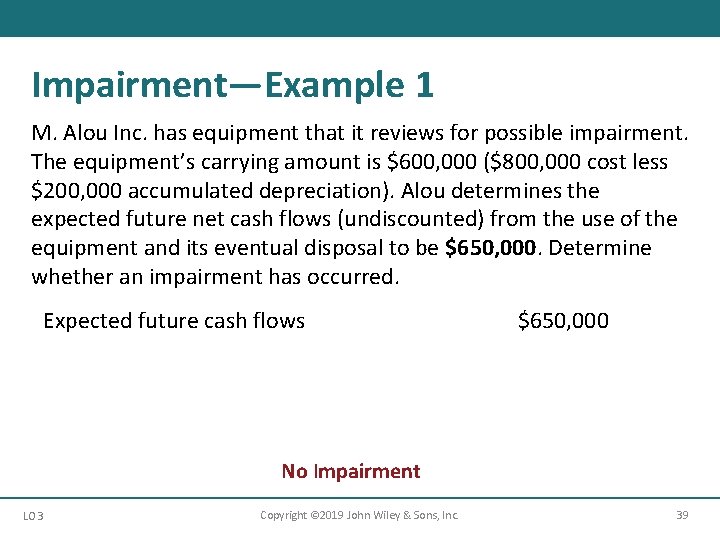
Impairment—Example 1 M. Alou Inc. has equipment that it reviews for possible impairment. The equipment’s carrying amount is $600, 000 ($800, 000 cost less $200, 000 accumulated depreciation). Alou determines the expected future net cash flows (undiscounted) from the use of the equipment and its eventual disposal to be $650, 000. Determine whether an impairment has occurred. Expected future cash flows Carrying value of asset: Cost Accumulated depreciation $650, 000 $800, 000 − 200, 000 600, 000 $ 50, 000 No Impairment LO 3 Copyright © 2019 John Wiley & Sons, Inc. 39
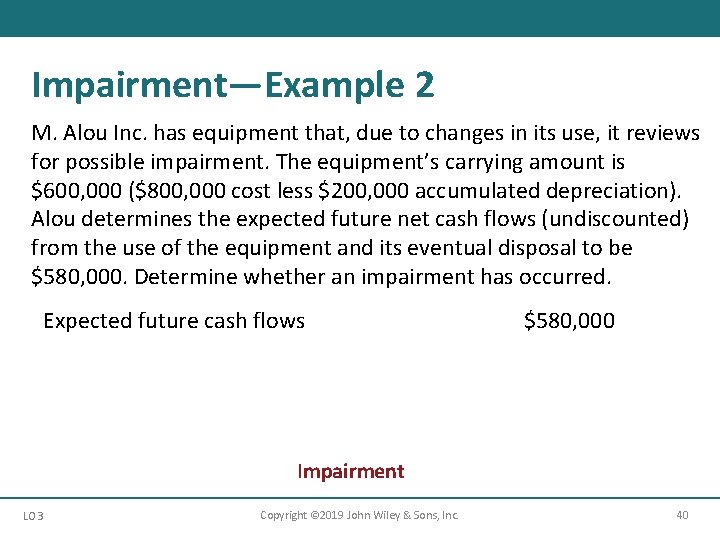
Impairment—Example 2 M. Alou Inc. has equipment that, due to changes in its use, it reviews for possible impairment. The equipment’s carrying amount is $600, 000 ($800, 000 cost less $200, 000 accumulated depreciation). Alou determines the expected future net cash flows (undiscounted) from the use of the equipment and its eventual disposal to be $580, 000. Determine whether an impairment has occurred. Expected future cash flows Carrying value of asset: Cost Accumulated depreciation $580, 000 $800, 000 − 200, 000 600, 000 − $ 20, 000 Impairment LO 3 Copyright © 2019 John Wiley & Sons, Inc. 40
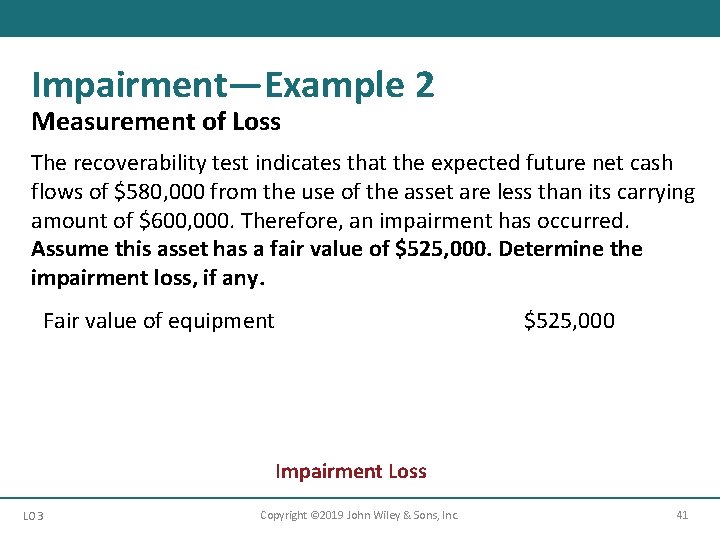
Impairment—Example 2 Measurement of Loss The recoverability test indicates that the expected future net cash flows of $580, 000 from the use of the asset are less than its carrying amount of $600, 000. Therefore, an impairment has occurred. Assume this asset has a fair value of $525, 000. Determine the impairment loss, if any. Fair value of equipment Carrying value of asset: Cost Accumulated depreciation $525, 000 $800, 000 − 200, 000 600, 000 − $ 75, 000 Impairment Loss LO 3 Copyright © 2019 John Wiley & Sons, Inc. 41
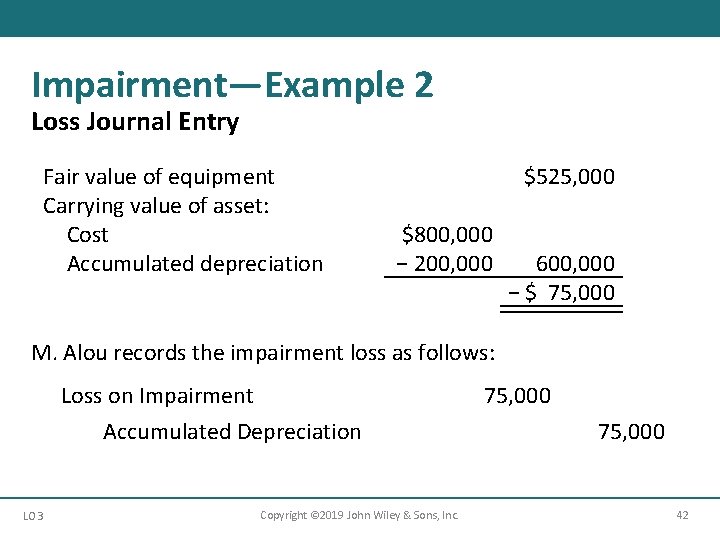
Impairment—Example 2 Loss Journal Entry Fair value of equipment Carrying value of asset: Cost Accumulated depreciation $525, 000 $800, 000 − 200, 000 600, 000 − $ 75, 000 M. Alou records the impairment loss as follows: Loss on Impairment Accumulated Depreciation LO 3 Copyright © 2019 John Wiley & Sons, Inc. 75, 000 42
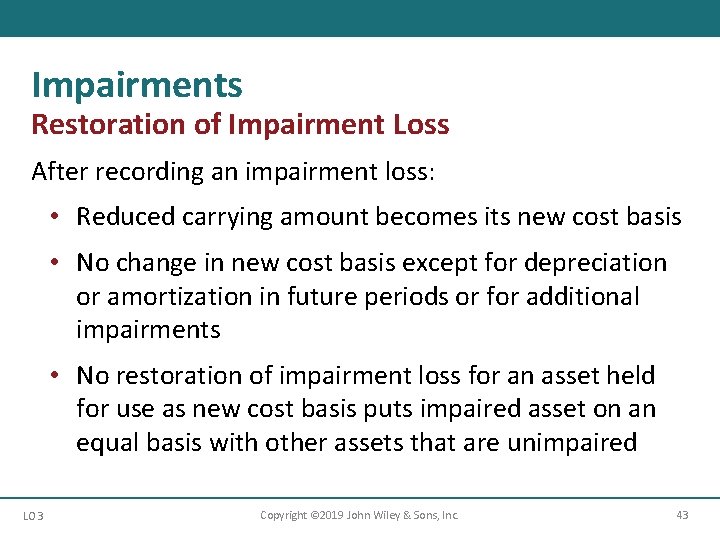
Impairments Restoration of Impairment Loss After recording an impairment loss: • Reduced carrying amount becomes its new cost basis • No change in new cost basis except for depreciation or amortization in future periods or for additional impairments • No restoration of impairment loss for an asset held for use as new cost basis puts impaired asset on an equal basis with other assets that are unimpaired LO 3 Copyright © 2019 John Wiley & Sons, Inc. 43
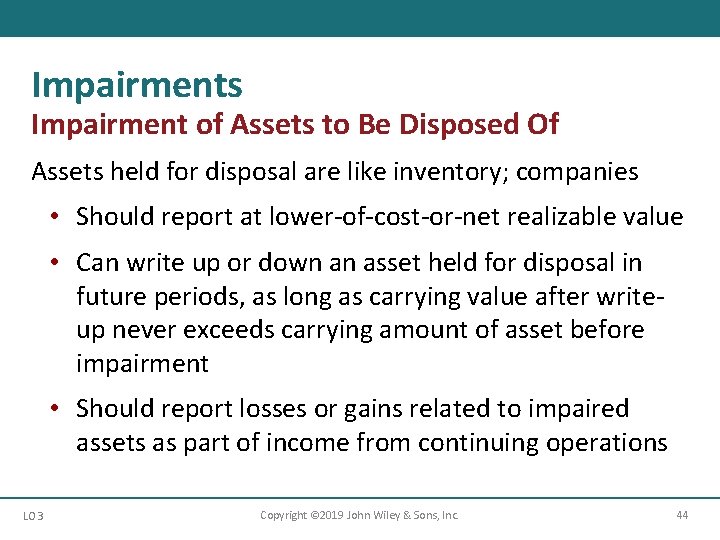
Impairments Impairment of Assets to Be Disposed Of Assets held for disposal are like inventory; companies • Should report at lower-of-cost-or-net realizable value • Can write up or down an asset held for disposal in future periods, as long as carrying value after writeup never exceeds carrying amount of asset before impairment • Should report losses or gains related to impaired assets as part of income from continuing operations LO 3 Copyright © 2019 John Wiley & Sons, Inc. 44
Learning Objective 4 Explain the Accounting Procedures for Depletion of Natural Resources LO 4 Copyright © 2019 John Wiley & Sons, Inc. 45
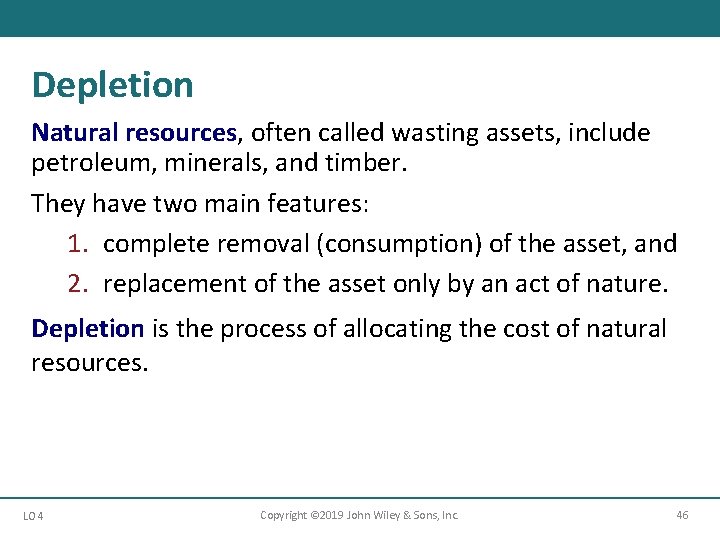
Depletion Natural resources, often called wasting assets, include petroleum, minerals, and timber. They have two main features: 1. complete removal (consumption) of the asset, and 2. replacement of the asset only by an act of nature. Depletion is the process of allocating the cost of natural resources. LO 4 Copyright © 2019 John Wiley & Sons, Inc. 46
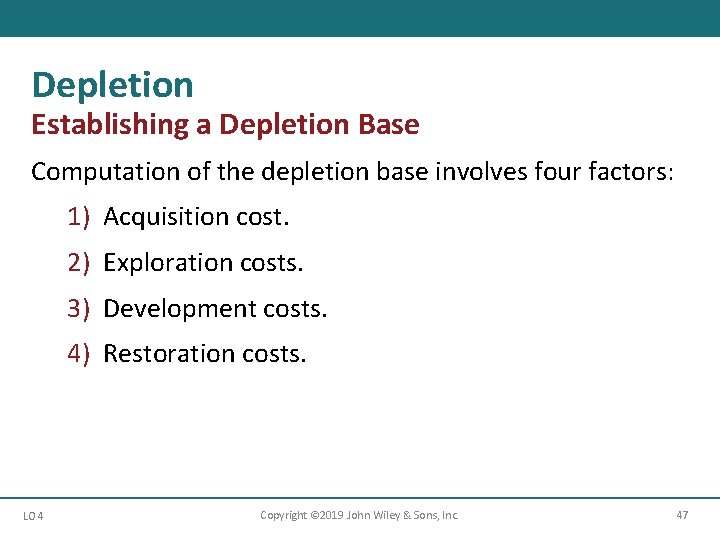
Depletion Establishing a Depletion Base Computation of the depletion base involves four factors: 1) Acquisition cost. 2) Exploration costs. 3) Development costs. 4) Restoration costs. LO 4 Copyright © 2019 John Wiley & Sons, Inc. 47
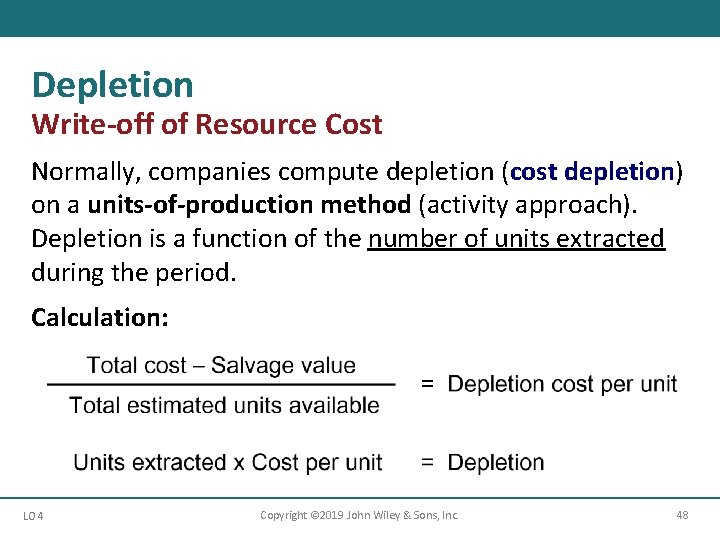
Depletion Write-off of Resource Cost Normally, companies compute depletion (cost depletion) on a units-of-production method (activity approach). Depletion is a function of the number of units extracted during the period. Calculation: LO 4 Copyright © 2019 John Wiley & Sons, Inc. 48
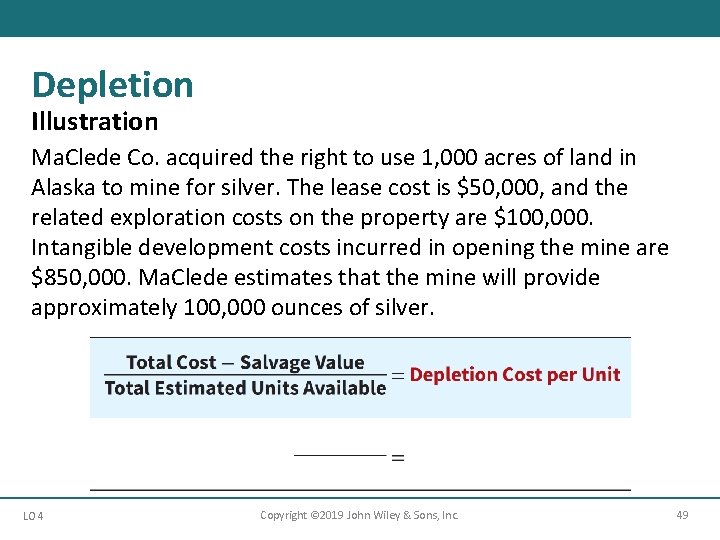
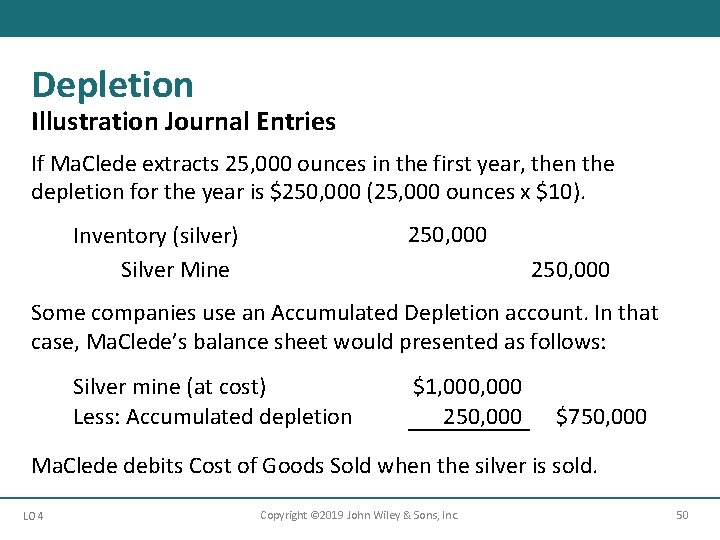
Depletion Illustration Ma. Clede Co. acquired the right to use 1, 000 acres of land in Alaska to mine for silver. The lease cost is $50, 000, and the related exploration costs on the property are $100, 000. Intangible development costs incurred in opening the mine are $850, 000. Ma. Clede estimates that the mine will provide approximately 100, 000 ounces of silver. LO 4 Copyright © 2019 John Wiley & Sons, Inc. 49
Depletion Illustration Journal Entries If Ma. Clede extracts 25, 000 ounces in the first year, then the depletion for the year is $250, 000 (25, 000 ounces x $10). 250, 000 Inventory (silver) Silver Mine 250, 000 Some companies use an Accumulated Depletion account. In that case, Ma. Clede’s balance sheet would presented as follows: Silver mine (at cost) Less: Accumulated depletion $1, 000 250, 000 $750, 000 Ma. Clede debits Cost of Goods Sold when the silver is sold. LO 4 Copyright © 2019 John Wiley & Sons, Inc. 50
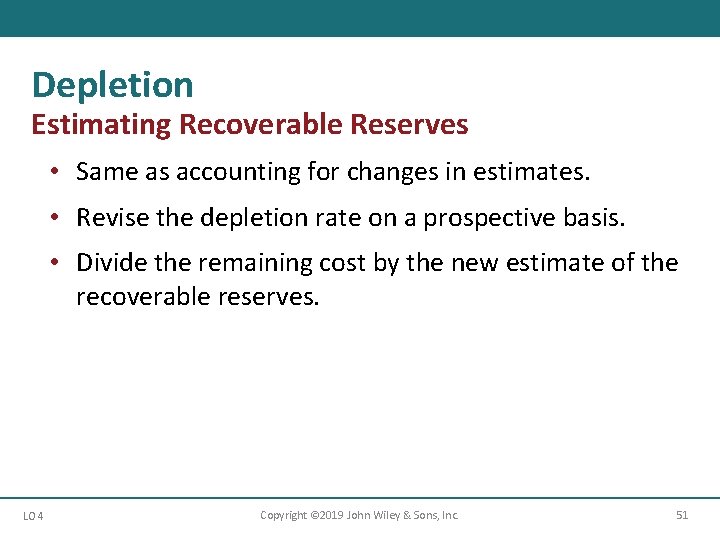
Depletion Estimating Recoverable Reserves • Same as accounting for changes in estimates. • Revise the depletion rate on a prospective basis. • Divide the remaining cost by the new estimate of the recoverable reserves. LO 4 Copyright © 2019 John Wiley & Sons, Inc. 51
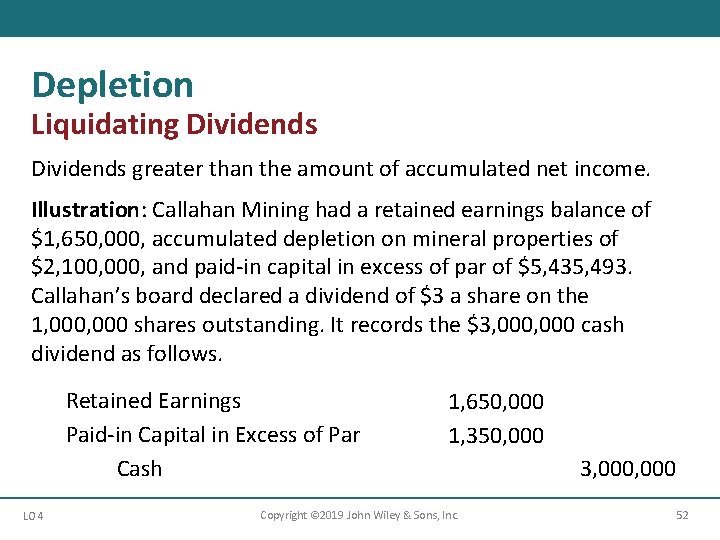
Depletion Liquidating Dividends greater than the amount of accumulated net income. Illustration: Callahan Mining had a retained earnings balance of $1, 650, 000, accumulated depletion on mineral properties of $2, 100, 000, and paid-in capital in excess of par of $5, 435, 493. Callahan’s board declared a dividend of $3 a share on the 1, 000 shares outstanding. It records the $3, 000 cash dividend as follows. Retained Earnings Paid-in Capital in Excess of Par Cash LO 4 1, 650, 000 1, 350, 000 Copyright © 2019 John Wiley & Sons, Inc. 3, 000 52
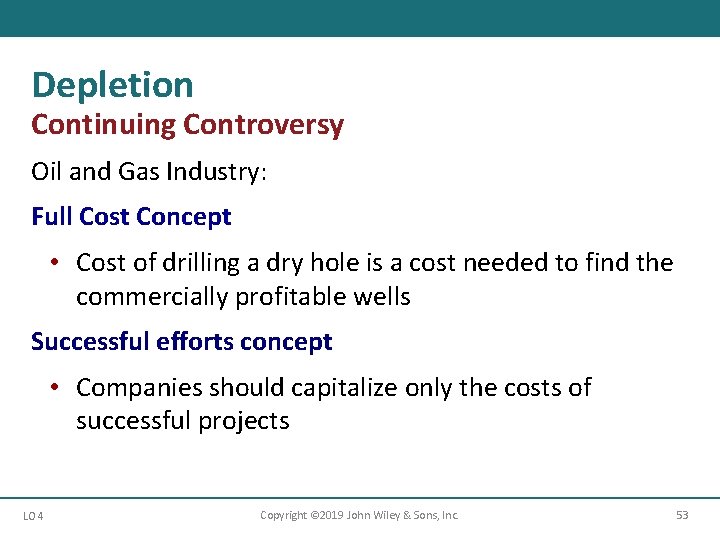
Depletion Continuing Controversy Oil and Gas Industry: Full Cost Concept • Cost of drilling a dry hole is a cost needed to find the commercially profitable wells Successful efforts concept • Companies should capitalize only the costs of successful projects LO 4 Copyright © 2019 John Wiley & Sons, Inc. 53
Learning Objective 5 Demonstrate How to Report and Analyze Property, Plant, Equipment, and Natural Resources LO 5 Copyright © 2019 John Wiley & Sons, Inc. 54
Presentation and Analysis Presentation of Property, Plant, Equipment, and Natural Resources Companies should disclose the following. 1. Depreciation expense for the period. 2. Balances of major classes of depreciable assets, by nature and function. 3. Accumulated depreciation. 4. A general description of the method or methods used in computing depreciation with respect to major classes of depreciable assets. LO 5 Copyright © 2019 John Wiley & Sons, Inc. 55
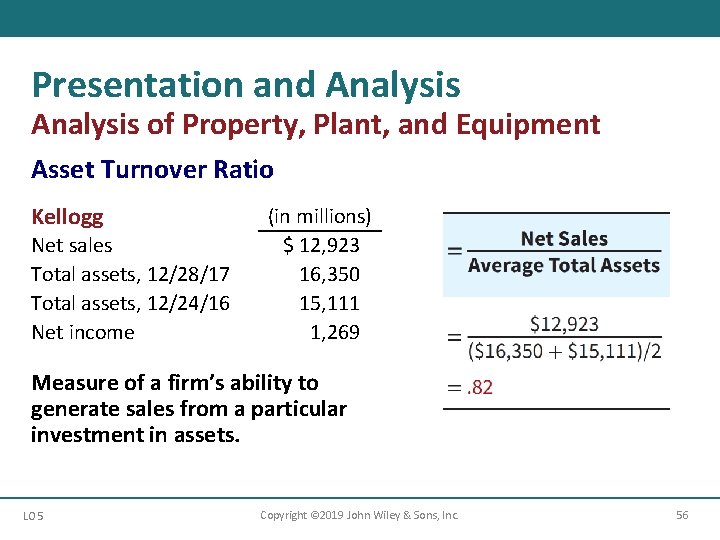
Presentation and Analysis of Property, Plant, and Equipment Asset Turnover Ratio Kellogg Net sales Total assets, 12/28/17 Total assets, 12/24/16 Net income (in millions) $ 12, 923 16, 350 15, 111 1, 269 Measure of a firm’s ability to generate sales from a particular investment in assets. LO 5 Copyright © 2019 John Wiley & Sons, Inc. 56
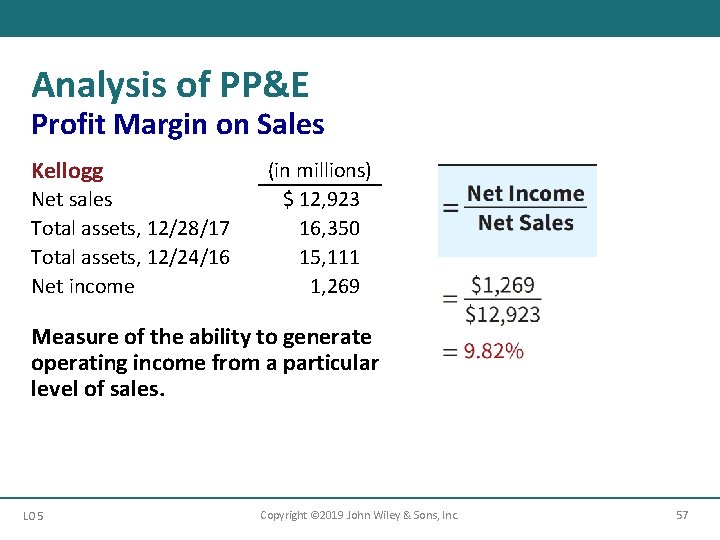
Analysis of PP&E Profit Margin on Sales Kellogg Net sales Total assets, 12/28/17 Total assets, 12/24/16 Net income (in millions) $ 12, 923 16, 350 15, 111 1, 269 Measure of the ability to generate operating income from a particular level of sales. LO 5 Copyright © 2019 John Wiley & Sons, Inc. 57
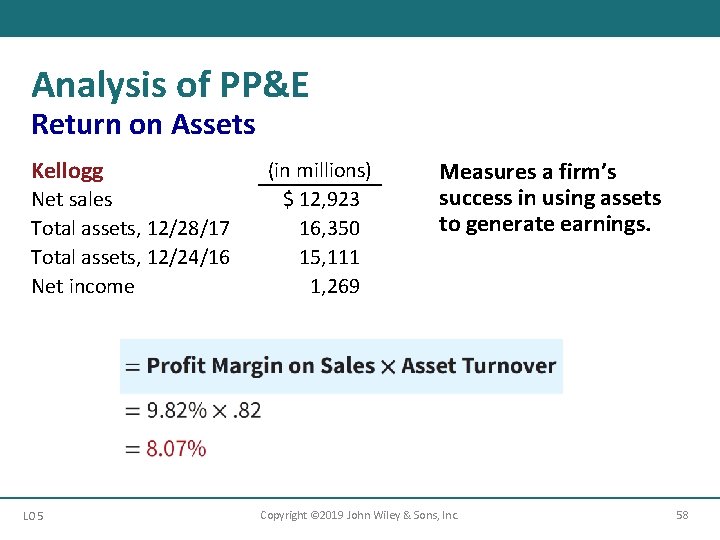
Analysis of PP&E Return on Assets Kellogg Net sales Total assets, 12/28/17 Total assets, 12/24/16 Net income LO 5 (in millions) $ 12, 923 16, 350 15, 111 1, 269 Measures a firm’s success in using assets to generate earnings. Copyright © 2019 John Wiley & Sons, Inc. 58
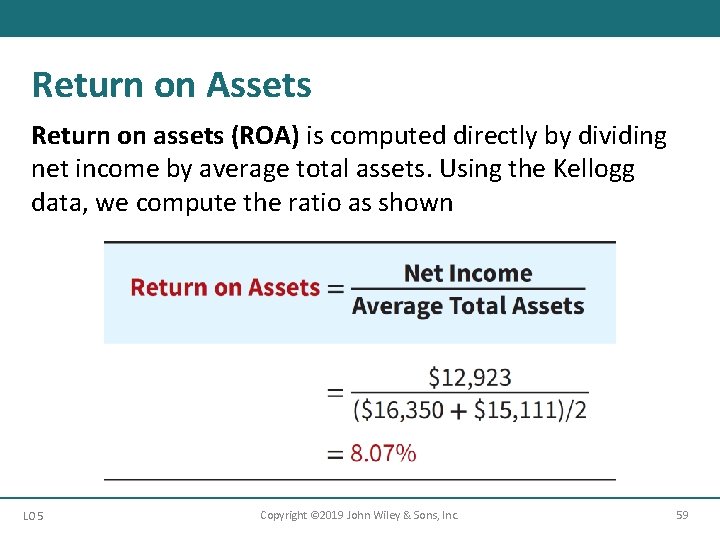
Return on Assets Return on assets (ROA) is computed directly by dividing net income by average total assets. Using the Kellogg data, we compute the ratio as shown LO 5 Copyright © 2019 John Wiley & Sons, Inc. 59
Learning Objective 6 Describe Income Tax Methods of Depreciation LO 6 Copyright © 2019 John Wiley & Sons, Inc. 60
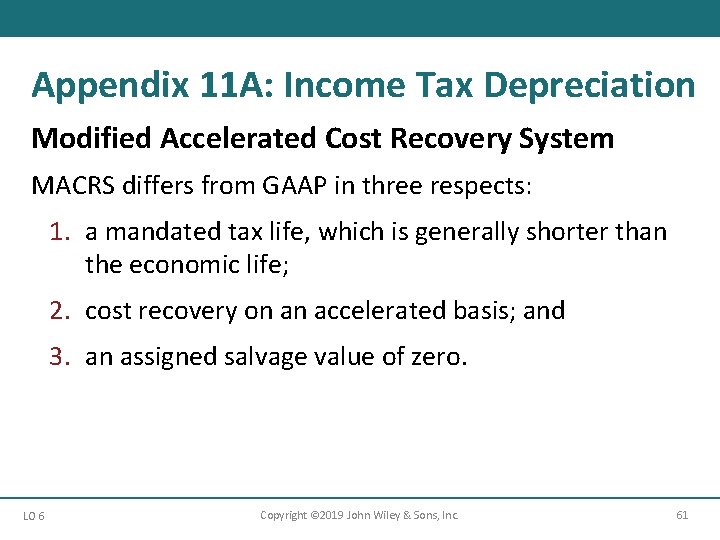
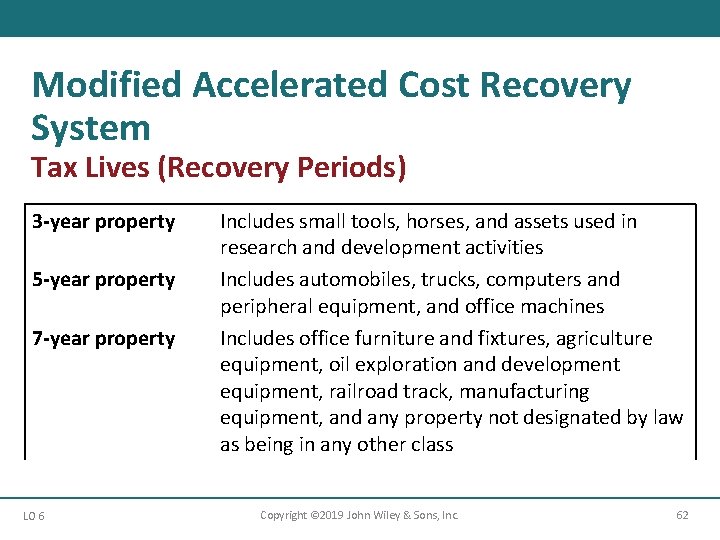
Appendix 11 A: Income Tax Depreciation Modified Accelerated Cost Recovery System MACRS differs from GAAP in three respects: 1. a mandated tax life, which is generally shorter than the economic life; 2. cost recovery on an accelerated basis; and 3. an assigned salvage value of zero. LO 6 Copyright © 2019 John Wiley & Sons, Inc. 61
Modified Accelerated Cost Recovery System Tax Lives (Recovery Periods) 3 -year property 5 -year property 7 -year property LO 6 Includes small tools, horses, and assets used in research and development activities Includes automobiles, trucks, computers and peripheral equipment, and office machines Includes office furniture and fixtures, agriculture equipment, oil exploration and development equipment, railroad track, manufacturing equipment, and any property not designated by law as being in any other class Copyright © 2019 John Wiley & Sons, Inc. 62
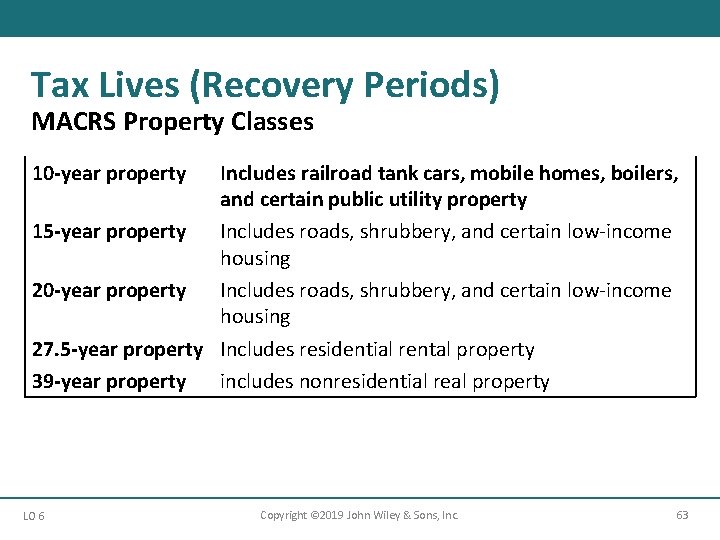
Tax Lives (Recovery Periods) MACRS Property Classes 10 -year property Includes railroad tank cars, mobile homes, boilers, and certain public utility property 15 -year property Includes roads, shrubbery, and certain low-income housing 20 -year property Includes roads, shrubbery, and certain low-income housing 27. 5 -year property Includes residential rental property 39 -year property includes nonresidential real property LO 6 Copyright © 2019 John Wiley & Sons, Inc. 63
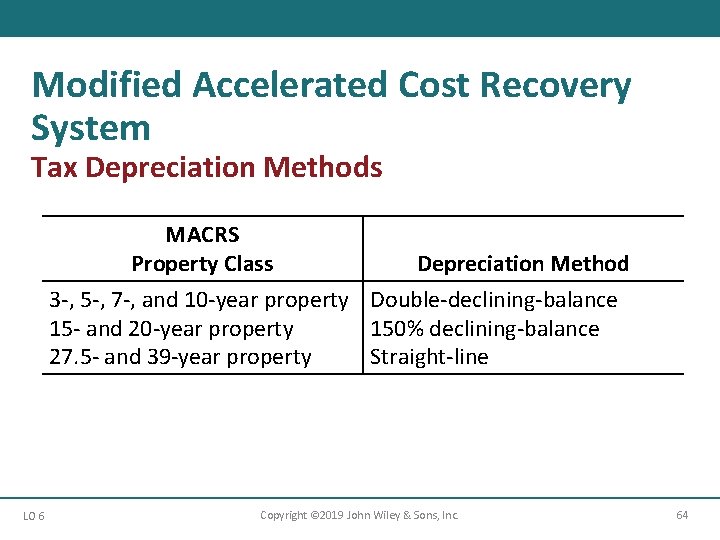
Modified Accelerated Cost Recovery System Tax Depreciation Methods MACRS Property Class Depreciation Method 3 -, 5 -, 7 -, and 10 -year property Double-declining-balance 15 - and 20 -year property 150% declining-balance 27. 5 - and 39 -year property Straight-line LO 6 Copyright © 2019 John Wiley & Sons, Inc. 64
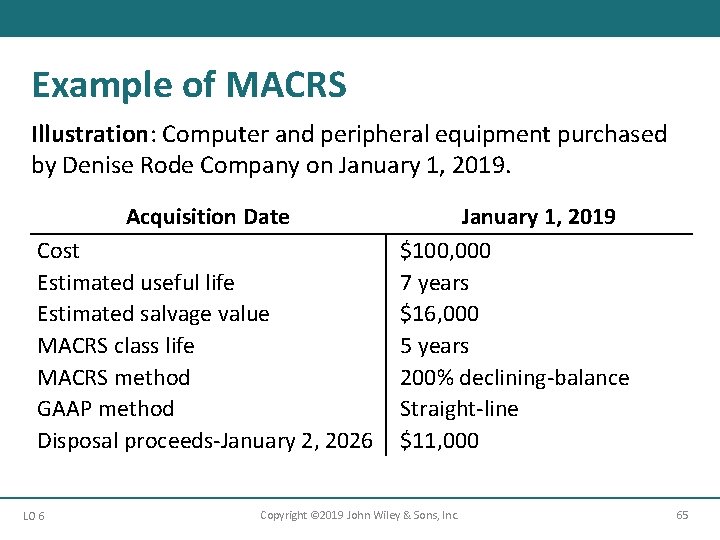
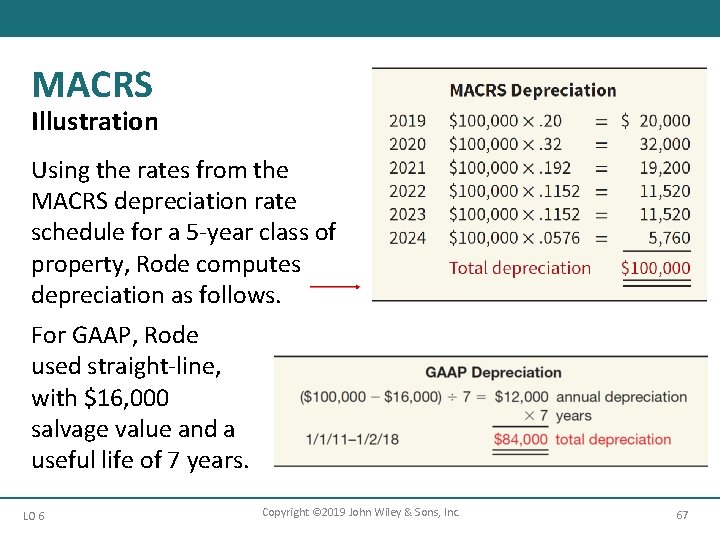
Example of MACRS Illustration: Computer and peripheral equipment purchased by Denise Rode Company on January 1, 2019. Acquisition Date Cost Estimated useful life Estimated salvage value MACRS class life MACRS method GAAP method Disposal proceeds-January 2, 2026 LO 6 January 1, 2019 $100, 000 7 years $16, 000 5 years 200% declining-balance Straight-line $11, 000 Copyright © 2019 John Wiley & Sons, Inc. 65
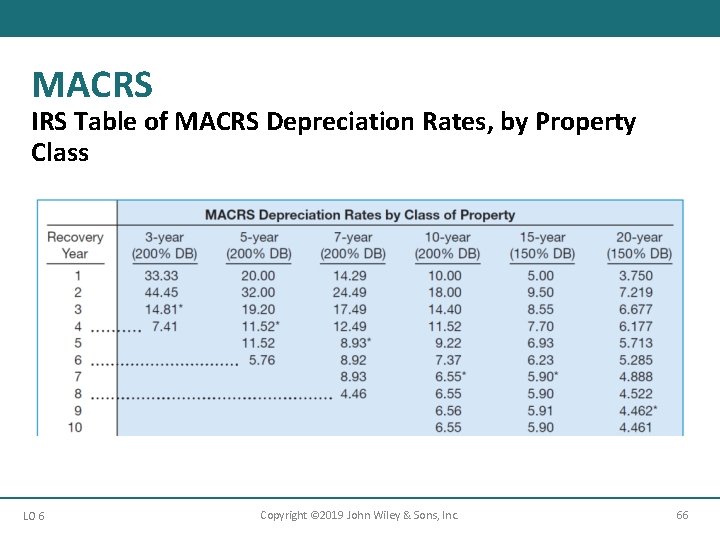
MACRS IRS Table of MACRS Depreciation Rates, by Property Class LO 6 Copyright © 2019 John Wiley & Sons, Inc. 66
MACRS Illustration Using the rates from the MACRS depreciation rate schedule for a 5 -year class of property, Rode computes depreciation as follows. For GAAP, Rode used straight-line, with $16, 000 salvage value and a useful life of 7 years. LO 6 Copyright © 2019 John Wiley & Sons, Inc. 67
Optional Straight-line Method • Applies to six classes of property previously described • Applies the straight-line method to the MACRS recovery periods • Ignores salvage value LO 6 Copyright © 2019 John Wiley & Sons, Inc. 68
Tax Versus Book Depreciation Tax laws and financial reporting have different objectives. The purpose of: • Taxation is to raise revenue from constituents in an equitable manner • Financial reporting is to reflect the economic substance of a transaction as closely as possible and to help predict amounts, timing, and uncertainty of future cash flows The adoption of one method for both tax and book purposes in all cases is not in accordance with GAAP. LO 6 Copyright © 2019 John Wiley & Sons, Inc. 69
Learning Objective 7 Compare the Accounting for Property, Plant, and Equipment Under GAAP and IFRS LO 7 Copyright © 2019 John Wiley & Sons, Inc. 70
IFRS Insights Relevant Facts – Similarities • The definition of property, plant, and equipment is essentially the same under GAAP and IFRS. • Under both GAAP and IFRS, changes in depreciation method and changes in useful life are treated in the current and future periods. Prior periods are not affected. • The accounting for plant asset disposals is the same under GAAP and IFRS. • The accounting for the initial costs to acquire natural resources is similar under GAAP and IFRS. • Under both GAAP and IFRS, interest costs incurred during construction must be capitalized. Recently, IFRS converged to GAAP. LO 7 Copyright © 2019 John Wiley & Sons, Inc. 71
IFRS Insights Relevant Facts – Similarities • The accounting for exchanges of nonmonetary assets has recently converged between IFRS and GAAP now requires that gains on exchanges of nonmonetary assets be recognized if the exchange has commercial substance. This is the same framework used in IFRS. • GAAP also views depreciation as allocation of cost over an asset’s life. GAAP permits the same depreciation methods (straight-line, diminishing-balance, units-of-production) as IFRS. LO 7 Copyright © 2019 John Wiley & Sons, Inc. 72
IFRS Insights Relevant Facts – Differences • IFRS requires component depreciation. Under GAAP, component depreciation is permitted but is rarely used. • Under IFRS, companies can use either the historical cost model or the revaluation model. GAAP does not permit revaluations of property, plant, and equipment or mineral resources. • In testing for impairments of long-lived assets, GAAP uses a two-step model to test for impairments. As long as future undiscounted cash flows exceed the carrying amount of the asset, no impairment is recorded. The IFRS impairment test is stricter. However, unlike GAAP, reversals of impairment losses are permitted. LO 7 Copyright © 2019 John Wiley & Sons, Inc. 73
IFRS Insights On The Horizon With respect to revaluations, as part of the conceptual framework project, the Boards will examine the measurement bases used in accounting. It is too early to say whether a converged conceptual framework will recommend fair value measurement (and revaluation accounting) for property, plant, and equipment. However, this is likely to be one of the more contentious issues, given the long-standing use of historical cost as a measurement basis in GAAP. LO 7 Copyright © 2019 John Wiley & Sons, Inc. 74
Copyright © 2019 John Wiley & Sons, Inc. All rights reserved. Reproduction or translation of this work beyond that permitted in Section 117 of the 1976 United States Act without the express written permission of the copyright owner is unlawful. Request for further information should be addressed to the Permissions Department, John Wiley & Sons, Inc. The purchaser may make back-up copies for his/her own use only and not for distribution or resale. The Publisher assumes no responsibility for errors, omissions, or damages, caused by the use of these programs or from the use of the information contained herein. Copyright © 2019 John Wiley & Sons, Inc. 75