Infosys Investor Relations Infosys Technologies Limited 2004 2005





- Slides: 22
Infosys Investor Relations © Infosys Technologies Limited 2004 -2005 1
Infosys Technologies Limited Financial Year 2004 - 2005 First Quarter Results July 13, 2004 12/5/2020 © Infosys Technologies Limited 2004 -2005 2 2
Safe Harbor Certain statements in this release concerning our future growth prospects are forward-looking statements, which involve a number of risks, and uncertainties that could cause actual results to differ materially from those in such forward-looking statements. The risks and uncertainties relating to these statements include, but are not limited to, risks and uncertainties regarding fluctuations in earnings, our ability to manage growth, intense competition in IT services including those factors which may affect our cost advantage, wage increases in India, our ability to attract and retain highly skilled professionals, time and cost overruns on fixed- price, fixed-time frame contracts, client concentration, restrictions on immigration, industry segment concentration, our ability to manage our international operations, reduced demand for technology in our key focus areas, disruptions in telecommunication networks or system failures, our ability to successfully complete and integrate potential acquisitions, liability for damages on our service contracts, the success of the companies in which Infosys has made strategic investments, withdrawal of governmental fiscal incentives, political instability and regional conflicts, legal restrictions on raising capital or acquiring companies outside India, and unauthorized use of our intellectual property and general economic conditions affecting our industry. Additional risks that could affect our future operating results are more fully described in our United States Securities and Exchange Commission filings including our Annual Report on Form 20 -F for the fiscal year ended March 31, 2004. These filings are available at www. sec. gov. Infosys may, from time to time, make additional written and oral forward looking statements, including statements contained in the company’s filings with the Securities and Exchange Commission and our reports to shareholders. The company does not undertake to update any forward-looking statement that may be made from time to time by or on behalf of the company. 12/5/2020 © Infosys Technologies Limited 2004 -2005 3 3
Contents Ø Highlights Ø Operational Performance Ø Financial Performance Ø Guidance 12/5/2020 © Infosys Technologies Limited 2004 -2005 4 4
Highlights © Infosys Technologies Limited 2004 -2005 5
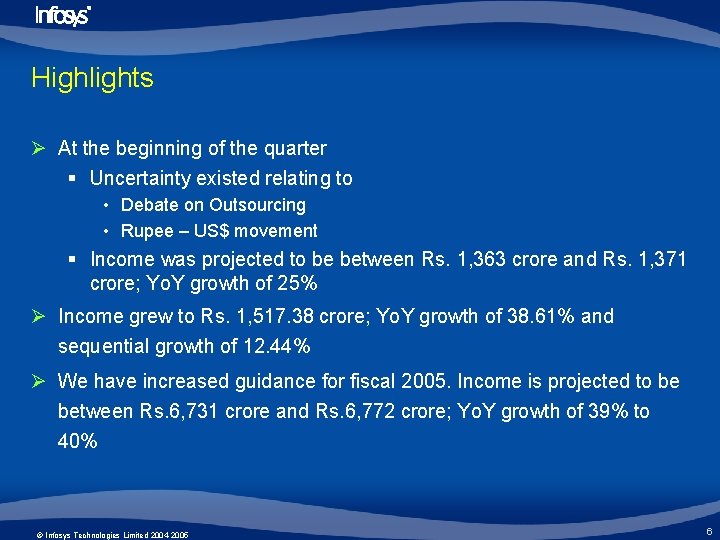
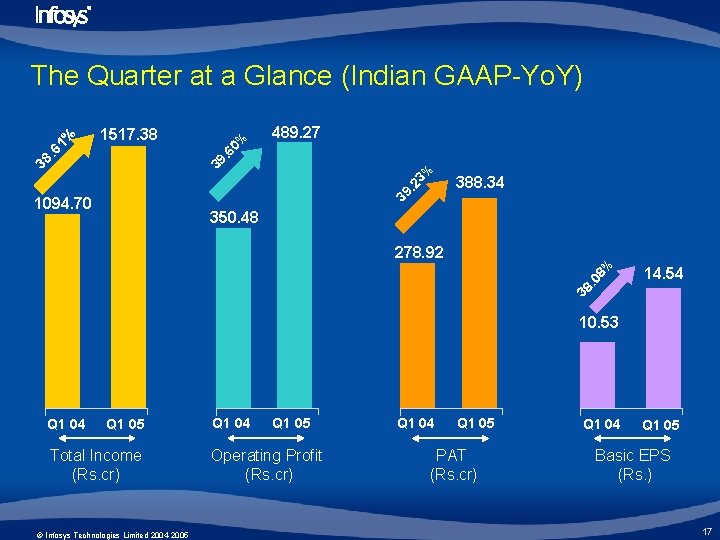
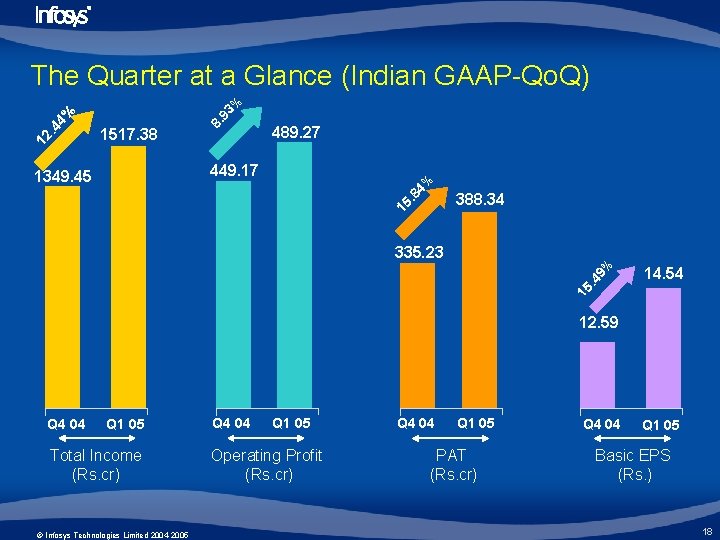
Highlights Ø At the beginning of the quarter § Uncertainty existed relating to • Debate on Outsourcing • Rupee – US$ movement § Income was projected to be between Rs. 1, 363 crore and Rs. 1, 371 crore; Yo. Y growth of 25% Ø Income grew to Rs. 1, 517. 38 crore; Yo. Y growth of 38. 61% and sequential growth of 12. 44% Ø We have increased guidance for fiscal 2005. Income is projected to be between Rs. 6, 731 crore and Rs. 6, 772 crore; Yo. Y growth of 39% to 40% 12/5/2020 © Infosys Technologies Limited 2004 -2005 6 6
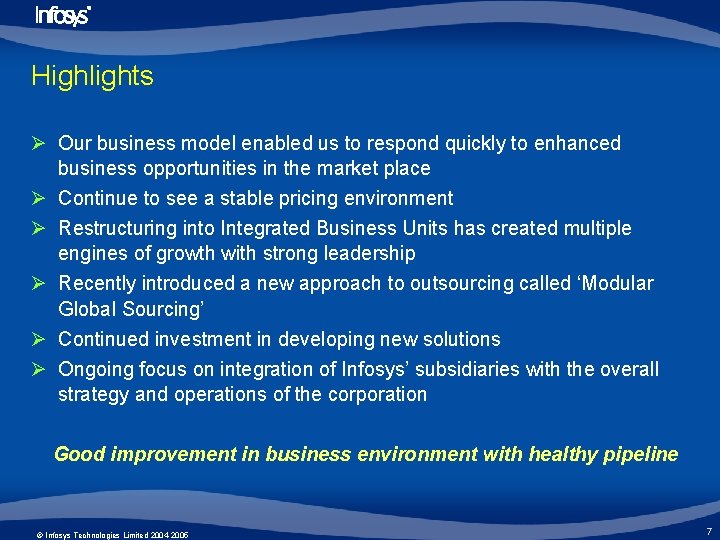
Highlights Ø Our business model enabled us to respond quickly to enhanced business opportunities in the market place Ø Continue to see a stable pricing environment Ø Restructuring into Integrated Business Units has created multiple engines of growth with strong leadership Ø Recently introduced a new approach to outsourcing called ‘Modular Global Sourcing’ Ø Continued investment in developing new solutions Ø Ongoing focus on integration of Infosys’ subsidiaries with the overall strategy and operations of the corporation Good improvement in business environment with healthy pipeline 12/5/2020 © Infosys Technologies Limited 2004 -2005 7 7
Operational Performance © Infosys Technologies Limited 2004 -2005 8
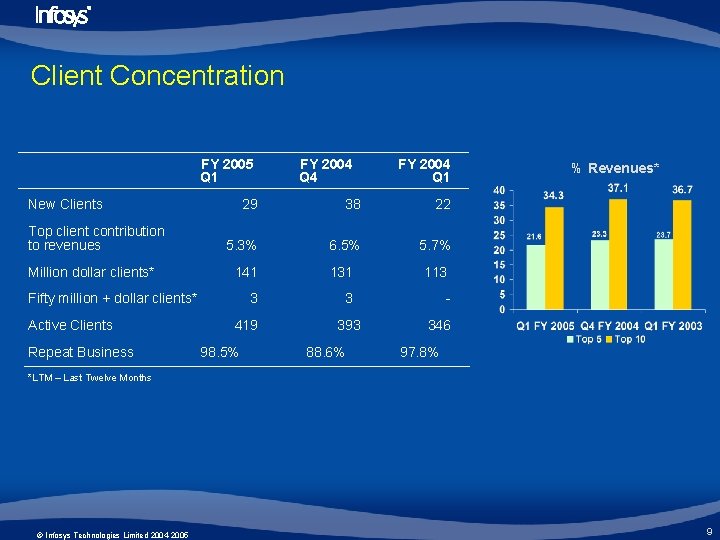
Client Concentration FY 2005 Q 1 FY 2004 Q 4 29 38 22 5. 3% 6. 5% 5. 7% 141 131 113 3 3 - New Clients Top client contribution to revenues Million dollar clients* Fifty million + dollar clients* Active Clients Repeat Business 419 98. 5% 393 88. 6% FY 2004 % Revenues* Q 1 346 97. 8% *LTM – Last Twelve Months 12/5/2020 © Infosys Technologies Limited 2004 -2005 9 9
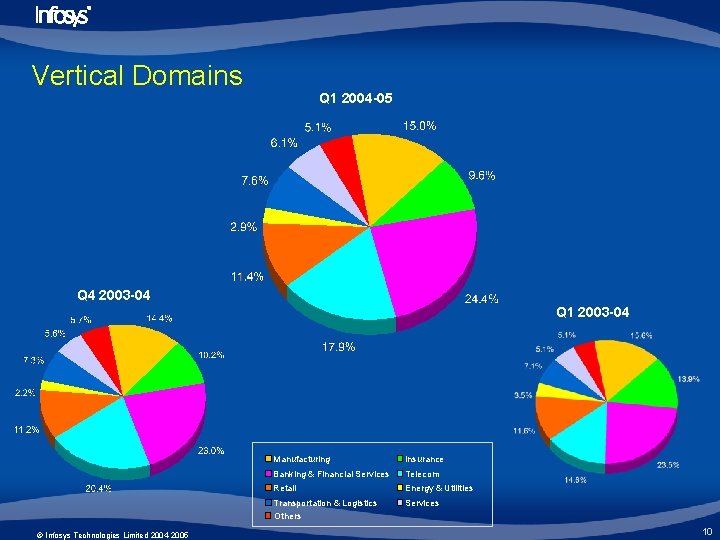
Vertical Domains Q 1 2004 -05 Q 4 2003 -04 Q 1 2003 -04 12/5/2020 © Infosys Technologies Limited 2004 -2005 Manufacturing Insurance Banking & Financial Services Telecom Retail Energy & Utilities Transportation & Logistics Others Services 10 10
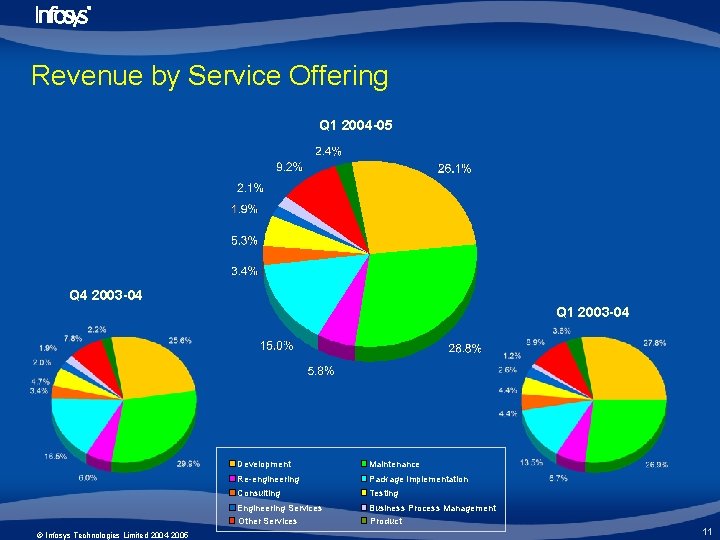
Revenue by Service Offering Q 1 2004 -05 Q 4 2003 -04 Q 1 2003 -04 12/5/2020 © Infosys Technologies Limited 2004 -2005 Development Maintenance Re-engineering Package Implementation Consulting Testing Engineering Services Other Services Business Process Management Product 11 11
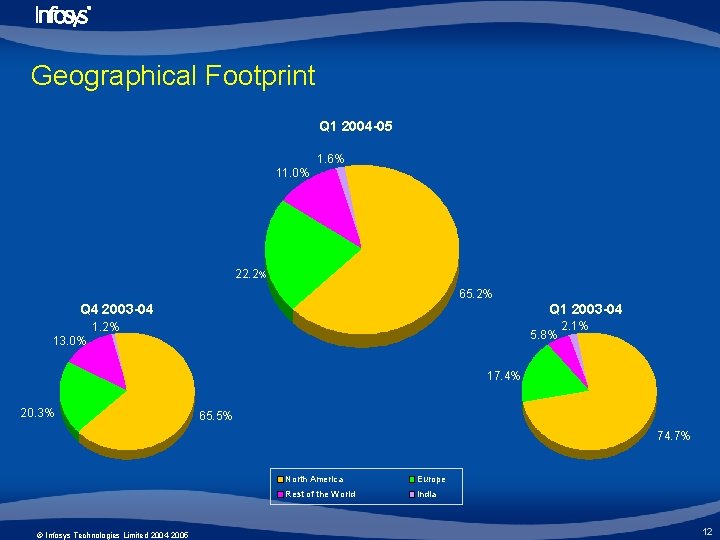
Geographical Footprint Q 1 2004 -05 1. 6% 11. 0% 22. 2% 65. 2% Q 4 2003 -04 Q 1 2003 -04 1. 2% 5. 8% 13. 0% 2. 1% 17. 4% 20. 3% 65. 5% 74. 7% 12/5/2020 © Infosys Technologies Limited 2004 -2005 North America Europe Rest of the World India 12 12
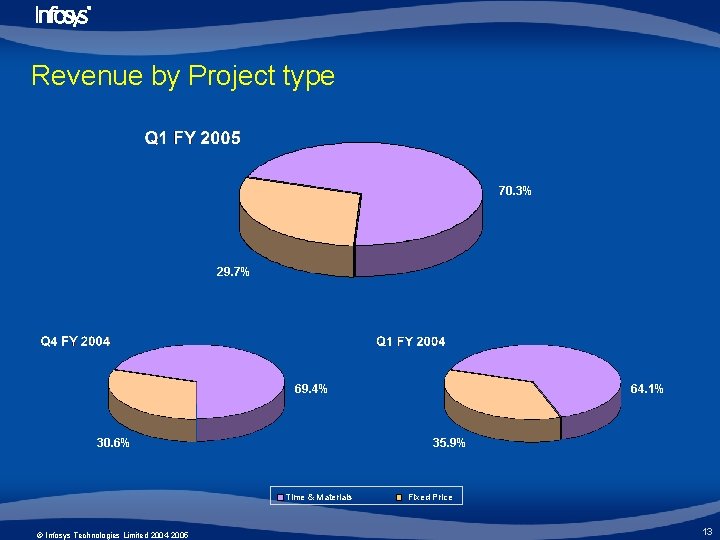
Revenue by Project type 70. 3% 29. 7% 69. 4% 30. 6% 12/5/2020 © Infosys Technologies Limited 2004 -2005 64. 1% 35. 9% Time & Materials Fixed Price 13 13
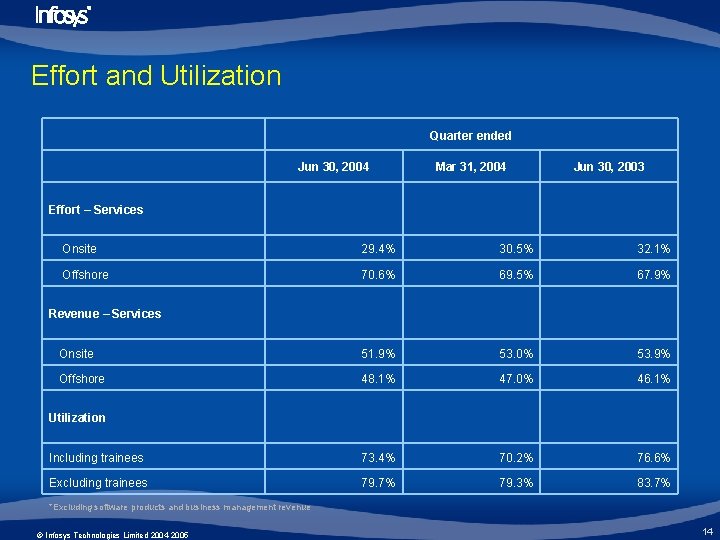
Effort and Utilization Quarter ended Jun 30, 2004 Mar 31, 2004 Jun 30, 2003 Onsite 29. 4% 30. 5% 32. 1% Offshore 70. 6% 69. 5% 67. 9% Onsite 51. 9% 53. 0% 53. 9% Offshore 48. 1% 47. 0% 46. 1% Including trainees 73. 4% 70. 2% 76. 6% Excluding trainees 79. 7% 79. 3% 83. 7% Effort – Services Revenue – Services Utilization 12/5/2020 *Excluding software products and business management revenue © Infosys Technologies Limited 2004 -2005 14 14
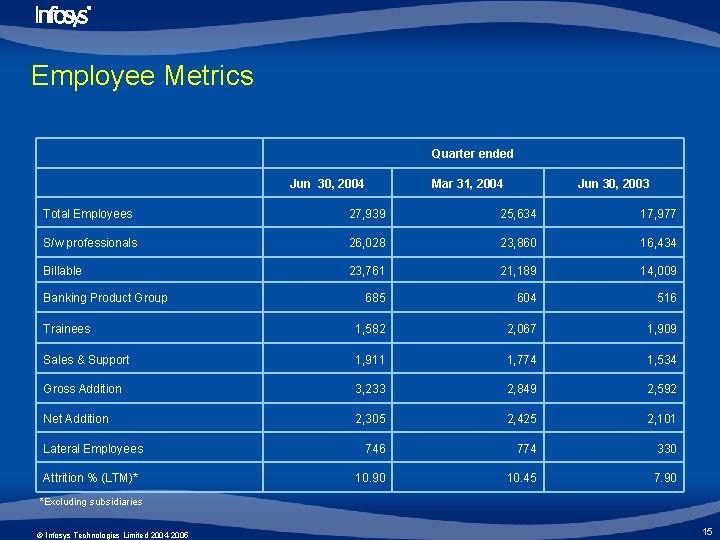
Employee Metrics Quarter ended Jun 30, 2004 Mar 31, 2004 Jun 30, 2003 Total Employees 27, 939 25, 634 17, 977 S/w professionals 26, 028 23, 860 16, 434 Billable 23, 761 21, 189 14, 009 685 604 516 Trainees 1, 582 2, 067 1, 909 Sales & Support 1, 911 1, 774 1, 534 Gross Addition 3, 233 2, 849 2, 592 Net Addition 2, 305 2, 425 2, 101 746 774 330 10. 90 10. 45 7. 90 Banking Product Group Lateral Employees Attrition % (LTM)* *Excluding subsidiaries 12/5/2020 © Infosys Technologies Limited 2004 -2005 15 15
Financial Performance © Infosys Technologies Limited 2004 -2005 16
489. 27 388. 34 39 . 2 3% 39 38 . 6 0% 1517. 38 . 6 1% The Quarter at a Glance (Indian GAAP-Yo. Y) 1094. 70 350. 48 14. 54 38 . 0 8% 278. 92 10. 53 Q 1 04 Q 1 05 Total Income (Rs. cr) 12/5/2020 © Infosys Technologies Limited 2004 -2005 Q 1 04 Q 1 05 Operating Profit (Rs. cr) Q 1 04 Q 1 05 PAT (Rs. cr) Q 1 04 Q 1 05 Basic EPS (Rs. ) 17 17
12 93 % 1517. 38 8. . 4 4% The Quarter at a Glance (Indian GAAP-Qo. Q) 489. 27 449. 17 15 . 8 4% 1349. 45 388. 34 14. 54 15 . 4 9% 335. 23 12. 59 Q 4 04 Q 1 05 Total Income (Rs. cr) 12/5/2020 © Infosys Technologies Limited 2004 -2005 Q 4 04 Q 1 05 Operating Profit (Rs. cr) Q 4 04 Q 1 05 PAT (Rs. cr) Q 4 04 Q 1 05 Basic EPS (Rs. ) 18 18
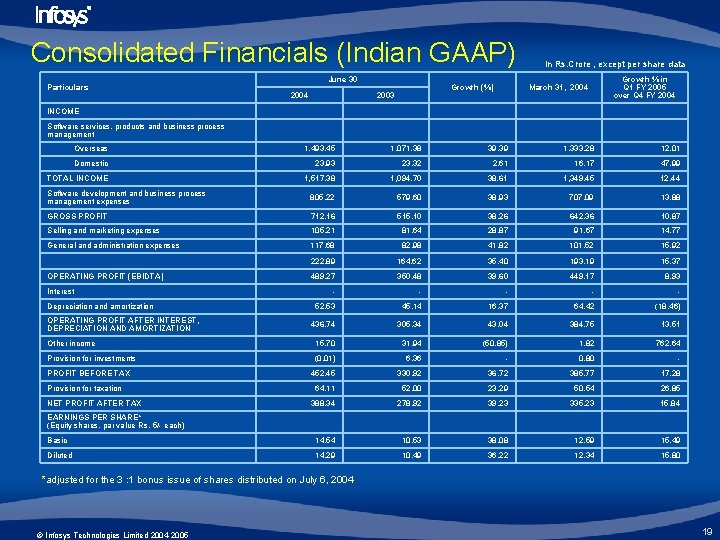
Consolidated Financials (Indian GAAP) Particulars June 30 2004 Growth (%) 2003 In Rs. Crore , except per share data Growth % in Q 1 FY 2005 over Q 4 FY 2004 March 31, 2004 INCOME Software services, products and business process management Overseas 1, 493. 45 1, 071. 38 39. 39 1, 333. 28 12. 01 Domestic 23. 93 23. 32 2. 61 16. 17 47. 99 TOTAL INCOME 1, 517. 38 1, 094. 70 38. 61 1, 349. 45 12. 44 Software development and business process management expenses 805. 22 579. 60 38. 93 707. 09 13. 88 GROSS PROFIT 712. 16 515. 10 38. 26 642. 36 10. 87 Selling and marketing expenses 105. 21 81. 64 28. 87 91. 67 14. 77 General and administration expenses 117. 68 82. 98 41. 82 101. 52 15. 92 222. 89 164. 62 35. 40 193. 19 15. 37 489. 27 350. 48 39. 60 449. 17 8. 93 - - - 52. 53 45. 14 16. 37 64. 42 (18. 46) 436. 74 305. 34 43. 04 384. 75 13. 51 15. 70 31. 94 (50. 85) 1. 82 762. 64 OPERATING PROFIT (EBIDTA) Interest Depreciation and amortization OPERATING PROFIT AFTER INTEREST, DEPRECIATION AND AMORTIZATION Other income Provision for investments (0. 01) 6. 36 - 0. 80 - PROFIT BEFORE TAX 452. 45 330. 92 36. 72 385. 77 17. 28 64. 11 52. 00 23. 29 50. 54 26. 85 388. 34 278. 92 39. 23 335. 23 15. 84 Basic 14. 54 10. 53 38. 08 12. 59 15. 49 Diluted 14. 29 10. 49 36. 22 12. 34 15. 80 Provision for taxation NET PROFIT AFTER TAX EARNINGS PER SHARE* (Equity shares, par value Rs. 5/- each) *adjusted for the 3 : 1 bonus issue of shares distributed on July 6, 2004 12/5/2020 © Infosys Technologies Limited 2004 -2005 19 19
Guidance © Infosys Technologies Limited 2004 -2005 20
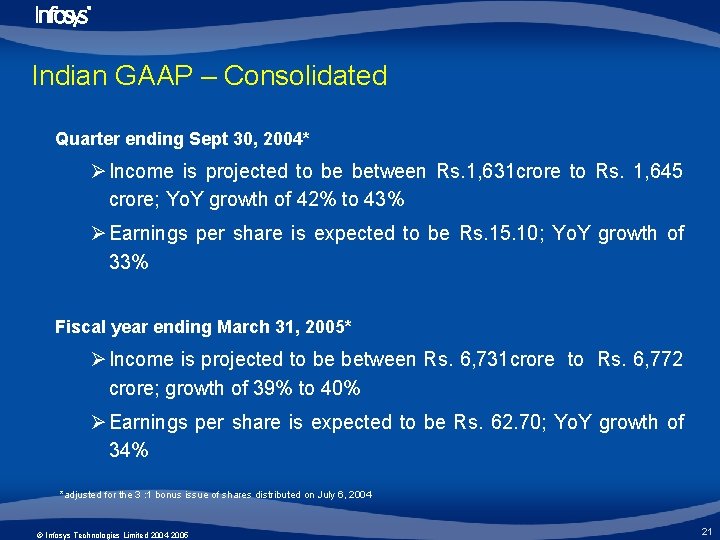
Indian GAAP – Consolidated Quarter ending Sept 30, 2004* Ø Income is projected to be between Rs. 1, 631 crore to Rs. 1, 645 crore; Yo. Y growth of 42% to 43% Ø Earnings per share is expected to be Rs. 15. 10; Yo. Y growth of 33% Fiscal year ending March 31, 2005* Ø Income is projected to be between Rs. 6, 731 crore to Rs. 6, 772 crore; growth of 39% to 40% Ø Earnings per share is expected to be Rs. 62. 70; Yo. Y growth of 34% *adjusted for the 3 : 1 bonus issue of shares distributed on July 6, 2004 12/5/2020 © Infosys Technologies Limited 2004 -2005 21 21
Thank You 22